Service indicators
EasySOA Registry can compute interesting indicators on the SOA model it manages that provide information about its consistency, its completion status and how much it is been appropriated by users.
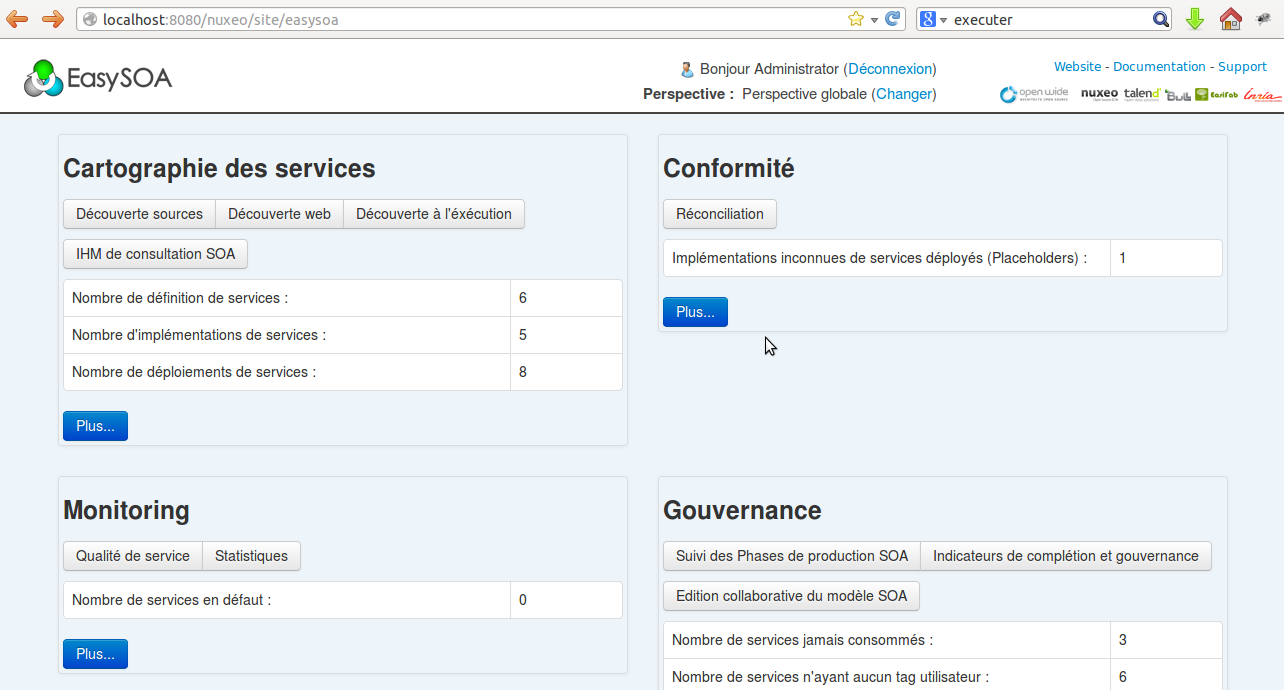
The home page displays a few main indicators for each functional Category (Cartography, Compliance, Monitoring and Governance).
Home page example :
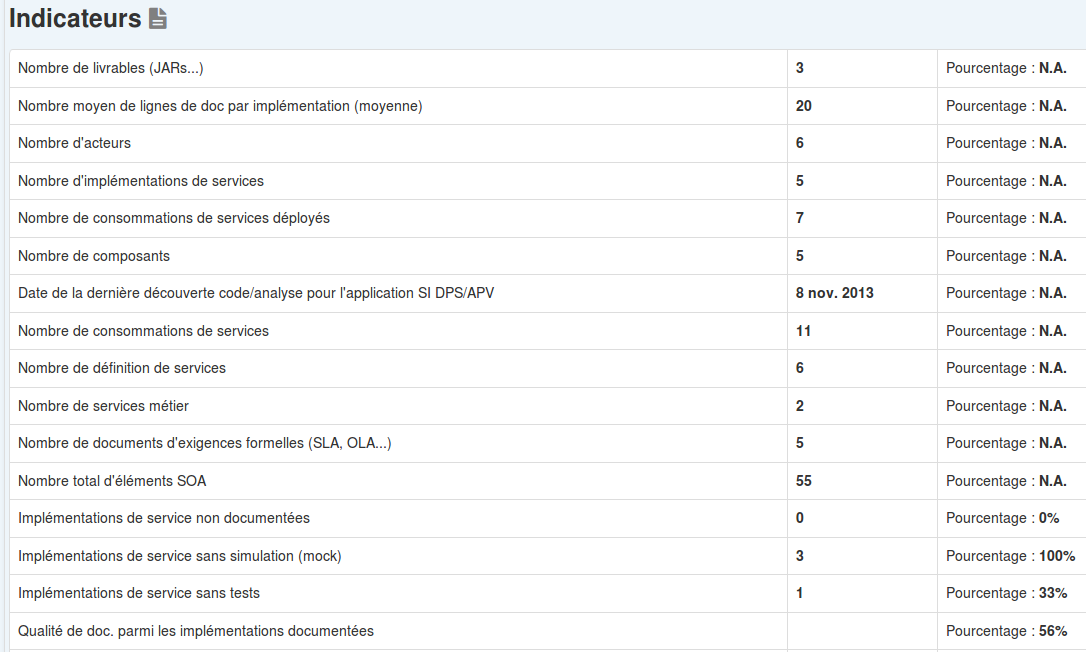
Each Category page displays all indicators for this Category. There they can be exported to CSV or Excel-like tables.
Example for the Cartography category :
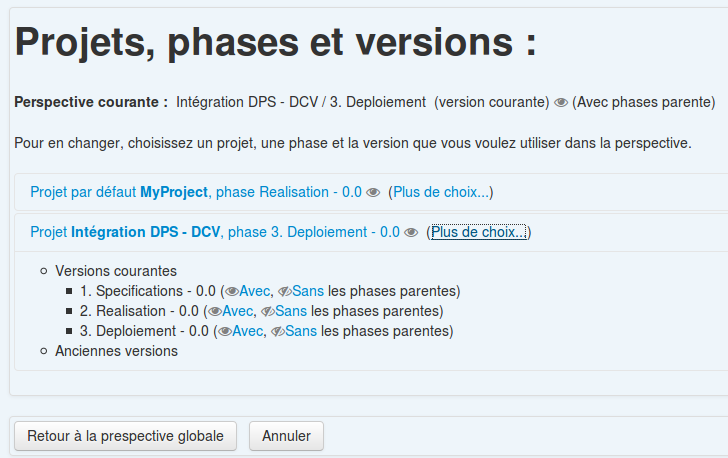
Context change screen allow to focus on a given version (and phase) of the SOA project :
Finally, in the Governance Category, the SOA Project Phase Completion Overview provides a graph that allows to visually track completion of SOA Project Phases. Each of its graph bars is driven by a high-level SOA Project Phase completion indicator that is computed out of other indicators.
Overview Graph Example :
