Final monitoring design
by order of priority :
- EasySOA Light use cases : discovery, record & more, service call event subscribers
- EasiFab SOA monitoring feedback loop on Bull's Jasmine
- Wider deployment integration & targets (CXF, Talend...)
EasySOA Monitoring will happen in an extensible Proxy architecture. Here's how it processes service calls :
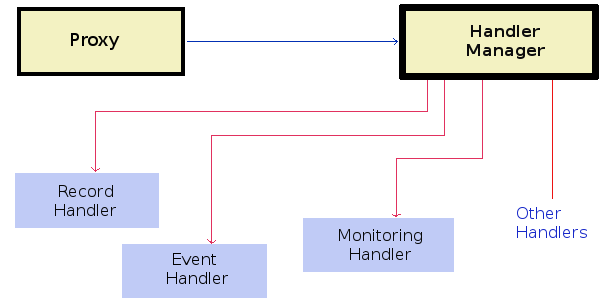
Proxy :
- The Proxy is tied to the service engine. It forwards calls and gives them to the Handler Manager.
- The Handler Manager will in turn call all Handler components.
- Handlers do their specific job using service exchange information provided by the proxy (if necessary extracted from protocol & cached). For now Handlers work using Message API. TODO later they could also use Code invocation API (FraSCAti Intents).
Handlers :
- It will be possible for the user to add his own handlers by adding it from java code or adding the component in the appropriate composite file.
- Predefined handlers are RecordHandler, DiscoveryHandler, EventHandler and MonitoringHandler.
- a Handler implementation can have an inner interface (SPI) allowing TODO alternative impls & deeper integration in advanced service engines.
The default (EasySOA Light) proxy is an intermediate HTTP proxy or tunnel (required for HTTPS) on FraSCAti's Jetty HTTP server. This makes it easy for testing but less interesting in production use, where handlers should be integrated and deployed within a proxy specific to its actual service engine on client & server side.
Therefore next we'll also try to put it in TODO in FraSCAti's CXF. Not only is it useful in SmartTravel use case and also in FraSCAti Studio and Talend ESB, but it is interesting in CXF on its own and will help us refine the monitoring architecture when being inside the runtime of the actual SOA.
This proxy mindset gives us an overview over the whole business of HTTP handling by engines. Overall, all proxies can be seen as an aggregation of atomic proxies / filter. In inbound HTTP-to-Java proxies, first come HTTP-level filters (ex. on Message API), then Java-level filters (ex. Code Invocation such as FraSCAti Intents). In advanced HTTP service engines such as CXF, the HTTP filter implementation can be an evented one (CXF Interceptors, similar to JAXWS handlers) which allows more detailed handling of service standards and implementations to which all handlers collaborate.
- TODO methods. filter (no postForwardRequest or preForwardResponse) or evented ? Ex. in : preForwardRequest(in), postForwardRequest(in), out : preResponse((in,)out) and postResponse((in,) out). In a proxy mindset, postForwardRequest and preResponse provide the same kind of information as preForward and postResponse and so are not really useful. Therefore a filter, in the spirit of Servlet / WSGI / Intents, would be enough ; and the evented alternative would be specific to service engines natively supporting it.
- TODO shared context information (such as WSGi dictionary / CXF context) : allows to move information across the different proxy layers, ex. "deep" extract Principal or transaction id and use them "late" (HTTP output). In our default HTTP proxy, the Message API and its parsed innards (XML or JSON).
- TODO order interceptors ex. security, transactions : some can be done at HTTP (SSL security) or Code (transactions) level, otherwise and mainly done specifically in service runtimes that support ordering ex. CXF.
- TODO error handling depends on HTTP or SOAP error, but can impact method call... The main need is to let "deep" handlers update their reaction on the exchange on a late (HTTP output) error. No problem to detect errors them even at the end (HTTP output), since even SOAP Faults have HTTP 500 status, but handlers would need a handleFault() method TODO.
- About CXF & JAXWS handlers, FraSCAti intents : EasySOA Proxy Handlers differ from them in that they are more focused on proxying. But they could / should use them (as well as other engine-specific features), ex. for ordering proxy handlers vs security interceptors.
The work of this handler is exclusively to record the HTTP calls for replaying by HTTP miner. Its inner interface (SPI) is recordExchange(Message in, Message out).
For now it is deployed on the intermediate HTTP proxy and works on inbound HTTP calls (Message API). It could be embedded on HTTP server or client side ; then it should be called after (resp. server or client) HTTP response production.
TODO see how we go from there to templatized replay, assertions and simulation.
TODO rename accordingly in code
This one does service discovery by monitoring : it counts service call events and registers services in EasySOA Core along with their callers (service reference) TODO asynchronously. We may add other information if it appears necessary. Its inner interface (SPI) is registerService(EasySOA service information).
For now it is deployed on the intermediate HTTP proxy and works on inbound HTTP calls (Message API). However it could be embedded on HTTP server or client (consumer / service reference proxy) side. Can be called anytime, but more interesting after client response so there's more information (as for monitoring).
The default implementation does it dumbly all in memory. An alternate one using Esper's capabilities will be provided in another, GPL'd project.
This one will allow to call other services that have registered ServiceExchangeEventListeners.
This handler's role is to provide web services calls' information (including for later computing SOALatency, responseTime...) for EasiFab's SOA monitoring feedback loop. It builds the basic MonitoringEvent interface (see below) and then delegates its handling to another MonitoringEventHandler. Its inner interface (SPI) is monitorExchange(BasicMonitoringEvent).
The default MonitoringEventHandler TODO embeds a Jasmine Collector that puts monitoring events in the Jasmine event database. Alternate implementations could for instance store them in memory or / and an intermediate database.
If embedded in server, to have all info, it should be done "deep" enough (ex. within authentication interceptor to have Principal) but also "late" enough to be sure client response went OK (can be done by updating already created MonitoringEvent in the case of error).
- monitored exchange (ex. HTTP : headers, content, or further extracted ex. from content XML / JSON)
- proxy execution (ex. Java context information (security : Principal, transaction), OS process id, host name & ip)
- proxy configuration (ex. filters on monitored exchanges, setup info ex. environment) : probe identity (what it probes)
- Jasmine probe configuration or execution (could also be in the previous entry, since here the probe is the proxy)
For their own treatments they need some information which are divided in two categories.
- Some are available directly in monitored exchanges,
- and others have to be computed afterwards by aggregating several exchange monitoring events, which have to be still available either :
- in an external dedicated database like Jasmine's
- in an embedded database like Talend. Limitations: can't aggregate events across several MonitoringHandlers / proxies
- in MonitoringHandler memory. Limitations: as above, and can only do simple aggregations.
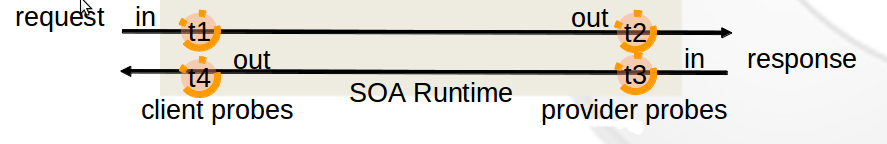
- SOALatency : It's an integer, which is computed by MonitoringHandler. It's the result of this calcul: t2-t1+t4-t3. Has to be computed in an external database, since those values come from several MonitoringHandlers. However (t4-t1) and (t3-t2) could be computed in memory by each MonitoringHandler, if request and response are correlated. Only makes sense if both proxies / probes are as close as possible to client & server.
- ResponseTime : It's an integer, which is computed by MonitoringHandler. It's the difference between t4 and t1. ** Only accurate** if proxy / probe is as close as possible to what it measures for (server or client).
TODO from EasiFab requirements (xls & ppt) and Talend model (http://jira.talendforge.org/browse/TESB-1682)
- MI_OPERATION_NAME (Talend) type: varchar Description: Service operation name of event creator
- SourceTimeStamp (Jasmine) type: Date(YY/MM/DD hhmmss) Description: These are the data in the input file of JASMINe's Collector.
- source timestamp is equals to event collection / monitoring timestamp if individual events are put synchronously in Jasmine database. => are they ? or rather several at a time (event list, more efficient) ?
- The monitoring TimeStamp is relative to the computer it comes from. However both time deltas t4-t1 and t3-t2 are absolute, therefore ResponseTime and SOALatency also are. LATER absolute timestamps could be useful to map service call ordering within processes, and for this they could be made absolute using a single global timestamp server.
- Another problem is about the t2 and t3 values, because t1 and t4 are calculed in one java virtual machine but t2 and t3 in another one. So one of the two part(client or provider) would give their datetime's information to the other one for the SOALatency calcul. => should we emit 4 events (simpler) and let them be aggregated in Jasmine, or should we already aggregate deltas from request and response on both sides (easy IF we let the service engine correlate them) ?
- finally, who computes their mean value (only Jasmine can ?!), so we can collect "one QoSEvent every second" ?
- other, higher-level monitoring events are computed in Jasmine by rules : ServiceEvent, ServiceState
- unique identification of service endpoint in chosen deployment configuration : endpoint url is not enough, IP is required (and not loopback's 127.0.0.1) ; hostname is nice to have ; deployment configuration can be identified by System and Environment (see model)
- request to response correlation : done by the Proxy service engine. Asynchronous message responses should be correlated through requests by using the engine's appropriate programming model, ex. using Java Futures in JAXWS / CXF.
- message correlation across client and server : done at protocol level. HTTP (priority) : a dedicated header put by the consumer probe at emission, read by the provider probe at reception etc. SOAP (later) : could be the standard WSA-Adressing's MessageId
- correlation between several messages of a same process : custom correlated id has to be put in protocol by service engine (just like message id), and forwarded (or not) according to process perimeter (delimited by process engine, ex. Talend flow => FLOW_ID, Bonita workflow...)
Service id in EasySOA : depends on the new model, probably System(Path)(+Env(Name))+ServiceNameOrURL
Participant : NOT KNOWN IN THE EXCHANGE EVENT though could be inferred from matching its info (authenticated Java thread Principal, proxy conf) with EasySOA's, ex. through an (LdapPrincipal)ExchangeParticipantInferrer / in a Jasmine rule.
QoSEvent Interface : key-value map or dedicated class (or both) ?
Message API or Code invocation API, or both (for convenience but also "as close as possible") ?
Monitoring architecture has to be flexible, so that it can be fed by QoSEvents from any service runtime. This is possible by developing a service runtime-specific Jasmine Collector (TODO Probe also ??) collecting QoSEvents from wherever the runtime stores them (TODO or even synchronously putting them in Jasmine's database). Then they are able to use Jasmine rules & EasySOA information to trigger higher-level SOA events.
see example http://jira.talendforge.org/browse/TESB-1682