View Audit Messages in Kibana
Content
Audit messages emitted by archive or Keycloak to logstash are stored in elasticsearch. To access and view these messages, use Kibana user interface.

- Start elasticsearch, logstash and kibana docker containers using Run secured archive services and Elastic Stack on a single host wiki.
- Configure
-
Access Kibana at :
http://<docker-host>:5601 -
This redirects to the following screen
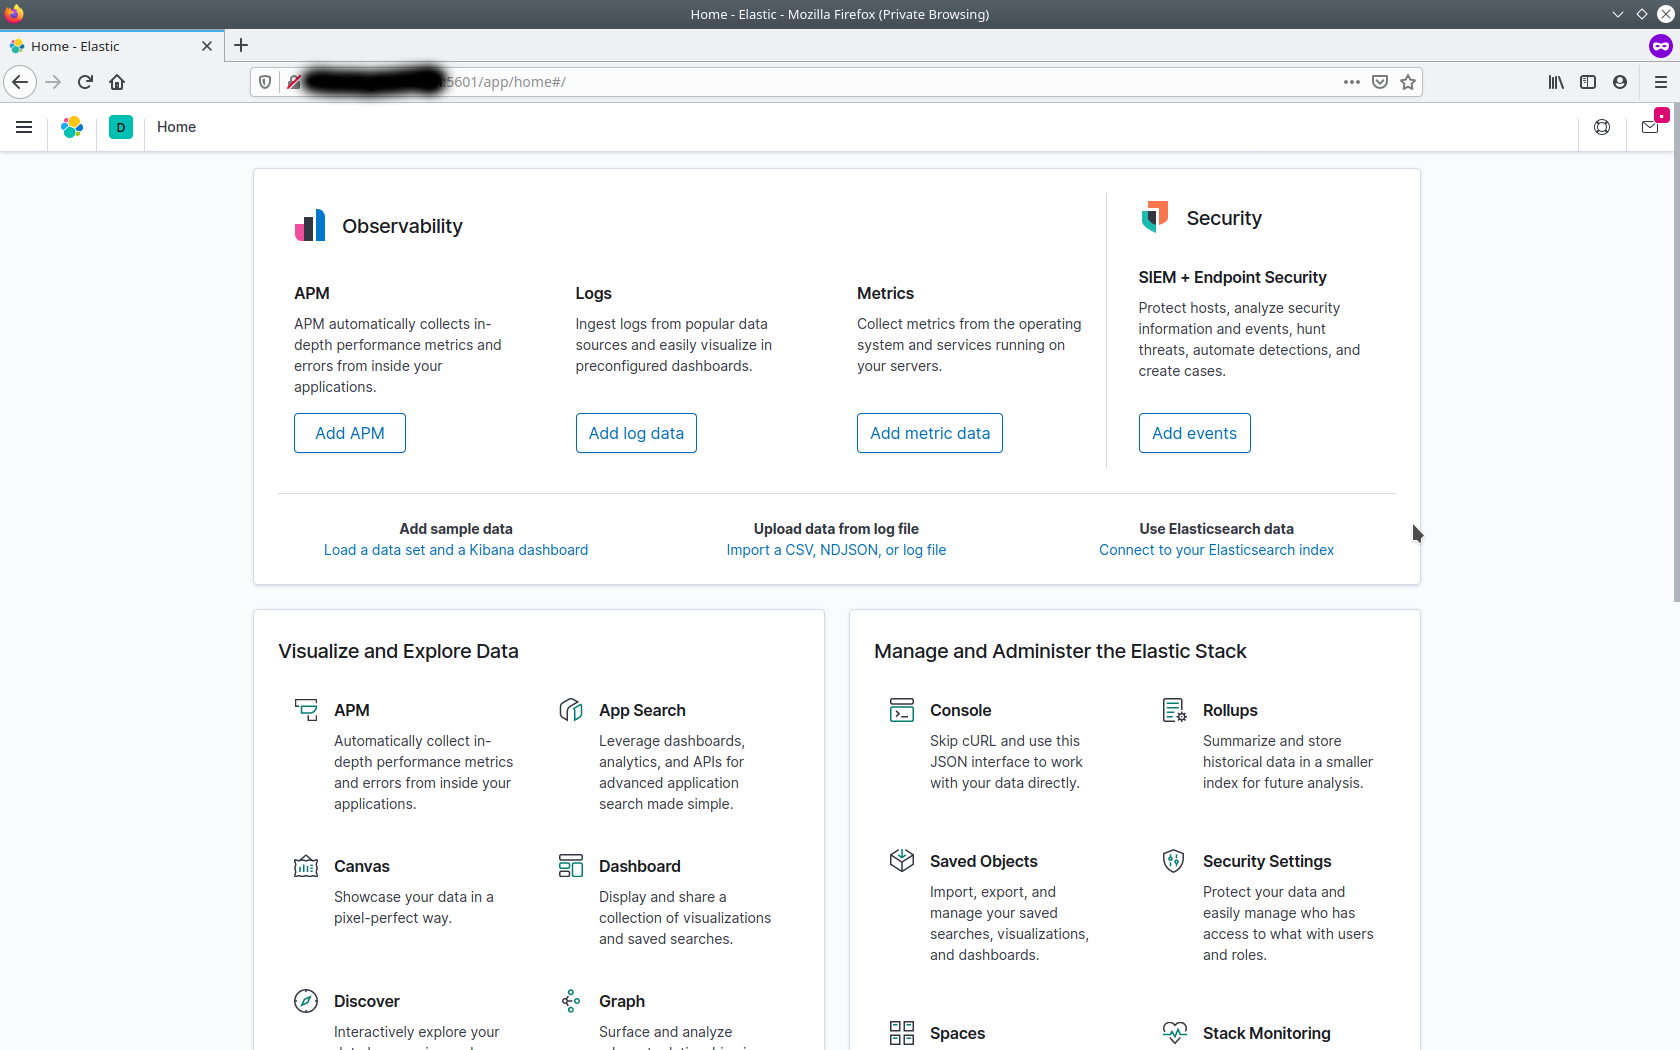
-
From the left-hand menu, select Discover
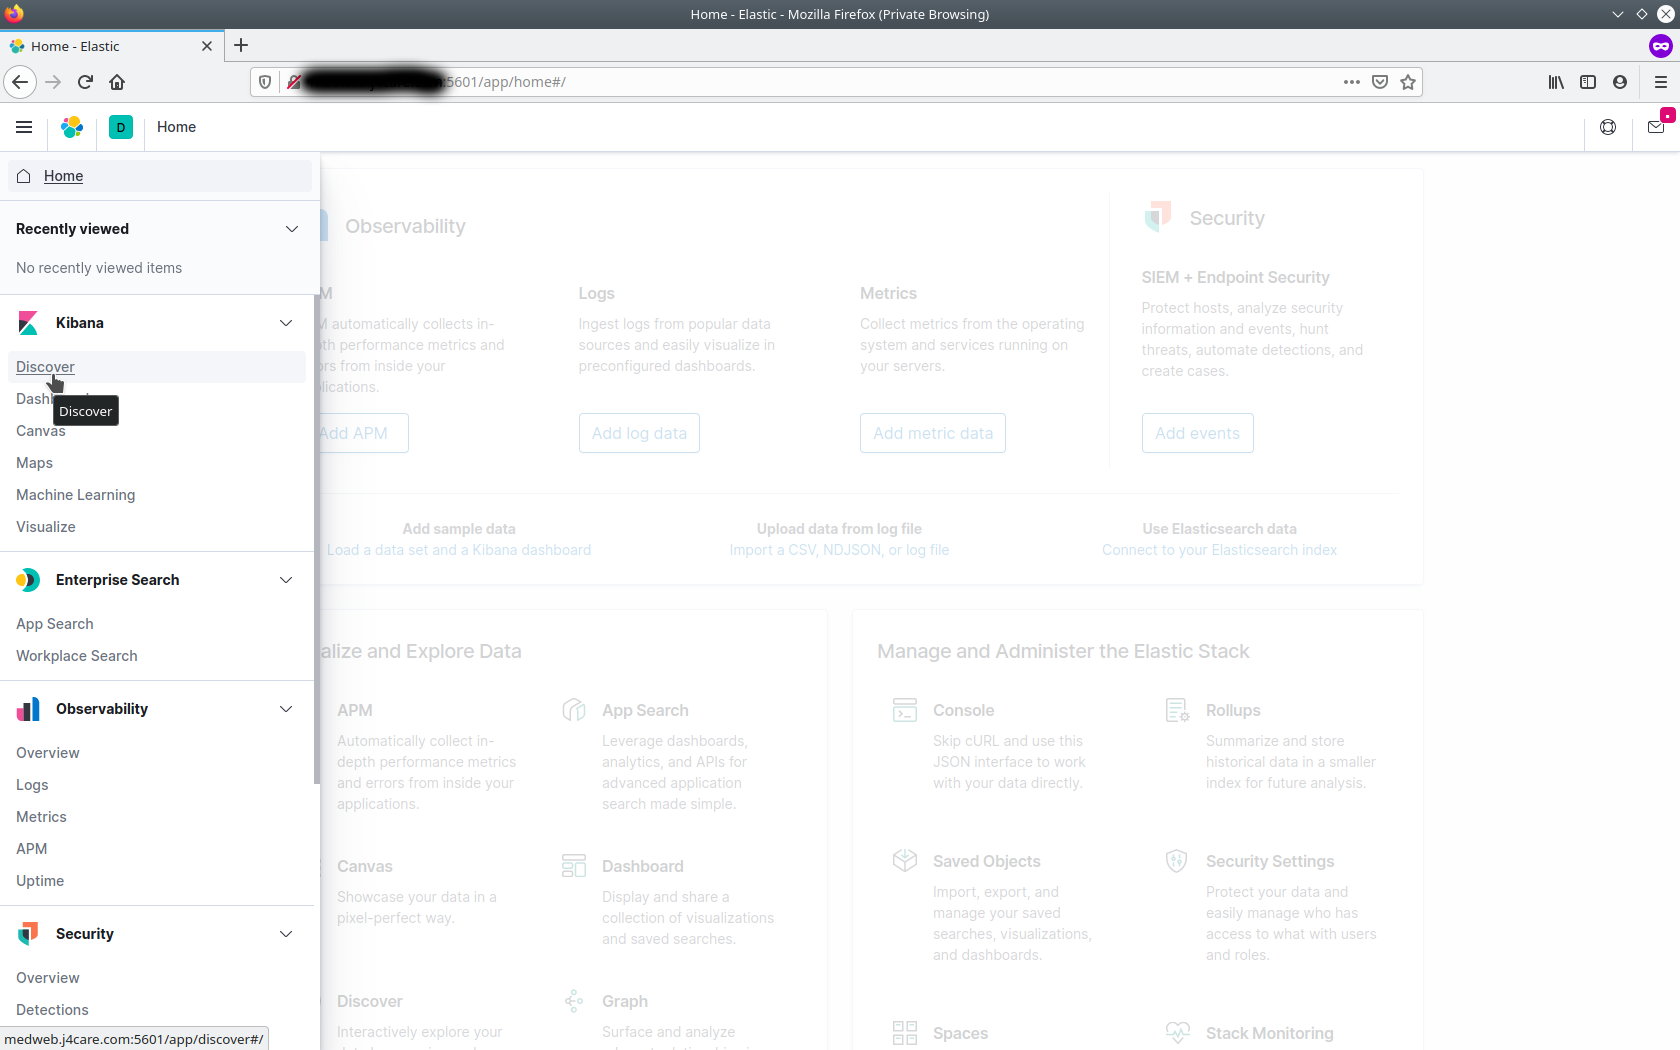
-
By default, all audit messages received by the audit record repository are shown in a raw format as follows :
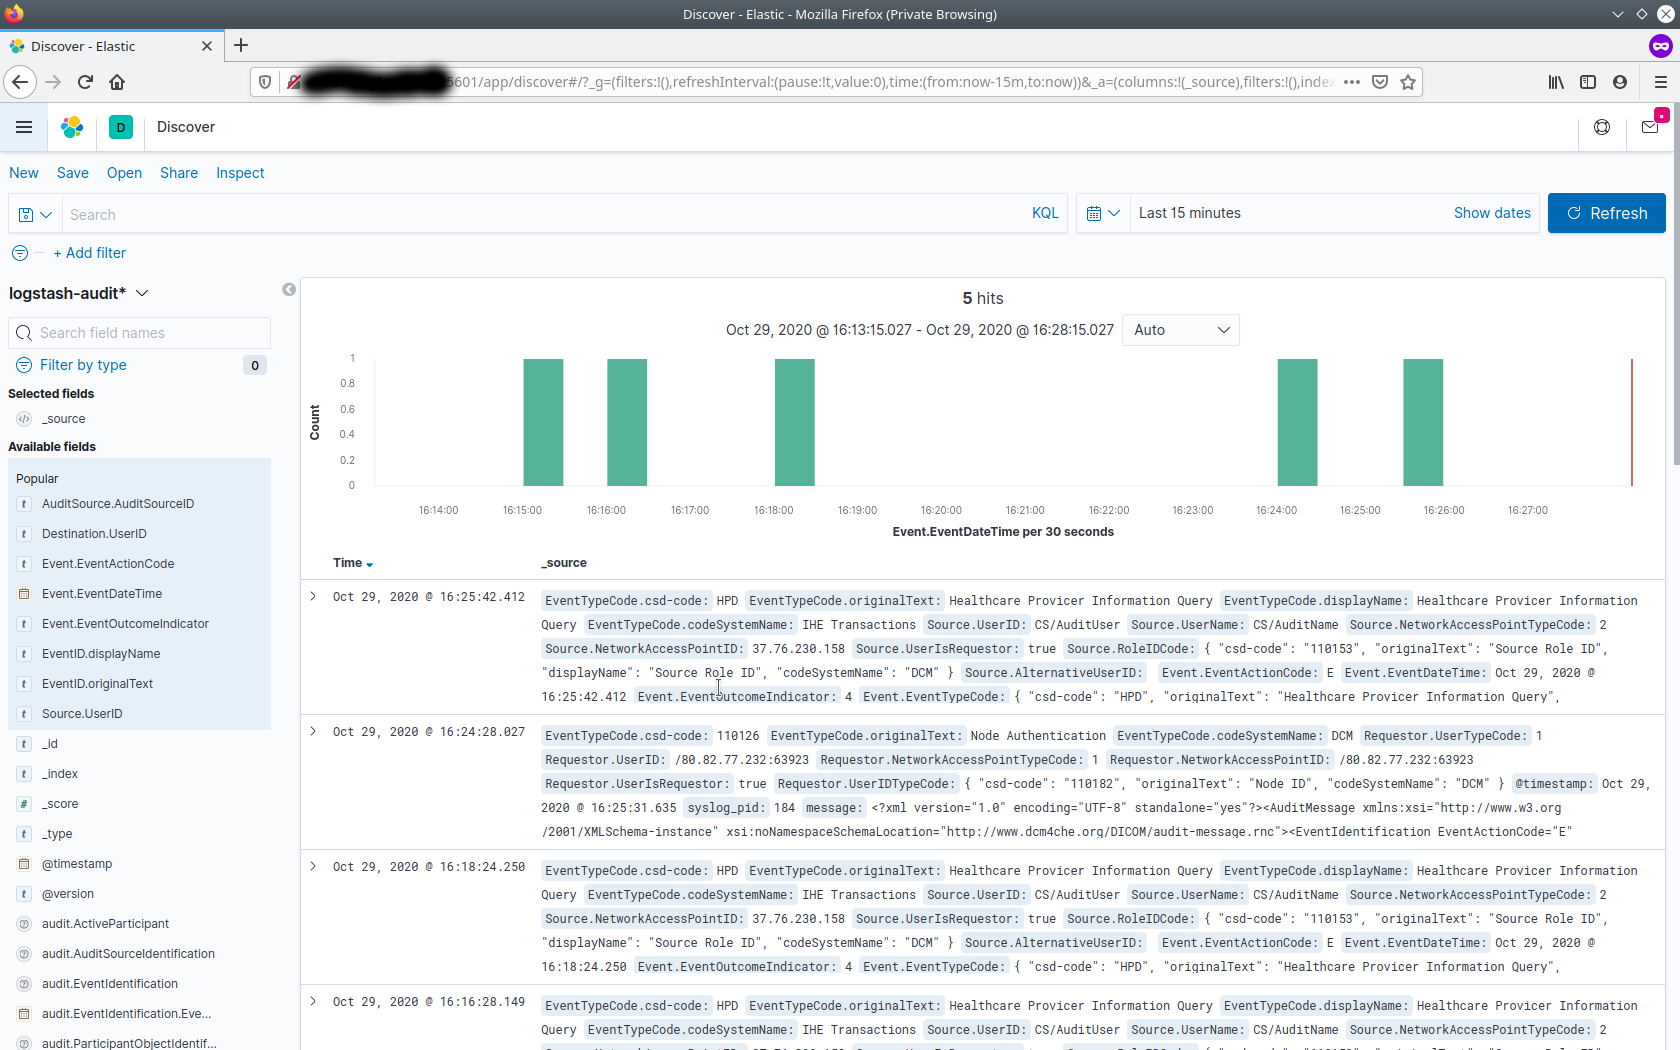
-
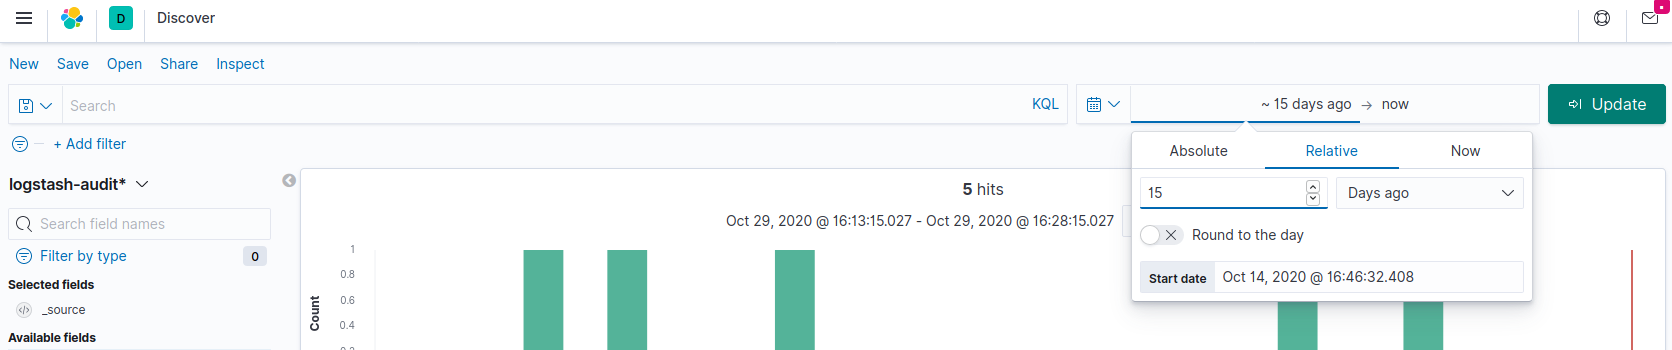
One may change the default time / day range of audit messages shown in Kibana and Update
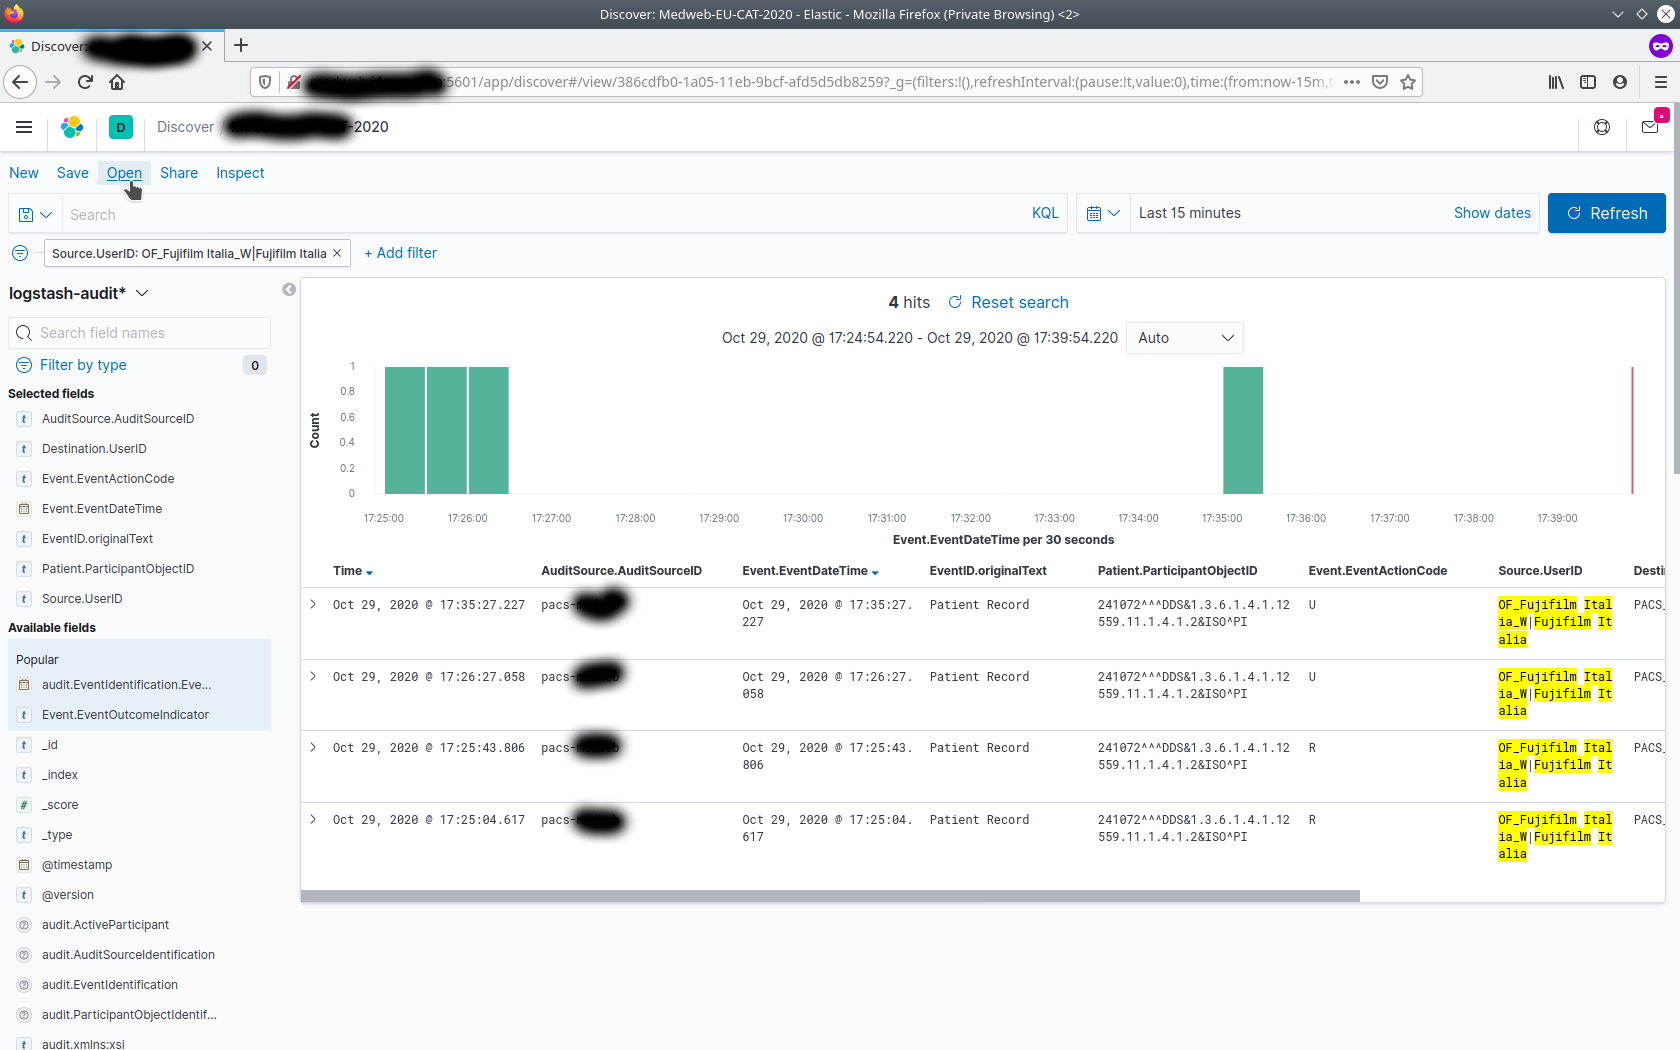
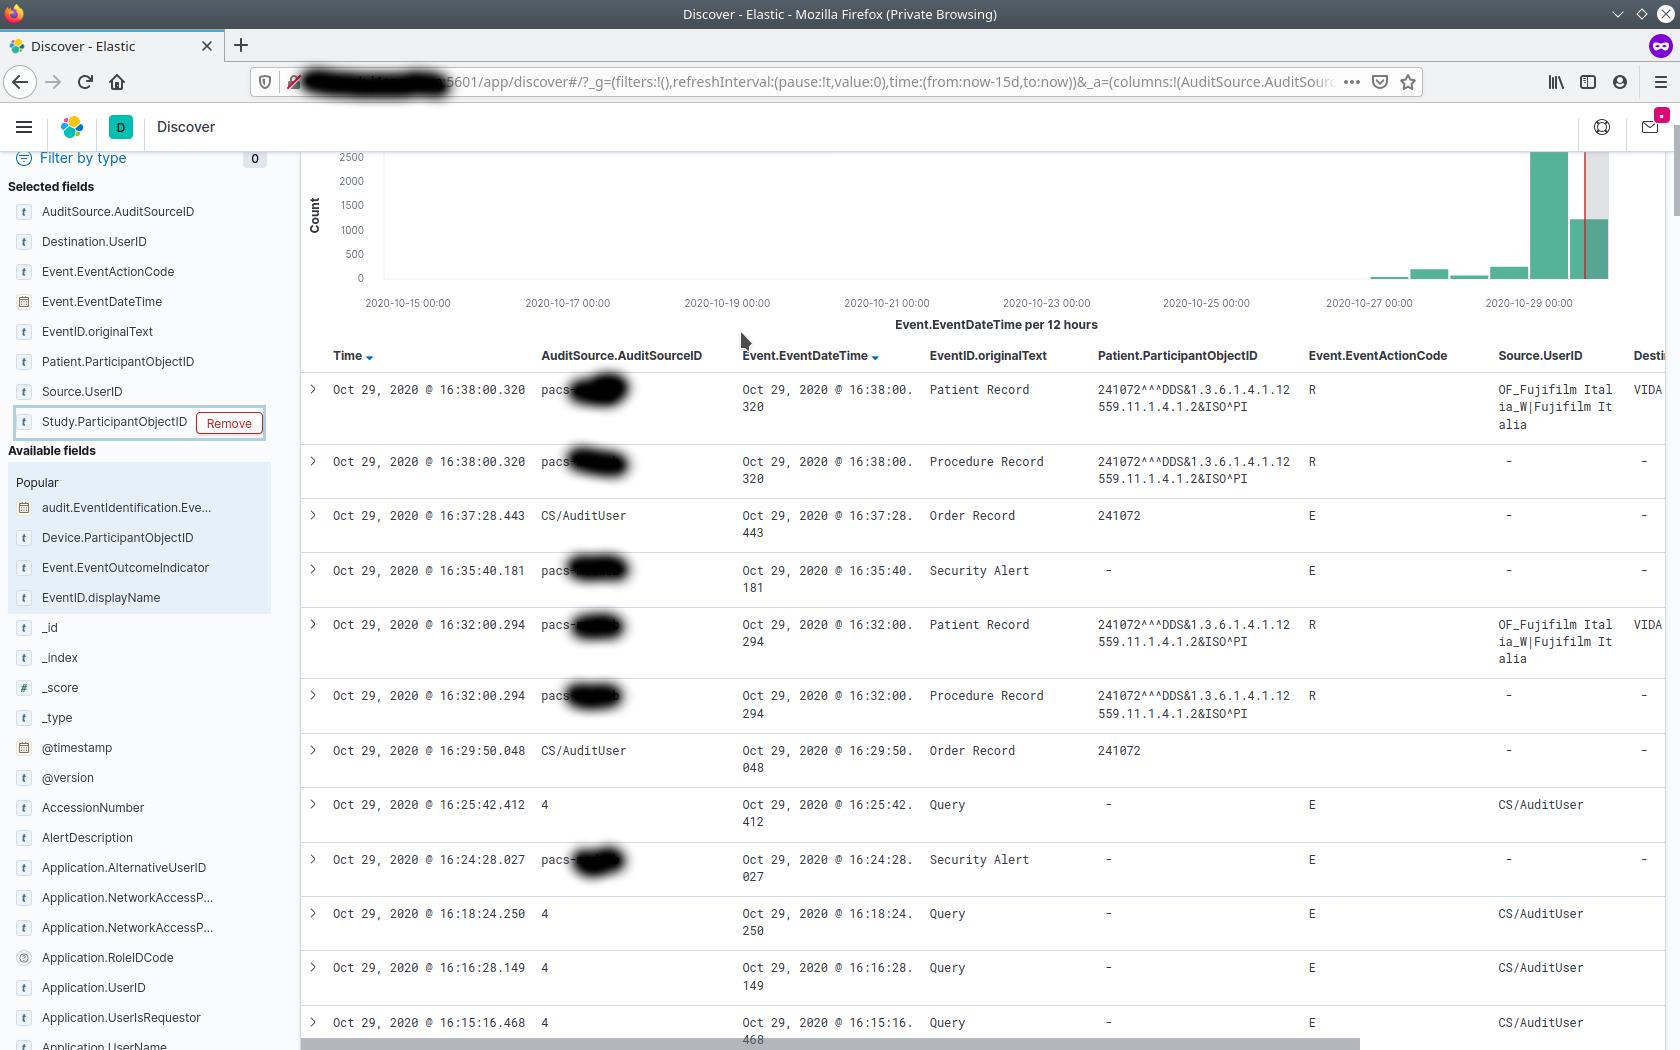
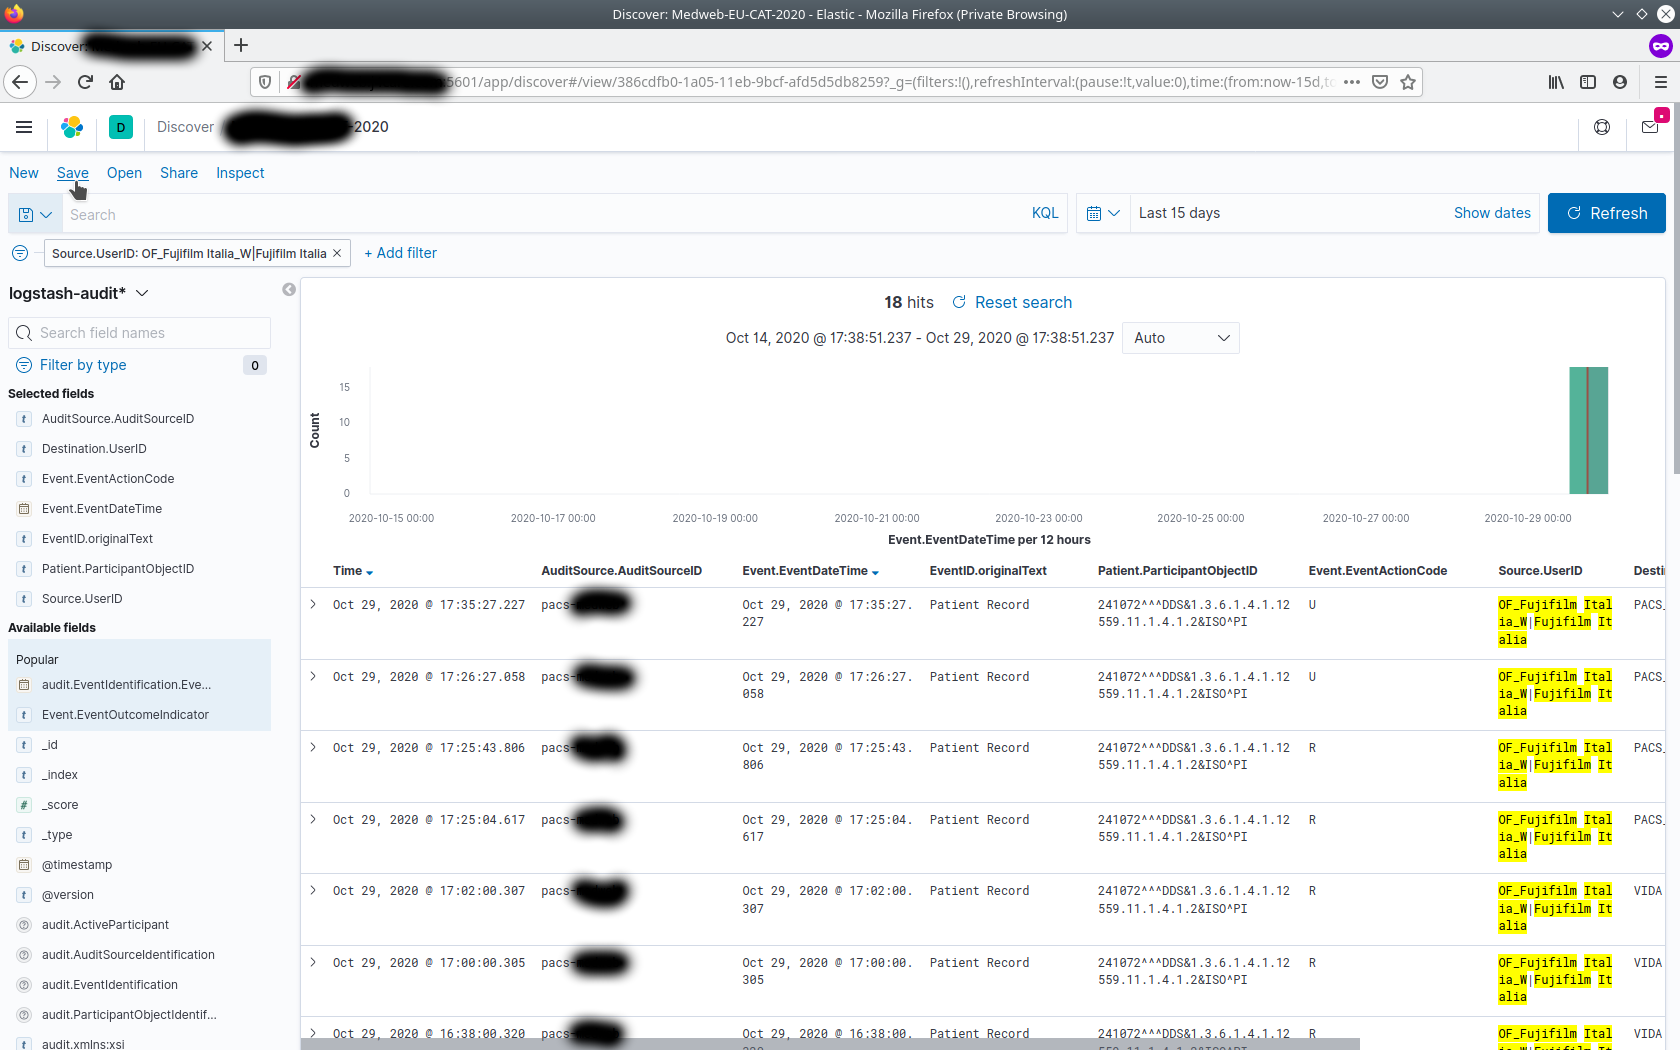
Add filters as required for faster tracking / viewing of audit messages sent by various systems to the archive. These can be selected from the Available Fields. Examples of filters :
- AuditSource.AuditSourceID
- Destination.UserID
- Event.EventActionCode
- Event.EventDateTime
- EventID.originalText
- Patient.ParticipantObjectID
- Source.UserID
- Study.ParticipantObjectID
to be part of Selected Fields. This results in a tabular like screen showing audit messages one may be interested in as follows :
-
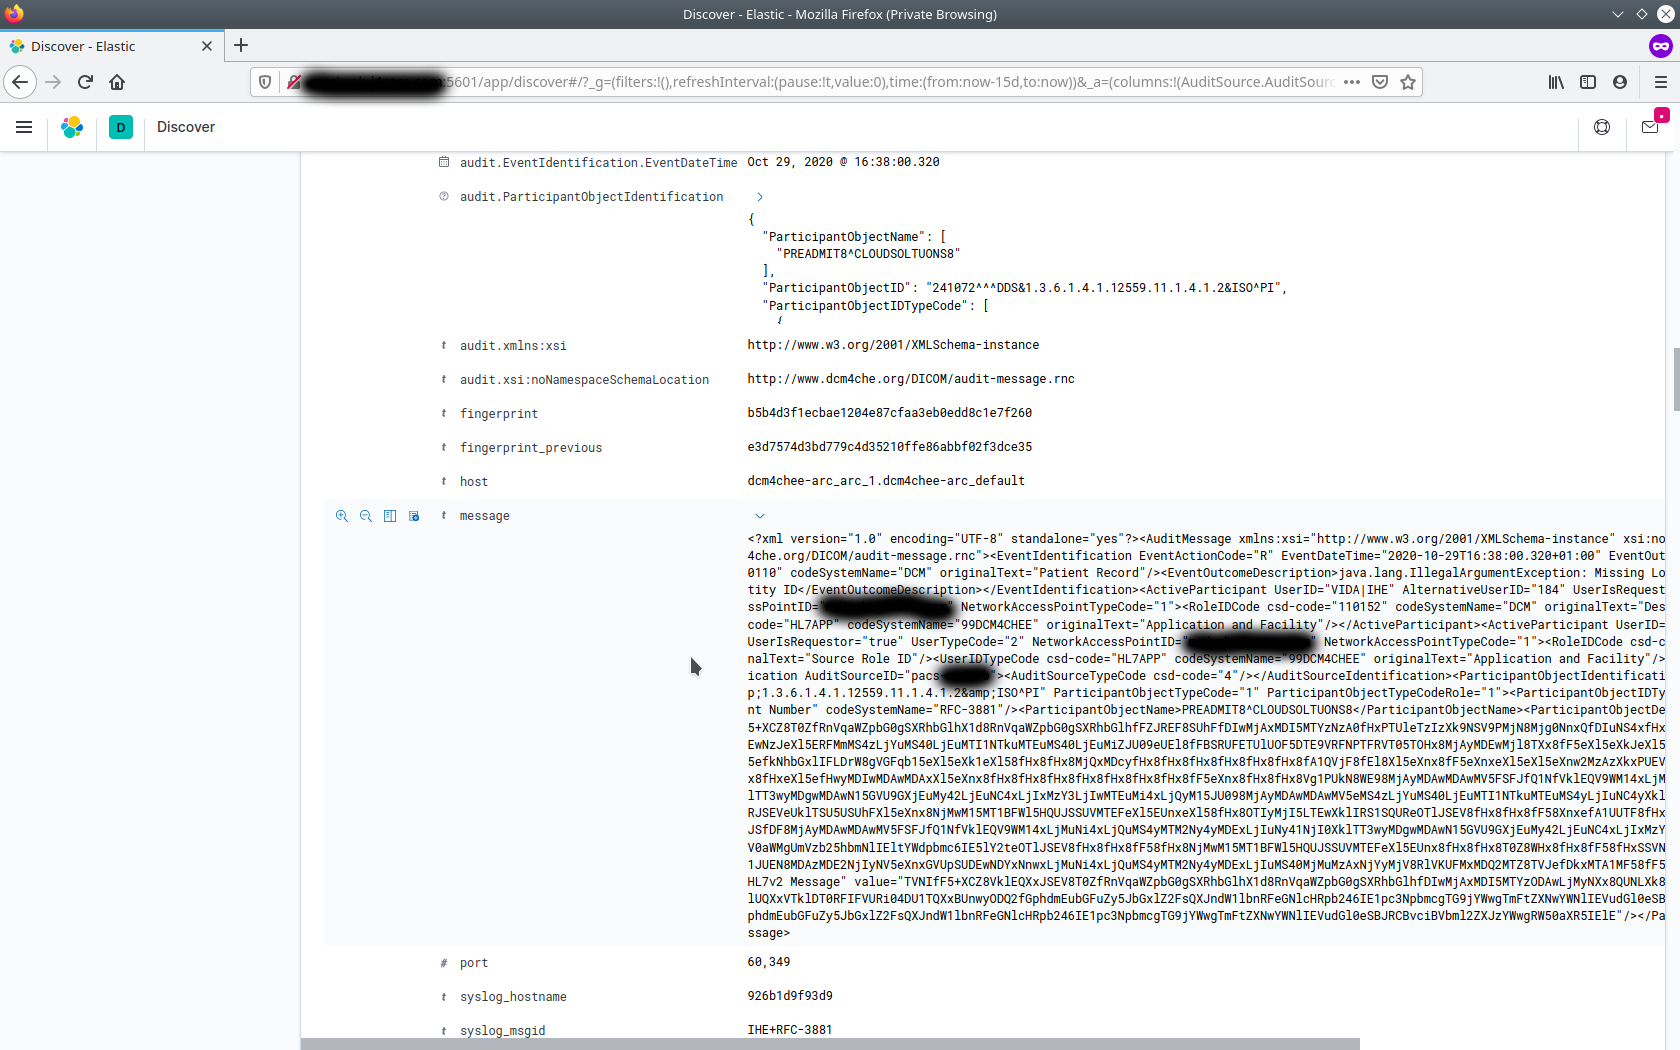
Expand on one of them to see the contents of the whole audit message
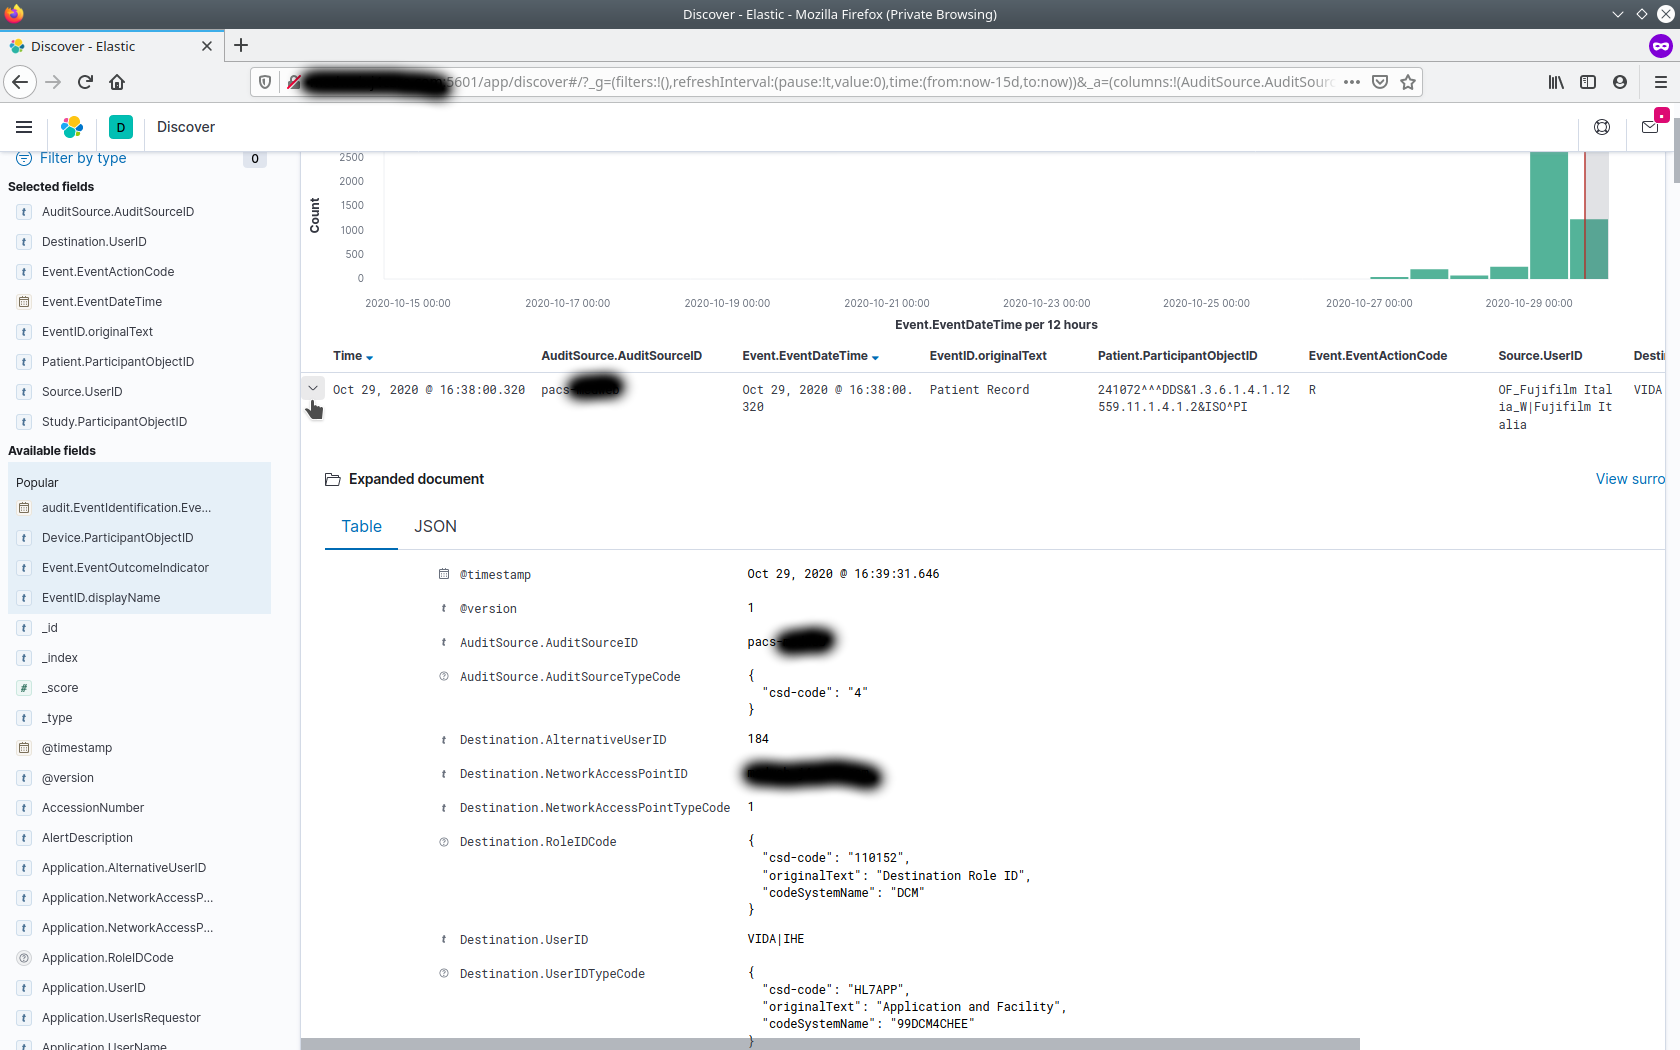
-
On going further in the expanded details section, one may also see the XML format of the audit message sent by the peer system. This can be useful in debugging purposes where you may want to look at the whole audit message to see if it is conformant as per DICOM's Security Trail Profiles.
-
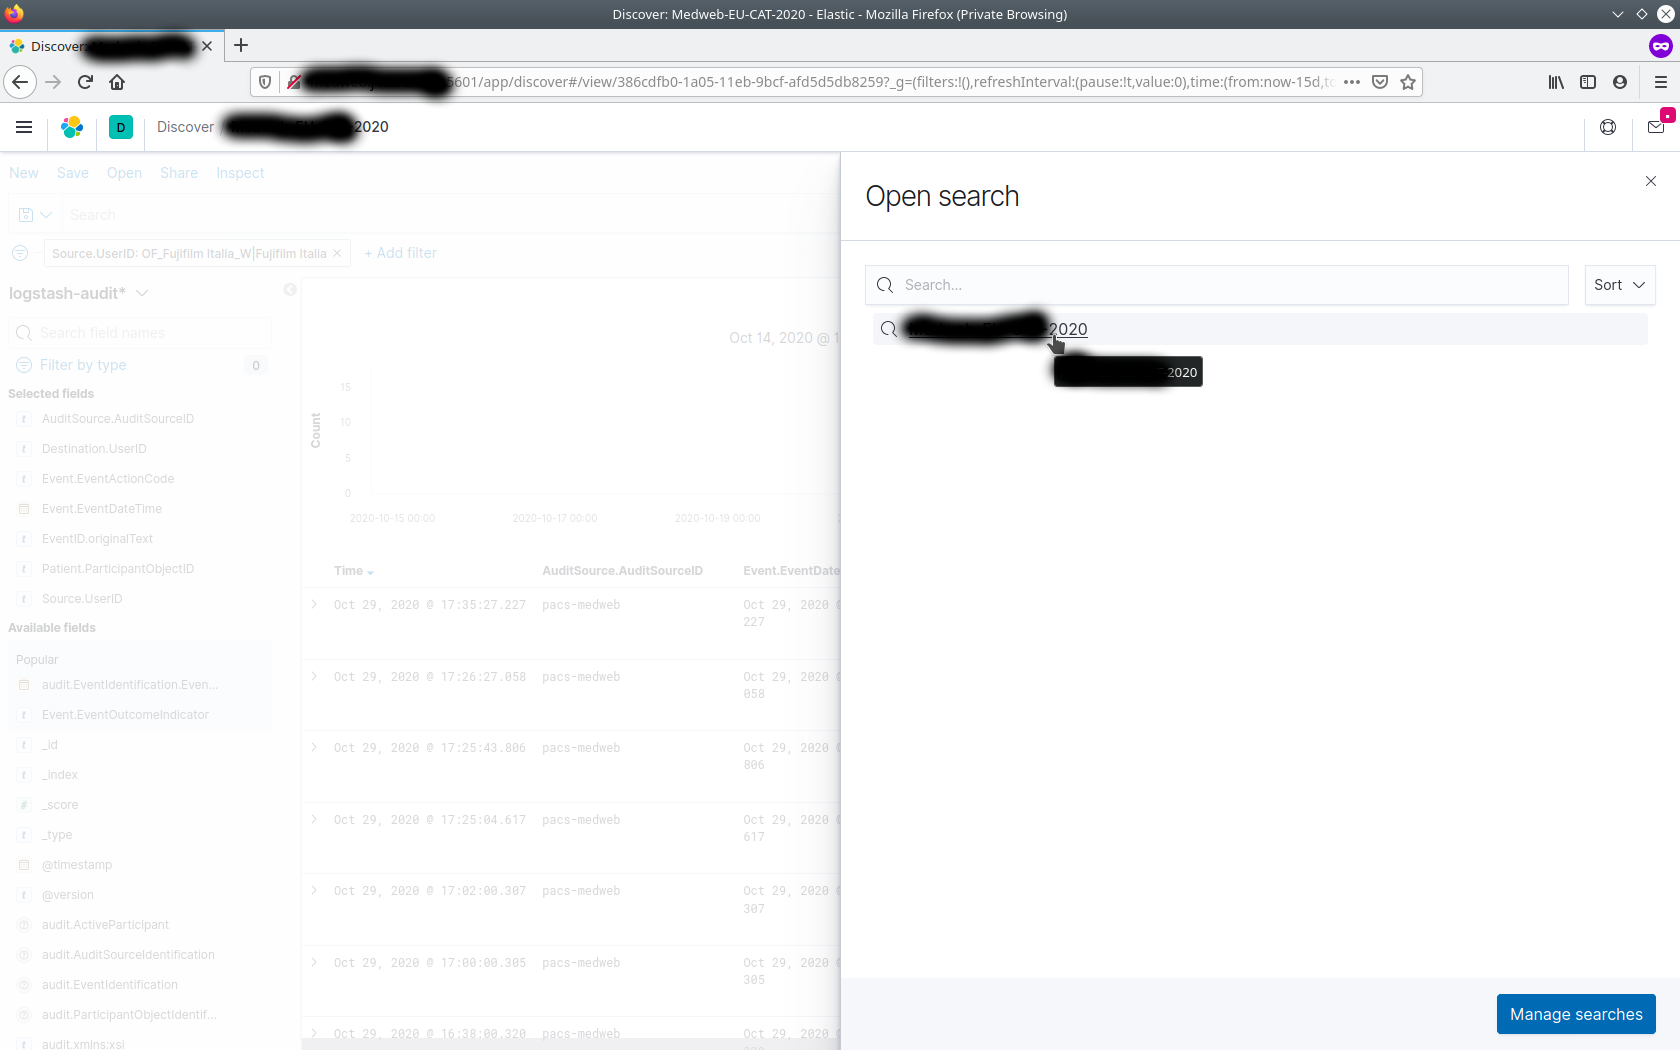
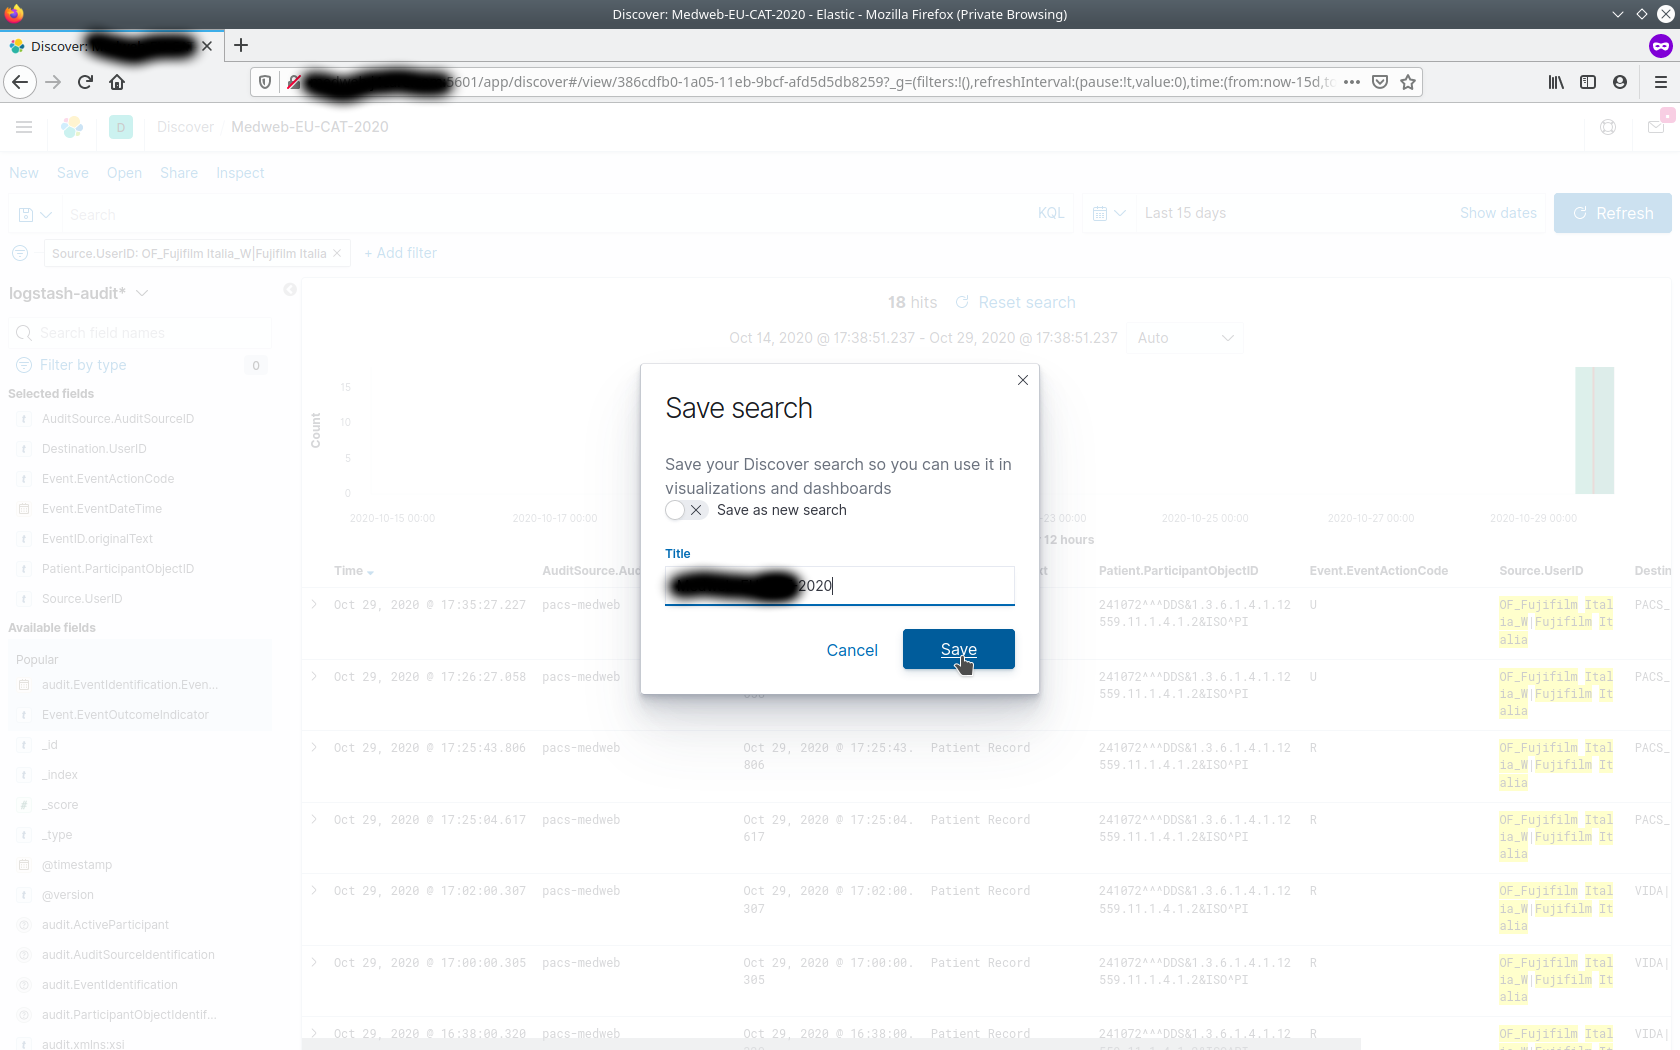
One may save these settings, in order that it can be accessed later.
-
This saved filter template should now be available from Open link.