VisionEval Primer
VisionEval differs from traditional travel demand models both in how it works and what kind of planning concerns it helps to address. This Concepts Primer provides a quick introduction approach to the unique features and applications of VisionEval. It reviews the main model components and key concepts at a high level, to assist new users in understanding concepts they will apply as they set up scenarios, develop inputs and evaluate outputs. Links to more detailed documentation will allow the reader to delve further into each topic, as they choose.
Throughout this primer, segments of a training recorded in September 2019 are included. This first video presents the key concepts in VisionEval as well as the geography:
Structurally, VisionEval may be described as a "disaggregate demand/aggregate supply" model. That is, it combines rich demographic and socioeconomic detail from a synthetic population with aggregate treatments of travel (multi-modal VMT and congestion without explicit trips, or transport networks). The implication of the "aggregate supply" model is that VisionEval cannot be used to evaluate performance of specific projects or corridors.
What VisionEval can do, and even makes especially simple, is to evaluate large numbers of scenarios and explore how combinations of alternative future conditions might affect performance measures. Travel demand models, whether built using traditional trip-based or more contemporary activity-based techniques, sacrifice network detail for flexibility. It is difficult in such models to capture novel behaviors such as an increased propensity to use inexpensive ride-hailing services, or to express shifts in vehicle ownership and occupancy that may be influenced by multiple factors some of which have not yet been observed. Yet these potential shifts are often very important for assessing the potential of pricing, investment strategies or other policy priorities. VisionEval also makes it relatively simple to explore risks and opportunities that may eventually be realized as new transportation options mature.
VisionEval won't help us determine if a particular highway segment should be built or upgraded, or what kind of transit service improvements should be extended into new areas. But it can help us look at the market for new technologies, and explore future scenarios that are based both on changed circumstances (altered demographics, increased congestion, or alternate road pricing strategies) as well as on changed behaviors (including behaviors that might happen, but that we have not yet observed because the key enabling technologies are too early in their deployment). VisionEval results can be explored in detail by market segment, asking questions about how benefits might be distributed regionally, and what overall system performance might look like.
Ultimately, VisionEval is a system for asking a very broad range of "what if" questions about how the transportation system might perform, and how its benefits and costs might be distributed over the community. It can efficiently process hundreds of scenarios looking at many different types of interventions, alternative policies, and hypothetical future conditions and travel behaviors. The results can inform strategic questions, helping decision makers answer questions such as "What are our options for achieving this performance result?" or "What are our risks if new transportation technologies develop in these different ways?"
Using VisionEval to answer such questions does not make other types of modeling obsolete (such as travel demand models or corridor microsimulations). Instead, it helps to determine what is worth the effort to code into these more detailed models, and also to explore and document novel assumptions about the future that may require extra effort to implement, and that would be prohibitively expensive to explore through traditional planning models.
Video overview of VisionEval strengths and limitations:
The following Topics of Interest provide more information about why and how you might want to use VisionEval, including what actions it can quantify and metrics it can report on for a region or a state. The Scenarios topic highlights how the quick runtime of VisionEval models enables evaluation of a large number of scenarios.
| Topics of Interest | |
|---|---|
| Strategic Modeling | Best Practices* |
| Local policy actions | Best Practices* |
| Performance Metrics | Best Practices* |
| Scenarios | Best Practices* |
* We hope to provide Best Practices for these topics soon.
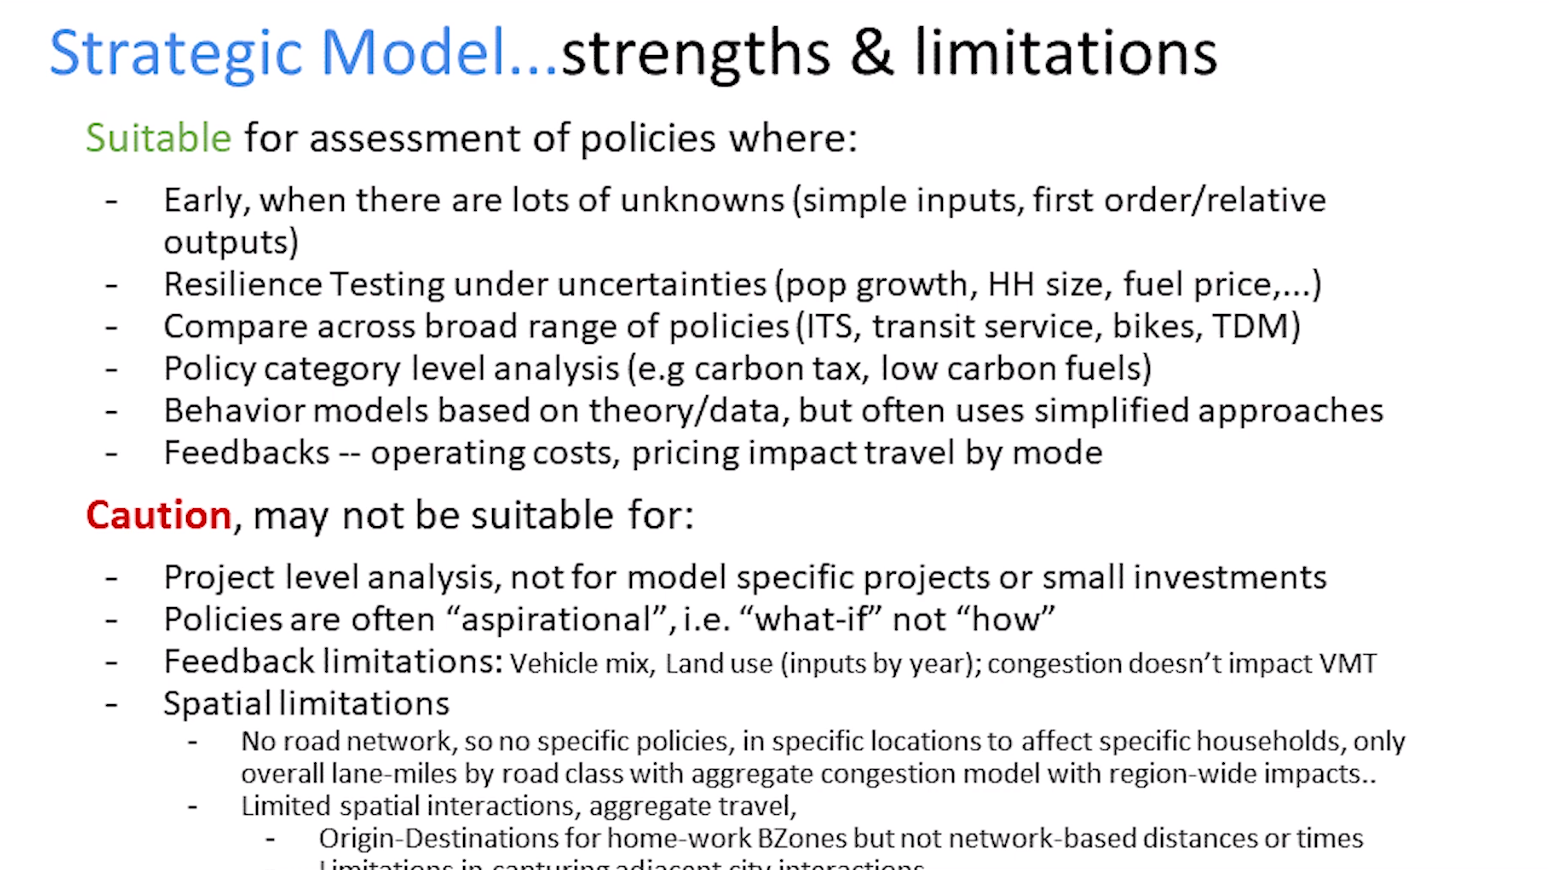
VisionEval is a strategic modeling system. It differs from traditional travel demand and microsimulation models principally in that it is applied earlier in the planning process, and it is used for different purposes. Rather than examining the detailed performance of specific facilities (assessing individual projects), VisionEval estimates regional and small area performance metrics that reflect overarching policy goals such as emission reduction, regional VMT, or mode share.
Traditional travel models used for planning purposes are applied to estimate outcomes under a small number of alternate input scenarios that vary either land use (socioeconomic data) or characteristics of the transportation network (alignment, land configuration, tolls, etc.). In these models, the response to the changed inputs is estimated based on parameters typically derived from household surveys and other related data sources: that is, the behavior in the model is presumed to be what we see today. Even though such models are often behaviorally complex (e.g. activity-based models), the effort required to assess many alternative scenarios is often prohibitive, and because such models are built using complex estimation procedures rooted in detailed data about existing behavior, it can be technically difficult or impossible to reliably encode possible future shifts in behavior, or to explore alternative possible future behaviors.
VisionEval is typically set up to run many scenarios that explore a broad set of alternative policies and investment priorities that may result from a variety of possible categories of policy and project interventions, or from a range of possible future conditions (strong or weak economic growth, demographics that shift at different rates), or from uncertain deployment of new technologies such as app-based ridesharing (Transportation Network Companies or TNCs).
A full application of VisionEval may examine hundreds or even thousands of permutations of inputs representing many possible future outcomes. The outputs allow planners and decision-makers to explore the outcomes of each scenario compared to the others. so they can visualize and discuss the relative impact and cross-influences, as well as the unintended consequences, of factors represented across the scenarios. VisionEval allows planners to assess alternative assumptions about uncertain phenomena such as AV deployment, it is a very effective tool for identifying risks and opportunities, as well as for formulating effective strategic responses to new challenges for which little current data exists or for which many outcomes are possible yet none are certain. The most interesting of the resulting strategic plans can be refined with more detailed models. Based on the strategic modeling findings, uncertainties can be confidently simplified into a smaller number of scenarios to explore in detail.
Notwithstanding its typical application as a strategic model, VisionEval does allow detailed investigation of certain phenomena such as fleet composition and vehicle ownership in relation to Greenhouse Gas Analysis. It also is unique in its ability to explore budget constraints on travel. Its simulation of individual households enables it to assess policies that would be difficult or impossible to model successfully with traditional models.
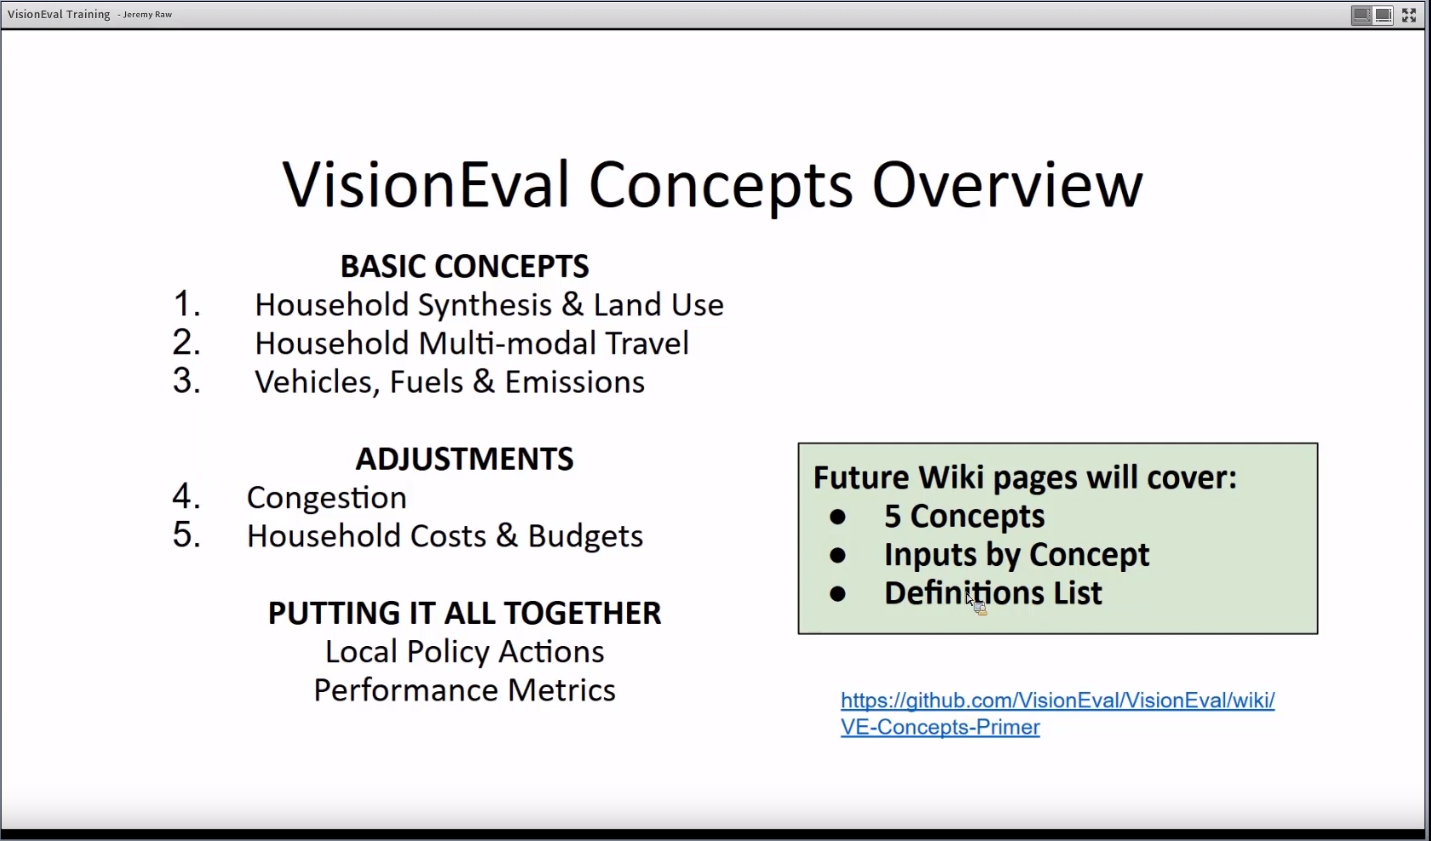
| Base Concept | |
|---|---|
| 1: Household Synthesis & Land Use | Concepts |
| 2: Household Multi-modal Travel | Concepts |
| 3: Vehicles, Fuels & Emissions | Concepts |
| Adjustments | |
|---|---|
| 4: Congestion | Concepts |
| 5: Household Costs & Budgets | Concepts |
| Processing & Validation | Concepts |
Each Concept, using the links above, can be explored in more details. The concepts are illustrative for the purpose of understanding core methods in VisionEval, but do not directly follow the order of operations within the code.
The table below identifies the inputs by category, consistent with VE-RSPM inputs by geo. A comparison to VE-State inputs by geo shows that only the LandUse and the BZone inputs signficantly differ from those below. More inputs provides more description of these inputs by concept, and links to the input spec.
Category - Input Description (geography)
Demographics (Azone)
- Population by age (HH & non-institutional Group Quarters)
- Average Household size, %1-person households
- Licensure drivers rate (optional)
- Average Per Capita Income
LandUse (Bzone)
- Employment by type (Total, Retail, Service)
- Dwelling Units by type (SF, MF);
- Income Quartiles (for allocating households to DUs)
- Share of households in Urban Mixed Use areas (optional)
- Built Form Ds (Design & Transit)
- Acres, Centroid Lat-Lon
Actions
- Road lane-miles (freeways, arterials) (Marea)
- Transit Service (service miles by transit mode) (Marea)
- Car Service costs, substitutability & access time (Azone)
- Short Trips SOV Diversion (bike, personal electrics, etc.) (Azone)
- ITS-Operations (Ramp metering, Incident response, (Marea)
- ITS-Speed smoothing (Freeway ATM, Art Signal optimization) (Marea)
- VMT covered by Drivers in Eco-Drive programs (Marea)
- EV Charging infrastructure (residential) (Azone)
Pricing
- Fuel & electricity costs (Azone)
- Road Cost Recovery – Registration Fee, gas taxes, VMT fee (Azone)
- Carbon Pricing (social cost recovery) (Region)
- Congestion Fees (Marea)
- PAYD insurance participation (Azone)
Vehicle, Fuels, & Emissions
- Electricity Carbon Intensity (Azone)
- Fuel Carbon Intensity (composites by vehicle group) (Region)
- LDV-HH % Light Trucks (stock) (Azone)
- LDV-HH Vehicle Age average (Azone)
- LDV CarService , veh mix (stock) (Region)
- Transit vehicles & fuels mix (Marea)
- LDV CommService vehicle mix, %Light Trucks (stock) (Region)
- Hvy Truck veh mix (stock) (Region)
The following table summarizes one of many possible sets of VE-RSPM standard output metrics summarized at the region level.
Topic Area - Standard VE output metric
Mobility
- Daily VMT per capita
- Annual walk trips per capita
- Daily Bike trips per capita
Economy
- Annual all vehicle delay per capita (hours)
- Daily household parking costs
- Annual HH vehicle operating cost (fuel, taxes, parking)
- Annual HH ownerhsip costs (depreciation, vehicle maintenance, tires, finance charge, insurance, registration)
Land Use
- Residents liming in mixed use areas
- Housing type (SF: MF)
Environmental
- Annual GHG emissions per capita
- HH vehicle GHG/mile
- Commercial vehicle GHG/mile
- Transit Vehicle GHG/mile
Energy
- Annual all vehicle fuel consuption per capita (gallons)
- Average all vehicle fuel efficiency (net miles per gallon)
- Annual external social costs per households (total/% paid)
A key value of VisionEval is how it faciliates running many scenarios or possible futures. In practices, the user typically starts by setting up the model with a reference scenario, best estimate of future conditions. The model can be validated at this point.
This Reference set-up then serves as a pivot point for manual or automated scenario testing. Typically that includes a mix of the following, reflecting “What if” type questions. • Sensitivity Tests (manual) One-at-a-time, change single “category” of inputs • Combination Scenarios (automated) All combinations of “categories” Feeds the VEScenarioViewer
Note that the number of combinations scenarios grows quickly, in a multiplicative manner. For instance all combinations of 3 levels each of land use transit, bike, parking, and TDM policies and 3 fuel price scenarios would result in 243 scenarios (3x3x3x3x3). For this reason, "categories" are often used that combine multiple inputs. Automated processes aid in the set-up and running of these scenarios, and the VE ScenarioViewer can help in exploring and validating such a large number of scenarios.