VE User Experience
dflynn-volpe edited this page Jan 2, 2019
·
1 revision
- Scope/schedule
- Received NTP last week to begin on user experience improvements
- AASHTO team is discussing a peer exchange for September/October, so can we have something to share by then?
- Deliverables:
- Documentation in the wiki of this workshop’s findings and recommendations for implementation
- Iterative updates to the user interface for configuring, running, and visualizing multiple scenarios at once
- How do we specify which inputs can be systematically varied in the VE framework and exposed in the UI?
- How do we communicate within VE model runs in a more programmatic manner than a log file so we can inform the user of progress?
- How do we understand and query multiple runs from within the UI?
- Integrated documentation and tutorials
- Integrated and hidable getting started materials (such as in the RPAT UI) or separate resources (such as an Rmarkdown document or the wiki)?
- Some of these are already in the backlog under the Improve End User Experience Milestone and in the UI Design page.
- For two audiences:
- For setting up and running models: an RShiny-based solution that works with any VE model and can be maintained by modelers with strong R programming skills
- For visualizing results: maybe RShiny or instead just html/javascript so it is more lightweight and can be hosted by GitHub pages
- Provides multiple scenario visualization capabilities, 98, 97, 96
- Integrated documentation and tutorials, 159
- Tested and versioned like all VE resources
- In addition to running locally, also have a demo model in the cloud – for example, visioneval.org/demo, 184
- Implements a clean interface between the R models and the GUI runner + visualizer, 91, 154
- HTTP messages, start+stop text files, etc?
- Needs to output a CSV file of visualizer input data in addition to visualizing the data so user's can load the data into their own tools (Excel, Tableau, R, etc.)
- Seed later module inputs with results from earlier modules so we don't have to re-run everything (i.e. use the same hh module results for a set of travel module runs)
- What’s the relative importance of aesthetics versus features? Aesthetics are important, but functionality must be correct, and the current pilot GUI and Scenario Viewer are not quite what is needed
- Maybe we need a "scenario generator" that builds and checks scenarios? Maybe the user specifies a low/med/high range for input files and then the UI builds X input files/scenarios?
- We need a simpler set of outputs for the beginner user - just a couple key plots of VMT, GHG, etc.
- We need to think about the groups of inputs and outputs and how they map to input files. These meta groups are key to the user experience from start to finish, including documentation.
- Different experiences for different types of users
- Select sites from showmeshiny
- UI, aesthetics
-
pemDemo - clean interface, controls on the left, results on the right, workflow on the top, static graphs so it is not too interactive (and nonlinear), too much interaction can be laggy
- maybe we have a basic view (default) and advanced (that you click to show)?
- BMOP - similar to the pemDemo but includes maps
-
pemDemo - clean interface, controls on the left, results on the right, workflow on the top, static graphs so it is not too interactive (and nonlinear), too much interaction can be laggy
- Maps
-
NZIPR - not a lot of good RShiny map examples, PlaceTypes USA has maps
- could do maps for VERSPM since it has bzones, is nice to show spatial data if possible, use leaflet probably
-
NZIPR - not a lot of good RShiny map examples, PlaceTypes USA has maps
- Cloud-based demo
- shiny io - we would need to pay month for Shiny server online hosting, or host ourselves, so long term that may be an issue, but we all really want an online (atleast demo) version
- UI, aesthetics
- Documentation and Scenario Analysis
- Input documentation management - groups inputs by meta categories, allows for switching between VE modules, show/hide details
-
ODOT SARSPM - cover basics for how ODOT’s scenario planning process works for local planners (not appliers)
- includes very handy Checklist in the appendix
- EERPAT documentation - comprehensive (but separate so likely to fall out-of-date)
-
TFL model variables - Liming's table of model variables is helpful for understanding what variables influence what parts of the model
- should be able to build something based on the VE input, output lists
- documentation should be in a separate window from the UI so the user can see both at once (like in the wiki or a new browser tab, etc.)
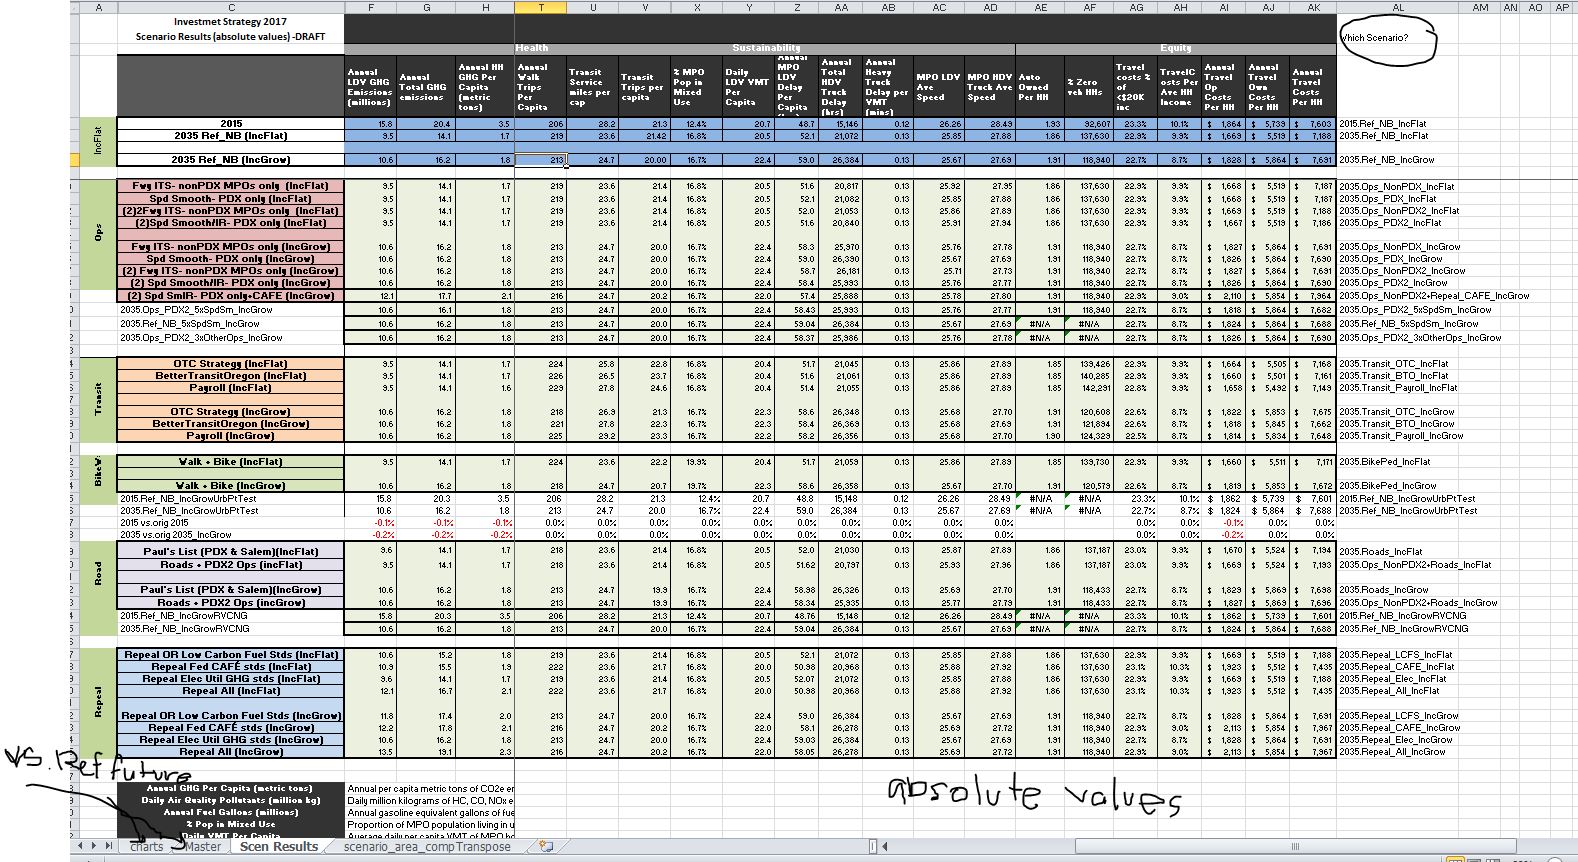
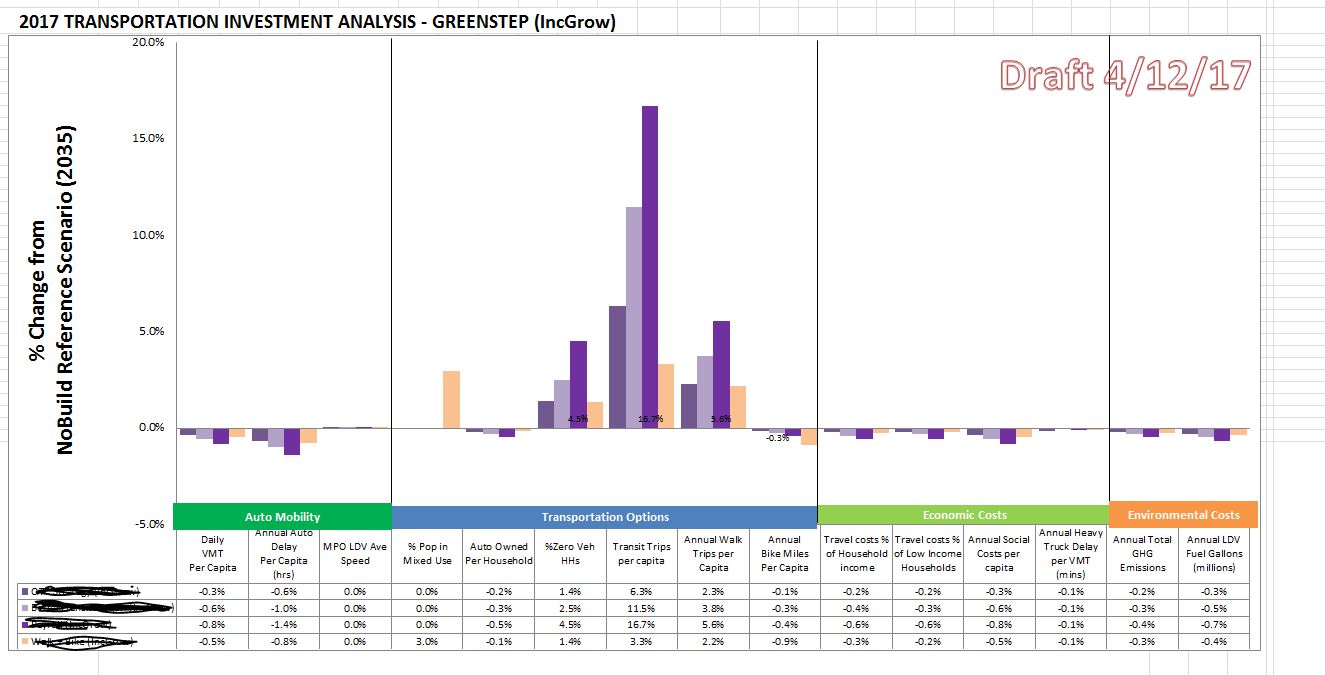
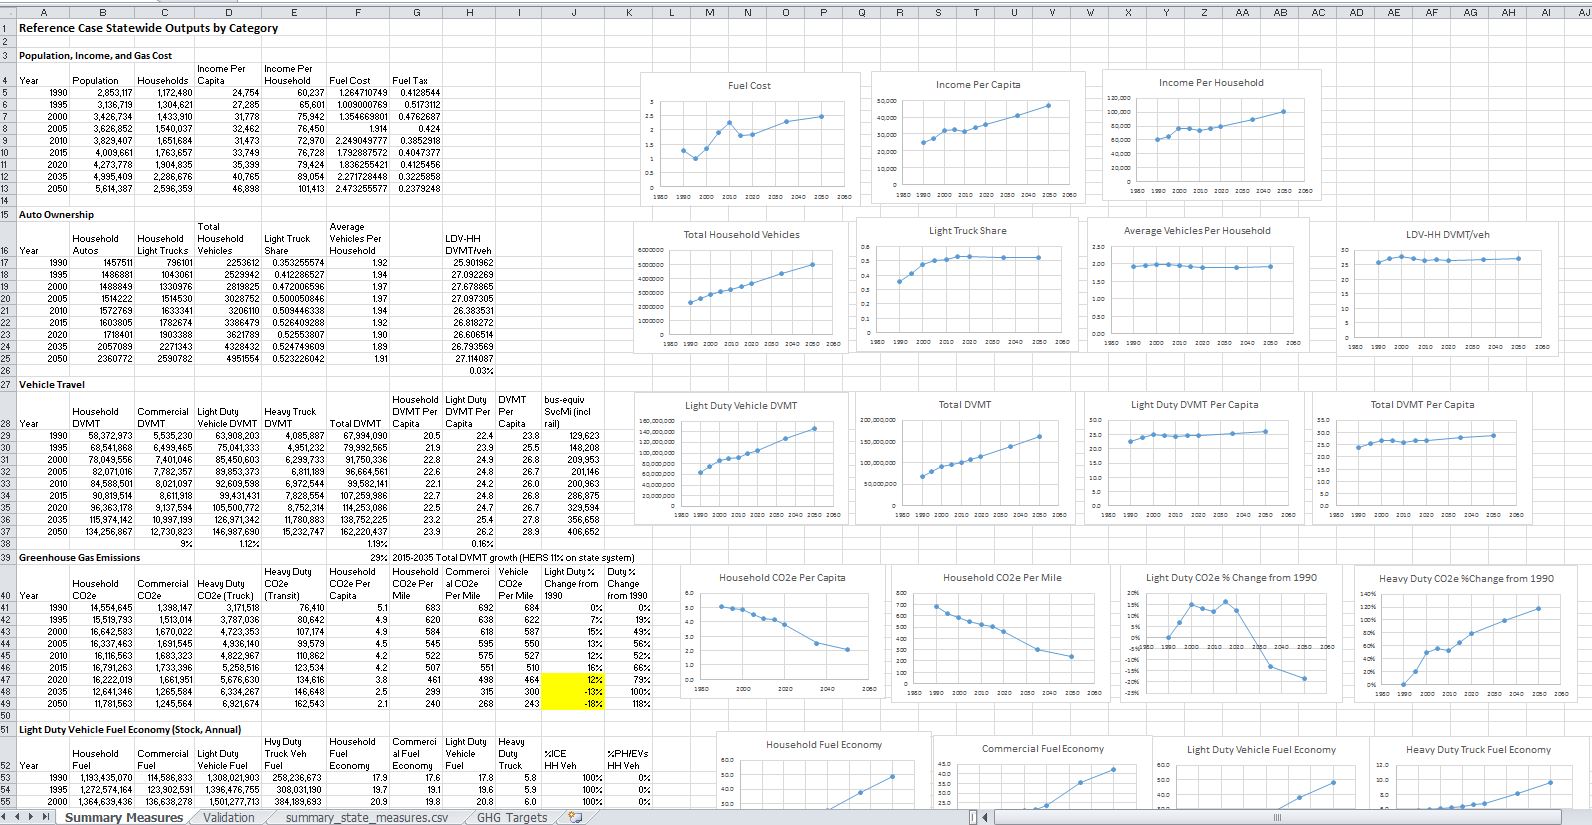
- Query language for outputs and summary_state_measures.csv - run R commands against outputs to create CSV file of metrics for use in Excel, etc.
- Statewide scenario analysis I1, I2, I3, I4, I5 - again, meta groupings of inputs and outputs, calculates metrics relative to a base case, allows for filtering scenarios by inputs/outputs
- sort of like using the model as a solver - set a target and allow inputs to vary within constraints
- Wizards, wire-frames, aesthetics
- TF Guide (Method Selection for Travel Forecasting) / NCHRP Report 852
- The process to develop a good UI is mockup --> wireframes --> annotations/revisions --> code
- Wizards are linear and help the beginner
- Good design is important - use of color, alignment, logos, etc. - for user experience
- Copy scenario button is great
- Documentation integrated and links to relevant topics (hyperlinks and an index for example)
-
FSDM RShiny UI
- 1/3 left of screen for choices, 2/3 right for results, top has workflow steps
- Can build scenarios and then validate and run them
- Our output viewer should be in html/JS so it can be easily hosted
- RShiny for modelers, Javascript for publishing (on GitHub pages for example)
- Important themes from today:
- A matrix of audiences/uses - beginner vs. advanced and scenario setup and runner vs. visualizer
- Wireframing the UI is a good idea
- Auto-build documentation so it can end up in the UI and in other spots (wiki, pdf, etc.)
- Need to think about how we define meta groupings, setup/manage scenarios, etc. since this is important to the user experience from start to finish
- @Ben update these meeting notes (done)
- @Ben and @Brian draft user experience improvement plan / experiment a bit with ideas discussed today
- Schedule
- June - Draft detailed plan; team meet in early July to review
- July - Wireframes, revisions to design
- August - November - iterative development phases
- Tara and Dan to participate as much as needed; design plan will be in the wiki
- @Ben send out doodle for early July meeting
- Getting Started
- VisionEval Primer
- Concepts Primer
- VisionEval Models
- VERPAT Tutorial
- VERSPM Tutorial
- VE-RSPM Training
- VE-State Tutorial
- Developer Orientation