VERPAT Tutorial background
Contains the markdown for top sections at https://github.com/visioneval/VisionEval/wiki/VERPAT-Tutorial
This tutorial describes the purpose, structure, and use of VERPAT (VisionEval Rapid Planning Assessment Tool), a model based on the VisionEval framework for strategic planning of transportation networks.
- Scenario Planning
- The VERPAT Model
- Installation of VisionEval and VERPAT
- Single Scenarios with VERPAT
- Multiple Scenarios with VERPAT
- Performance Metrics
- Bonus material
A group of participants who are engaged in a data driven communication process that seeks to:
- Ask questions
- Develop answers
- Come to agreement on common problems and solutions
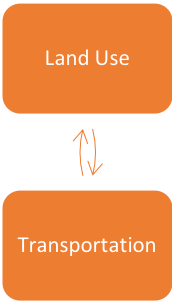
Scenario planning provides a framework for developing a shared vision for the future by analyzing the various forces that affect growth
- Health
- Transportation
- Economics
- Environmental
- Land use
- Helps agencies engage in a more informed and strategic transportation decision-making process
- Used in conjunction with a charrette or chips games, can help stakeholders better understand and visualize future transportation and land use patterns
- Scenario planning software programs can also help develop and assess scenarios, visualize the differences between alternatives, and encourage stakeholder participation
|
|
|
 |
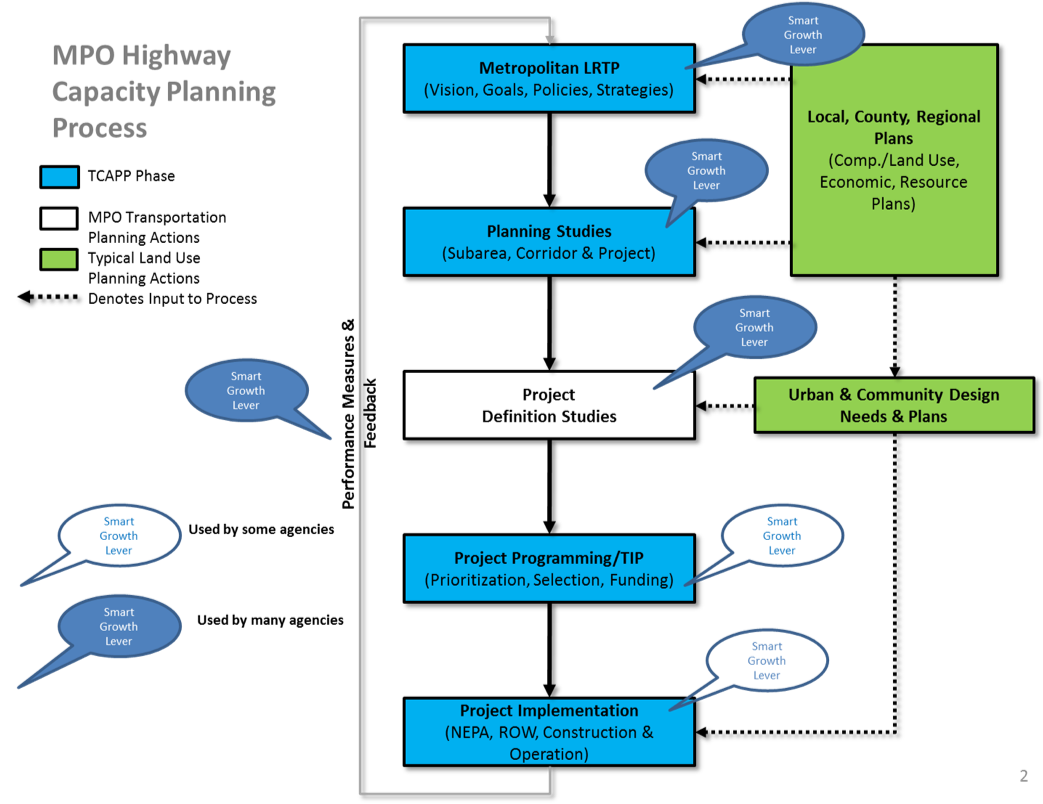
Process maps for state DOTs and MPOs
Areas where smart growth levers can be used
|
 |
TODO: Explain title. Is this section the results of a survey?
Most agencies are interested in scenario planning as a strategy for evaluating land use policies
Many agencies need coordination, cooperation, and communication with local governments on land use policy, since land use regulations are governed by local governments
Agencies also want to understand
- Induced demand
- Travel demand management
- Urban form
- Congestion reduction
- Outcomes and performance
Develop a tool that can be used by land use and transportation planners to provide opportunities for interaction on common goals
TODO: More to say about this table? Introduce it?
| Topic | Well-Established Relationships |
Gaps in Research |
|---|---|---|
| Built environment impact on peak auto demand | Impact on daily travel | Impact by time of day |
| Mobility by mode and purpose | Impact on daily travel | Impact by trip purpose |
| Induced traffic and induced growth | Capacity expansion on an expanded facility | Route shifts, time of day shifts, mode shifts, induced trips, new destinations, growth shifts on the network; effects of operational improvements, land use plans |
| Relationship between smart growth and congestion | Localized effects | Macro-level or regional effects |
| Smart growth and freight | Freight is necessary for population centers | Impacts of loading docks, truck routing, full-cost pricing, freight facilities and crossings, inter-firm cooperation, stakeholder communication |
TODO: Introduce this table
Built Environment: Location of population and employment by place type
| Development Type | Urban Core | Close in Community | Suburban | Rural |
|---|---|---|---|---|
| Residential | X | X | X | |
| Employment | X | X | X | |
| Mixed-use | X | X | X | |
| Transit Oriented Development | X | X | X | |
| Rural/Greenfield | X |
Demand Management Policies
TODO: Introduce bullets
- Vanpool
- Telecommuting
- Ridesharing
- Transit pass programs
Measures
- Proportion of population and employment by place type
- Population and employment densities by place type
TODO: Introduce these bullets
Travel Demand
- Changes in population demographics
- Changes in personal income
- Changes in firm size or industry
- Auto and light truck proportions by year
- Induced demand – short term impacts
Transportation Policies
- Vehicle miles traveled charges
- Parking pricing programs
- Intelligent transportation system strategies for freeways and arterials
Transportation Supply
- Amount of regional transit service
- Amount of freeway and arterial capacity
TODO Introduce these bullets
- Support strategic planning efforts
- Consider many possible scenarios
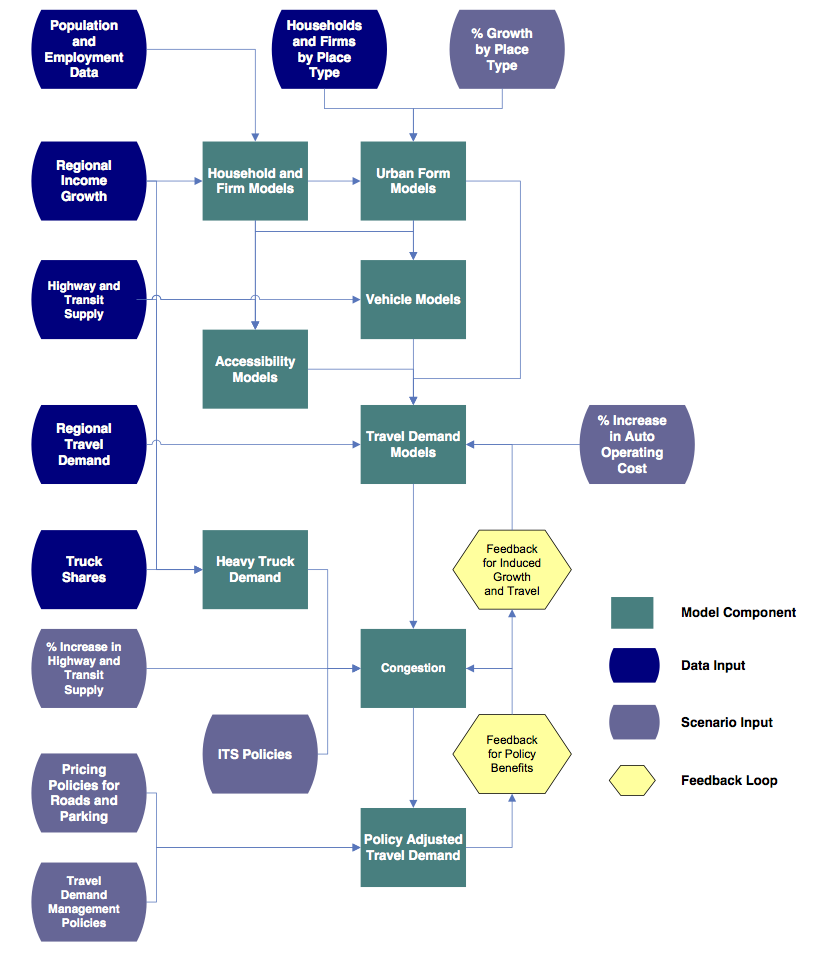
- Combines higher level analysis of the transportation supply with individual characteristics of travel demand, built environment and policies
- Growth by place type
- Households (persons by age and income)
- Firms (employees and industry)
- Income growth
- Truck and bus VMT
- Accessibility
- Congestion
- Induced growth
- Policy benefits
- Easy to apply and run quickly
Strategic models bridge the gap between regional visioning and specific plans 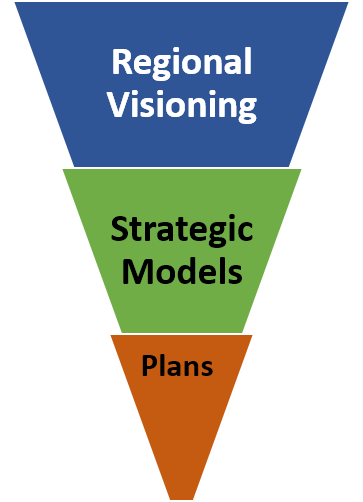
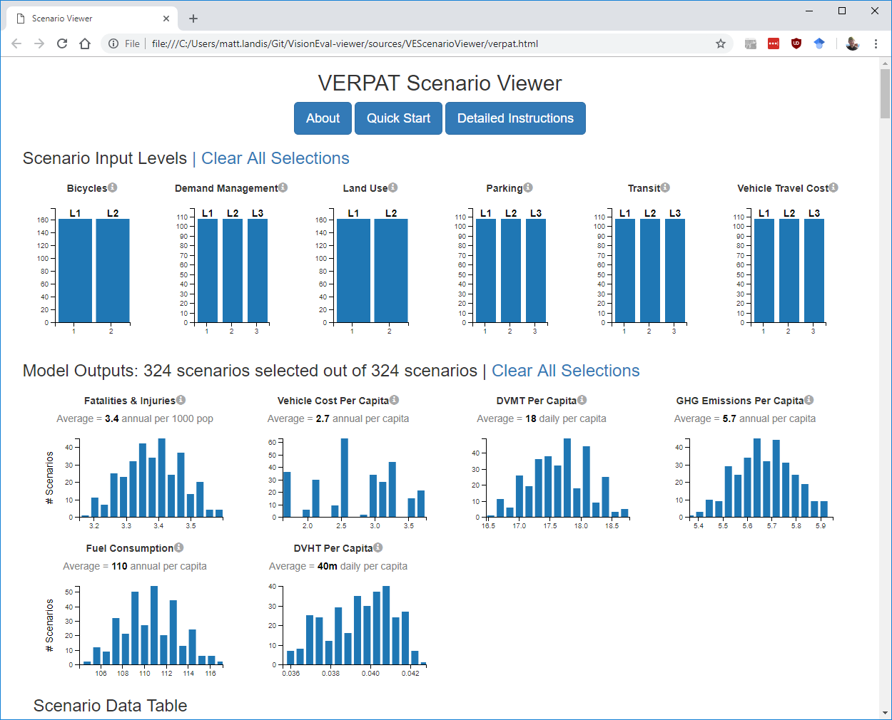
Evaluate scenarios across a range of performance metrics
- Community Impacts
- Travel Impacts
- Environmental and Energy Impacts
- Financial and Economic Impacts
- Location Impacts
Compare multiple scenarios at a time graphically to quickly assess results
TODO: Check links -- are they correctly associated with bullets?
 |
- Captures individual household and firm characteristics
- Captures interactions between policies
- Spatial results are by place type
For more, see VERPAT Modules and Outputs.
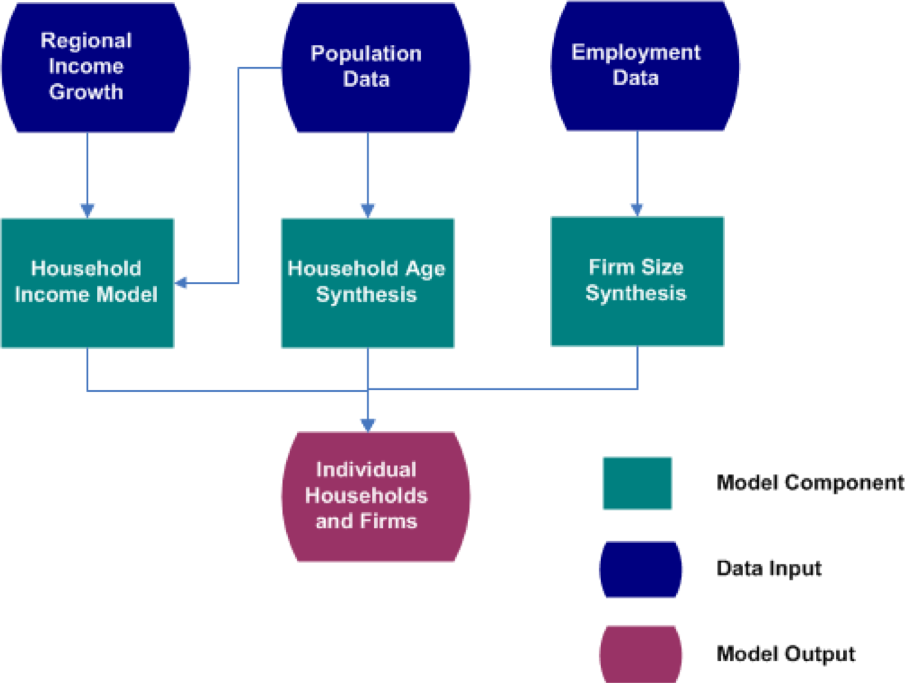
- Person by Age (from census data)
- Household income (from Bureau of Economic Analysis data)
- Employees
- Industry (from County Business Pattern data)
Data can be updated from local sources
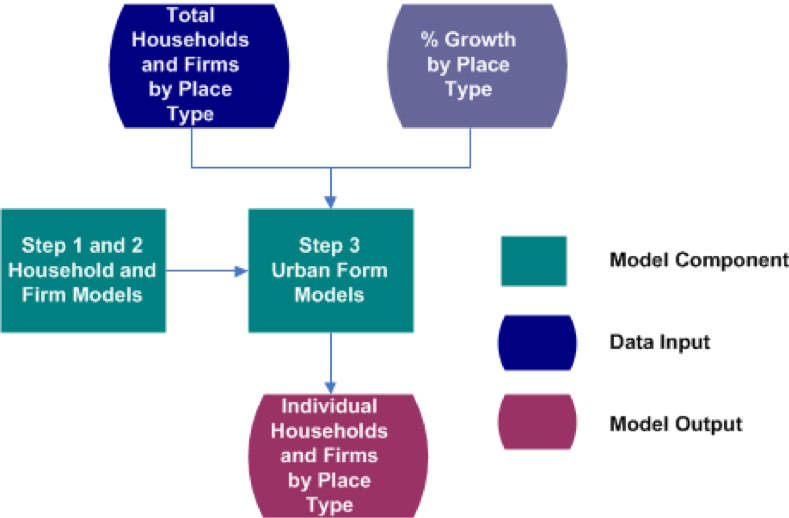
Predicts place types
- Area Types (4)
- Development Patterns (4)
Based on households with
- Working age persons
- Children
- Seniors
Adjusted to fit regional totals
Modules are available in the VELandUse package.
Inputs
- Freeway lane miles
- Transit revenue miles (annual bus and rail revenue miles per capita)
Outputs
- Freeway lane miles per person
- Transit revenue miles per person
Relates both transit and auto accessibility to travel behavior.
Used in vehicle ownership models and vehicle miles traveled models.
Modules are available in the VETransportSupply package.
Predicts number of vehicles for each household
- Autos
- Bikes
- Light trucks
Predicts vehicles by age/fuel efficiency
Based on
- Number of persons of driving age
- Elderly persons
- Household income
- Population density
- Freeway and transit supply
- Urban mixed-use area
Modules are available in the VEHouseholdVehicles package.
Predicts vehicle miles traveled for each household
- Autos and light trucks
- Heavy trucks
- Buses and passenger rail
Based on
- Household income
- Population density
- Number of household vehicles
- Freeway and transit supply
- Driving age persons in household
- Elderly persons in household
- Mixed use development
Truck VMT is based on changes in regional household income
Bus VMT is calculated from bus revenue miles
Modules are available in the VEHouseholdTravel package.
Three aspects are represented:
- VMT is allocated to freeways and arterials by congestion level
- Speeds and fuel economies are calculated for freeways and arterials
- Congestion in local areas is estimated from increased activity
Congestion is part of a feedback loop between changes in each scenario and induced growth
Modules are available in the VETransportSupplyUse package.
Definition: Additional demand resulting from adding transportation supply
Short term -- induced demand
- Changes in road supply, function of speed
- Potential mode and route shift
Long term -- induced growth: changes in growth patterns resulting from changes in travel patterns
Induced demand is calculated in the VEHouseholdTravel package.
TODO introduce bullet points
Direct travel impacts
- Daily VMT
- Daily vehicle trips
- Daily transity trips
- Peak travel speeds by facility type
- Vehicle hours of travel
- Vehicle hours of delay
Community impacts
- Public health impacts and costs
- Equity impacts
Environment and energy impacts
- Fuel consumption
- Greenhouse gas emissions
- Criteria emissions
Financial and economic impacts
- Regional highway infrastructure costs
- Regional transity infrastructure and operating costs
- Annual traveler cost
Land market and location impacts
- Regional accessibility
Performance metrics are calculated in the VEReports package. For more information, also see VERPAT Modules and Outputs.