VERPAT Tutorial Model Description
VERPAT is a tool for evaluating the impact of various smart growth policies. VERPAT is designed to be a high-level evaluation at a regional scale that can bridge the distance between evaluating smart growth policies during a regional visioning process and evaluating smart growth policies at a project or alternative level in a regional transportation plan. VERPAT evaluates policy scenarios to identify the most promising policies that could be further tested using a more detailed project-level tool. Currently, VERPAT can provide information on the following changes in the regional system:
- Built Environment - changes to the urban form (proportion of population and employment living in mixed-use areas, transit-oriented developments, or rural/greenfield areas)
- Travel Demand - changes in population demographics (age structure), changes in personal income, changes in firms by size or industry, relative amounts of development occurring in urban core, close-in communities, suburban or rural areas, urban core, auto and light truck proportions by year, and induced demand
- Transportation Supply - amounts of regional transit service, amounts of freeway and arterial capacity
- Policies - pricing (vehicle miles traveled charges or parking pricing programs), intelligent transportation system (ITS) strategies for freeways and arterials, demand management (vanpool, telecommuting, ridesharing, and transit pass programs)
VERPAT is designed to evaluate regions, which can be a multi-county metropolitan region. It distinguishes between population and employment living/working in the urban core, close-in communities, suburban and rural/greenfield areas based on densities, diversity in land uses, street design or intersection densities, job accessibility by auto, distances to transit stops, and connectivity of the street system.
The intended audience for VERPAT is regional decision-makers and land use and transportation planners involved in the development and evaluation of transportation and land use policies, and who need to conduct scenario planning to evaluate smart growth policies and determine their impact on travel demand. VERPAT was designed to address as many of the limitations identified in the research as possible and to provide a tool that filled a gap in the set of available tools. The relationships in the VERPAT tool were based upon the background research conducted for the SHRP 2 C16 project. VERPAT is designed to allow the evaluation of a wide range of policies and combination of policies in a consistent framework quickly and easily so that promising smart growth strategies can be identified and pursued in the land use and transportation planning processes. VERPAT is intended to precede and supplement more sophisticated modeling efforts, which can be used to evaluate specific smart growth projects. It is designed to be accessible to land use and transportation planners with no modeling experience.
VERPAT is a disaggregate policy model that predicts travel demand impacts at an individual household level.
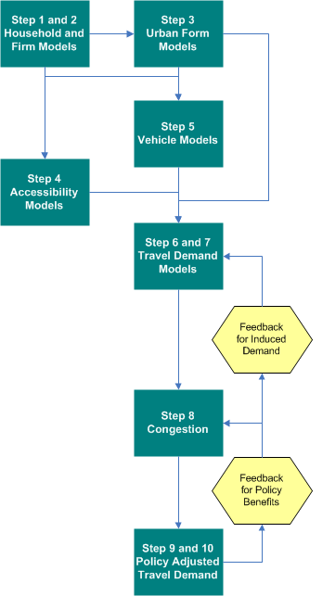
The diagram below illustrates the modeling system with model components and feedback loops. Links are provided to the source code that implements each section.
 |
|
For more, see VERPAT Modules and Outputs.
VERPAT does not provide specific spatial results beyond the built environment categories at the regional level, but does capture individual household and firm characteristics and the interactions between policies. The disaggregate nature of the model captures impacts that may be occurring for small portions of the population (say 0-vehicle households) where aggregate models have a more difficult time capturing these impacts.
The following is an explanation of major steps in the model execution
[] = indicates VE modules
- Household Model - Households Package
Create synthetic households for the region, including persons [Create Households] and workers [Predict Workers] by age group. A total household income is assigned to each household, given the ages of persons in the household and the average per capita income of the region where the household resides [PredictIncome].
2. Firm Model - Synthetic Firms Package
A set of firms is created for each forecast year that represents the likely firm composition for the region, given the County Business Pattern data of firms by size and industry. Each firm is described in terms of the number of employees and its industry [CreateBaseSyntheticFirms] and [CreateFutureSyntheticFirms].
3. Urban Form Model - Land Use Package
Calculate Place Types for Households and Firms - Population and employment location characteristics are important variables in the vehicle ownership, travel demand, and accessibility models. There are four place types (urban core, Close-in Community, suburban, and rural and five location categories (residential, commercial, mixed-use, transit-oriented development, and Greenfield)]. Models for households were developed to estimate location characteristics using National Household Travel Survey data. Firms are currently allocated randomly to fit the employment allocation inputs since there are no national datasets from which to draw these relationships [CalculateBasePlaceTypes] and [CalculateFuturePlaceTypes].
4. Accessibility Model - Transport Supply Package
Calculate Freeway, Arterial, and Public Transit Supply Levels - The number of lane miles of freeways and arterials is computed for each region based on the change in inventories for a particular scenario. For public transit, the inputs specify the change in transit revenue miles relative to the base. Inputs for each area also specify the revenue mile split between electrified rail and buses [CreateBaseAccessibility] and [CreateFutureAccessibility].
5. Vehicle Model - Household Vehicle Package
Calculate Vehicle Ownership - Each household is assigned the number of vehicles it is likely to own based on the number of persons of driving age in the household, whether only elderly persons live in the household, the income of the household, the population density where the household lives, the freeway supply, the transit supply, and whether the household is located in an urban mixed-use area. [AssignVehicleFeatures] and [AssignVehicleFeaturesFuture].
6. Travel Demand Model - Household Travel Package
Calculate Travel Demand - The average daily vehicle miles traveled, classification of vehicles as electric vehicles, auto and transit trips for each household is modeled based on household information determined in previous steps for the base conditions. The model is sensitive to household income, population density of the neighborhood where the household resides, number of household vehicles, whether the household owns no vehicles, the levels of public transportation and freeway supplies in the region, the driving age population in the household, the presence of persons over age 65, and whether the neighborhood is characterized by mixed-use development. [CalculateTravelDemand] and [CalculateTravelDemandFuture].
Calculate Truck and Bus Vehicle Miles Traveled (VMT) - Regional truck VMT is calculated based on changes in the regional household income. As a default, a one-to-one relationship between regional income growth and truck VMT growth is assumed. In other words, a doubling of total regional income would result in a doubling of truck VMT. Bus VMT is calculated from bus revenue miles that are factored up to total vehicle miles to account for miles driven in non-revenue service. [CalculateTravelDemand] and [CalculateTravelDemandFuture].
7. Congestion Model - Transport Supply Use Package
Calculate the amount of congestion – Auto, and light truck VMT, truck VMT and bus VMT are allocated to freeways, arterials, and other roadways. Truck and bus VMT are allocated based on mode-specific data, and auto and light truck VMT are allocated based on a combination of factors and a model that is sensitive to the relative supplies of freeway and arterial lane miles. System-wide ratios of VMT to lane miles for freeways and arterials are used to allocate VMT to congestion levels using congestion levels defined by the Texas Transportation Institute for the Urban Mobility Report. Each freeway and arterial congestion level is associated with an average trip speed for conditions that do and do not include ITS treatment for incident management on the roadway. Overall average speeds by congestion level are calculated based on input assumptions about the degree of incident management. Speed vs. fuel efficiency relationships for light vehicles, trucks, and buses are used to adjust the fleet fuel efficiency averages computed for the region. [CalculateCongestionBase], [CalculateCongestionFuture], and [CalculateCongestionPolicy].
Following initial calculations for baseline conditions, the model has feedback loops, which allow for changes in travel demand and other impacts based on induced travel demand and for changes in policies for a given scenario. Congestion is recalculated following these adjustments to demand.
-
Induced Demand Model - Household Travel Package
Calculate Induced Travel Demand - Induced demand is calculated for changes in roadway supply in the near term as a function of speed, based on potential mode and route shifts to produce changes in VMT and in the longer term to include changes in vehicle ownership, still as a function of speed. This model does not include induced demand as a result of changes in growth that may occur as part of a smart growth scenario because the evidence is limited empirical evidence. [CalculateInducedDemand].
-
Policy Adjusted Travel Demand - Household Travel Package
Calculate Scenario Travel Demand - The average daily VMT for each household can be adjusted based on changes in growth patterns by place type, changes in auto operating cost, changes in road lane miles or transit revenue miles for any scenario. There are also a series of policy assumptions that can contribute to changes in VMT: pricing such as VMT charges or parking pricing, ITS strategies for freeways and arterials, and vanpool, telecommuting, ridesharing, and transit pass programs. All of these will contribute to shifts in travel demand for a given scenario. [CalculatePolicyVmt].
Performance metrics are calculated in the VEReports package. The other impacts that are produced for a given scenario include environment and energy impacts greenhouse gas (GHG) emissions and fuel consumption), financial and economic impacts (highway and transit infrastructure costs, transit operating costs, and traveler costs), regional accessibility, and community impacts (livability and public health indicators).