VERPAT Tutorial Performance Metrics
A large number of performance metrics are produced during the run of the RPAT model, including environment and energy impacts, financial and economic impacts, and community impacts.
Performance metrics are calculated by the ReportRPATMetrics module, located in the VEReports package.
The full list of outputs available is shown here and is as follows:
- EmissionsMetric: The amount of greenhouse gas emissions per day by place-types
- FuelMetric: The amount of fuel consumed per day by place-types
- CostsMetric: The annual traveler cost (fuel + charges)
- FuelGallonsMetric: Average daily fuel consumption in gallons after policy
- FuelCo2eMetric: Average daily Co2 equivalent greenhouse gas emissions after policy
- FutureCostPerMileMetric: Total fuel cost per mile after policy
- TotalCostMetric: Total fuel cost after policy
- RailPowerMetric: Annual power consumption by rail
- TruckFuelMetric: Annual truck fuel consumption
- BusFuelMetric: Annual bus fuel consumption
- TruckCo2eMetric: Annual greenhouse gas emissions by truck
- BusCo2eMetric: Annual greenhouse gas emissions by bus
- RailCo2eMetric: Annual greenhouse gas emissions by rail
- HighwayCostMetric: Regional highway infrastructure costs
- TransitCapCostMetric: Regional transit infrastructure costs
- TransitOpCostMetric: Regional transit operating costs
- TransitRevenueMetric: Annual fare revenue
- FatalIncidentMetric: Number of fatal incidents
- InjuryIncidentMetric: Number of incidents with injuries
- PropertyDamageMetric: Amount of incidents with property damage
- TruckConsumptionMetric: Annual truck fuel consumption by fuel type
- BusConsumptionMetric: Annual bus fuel consumption by fuel type
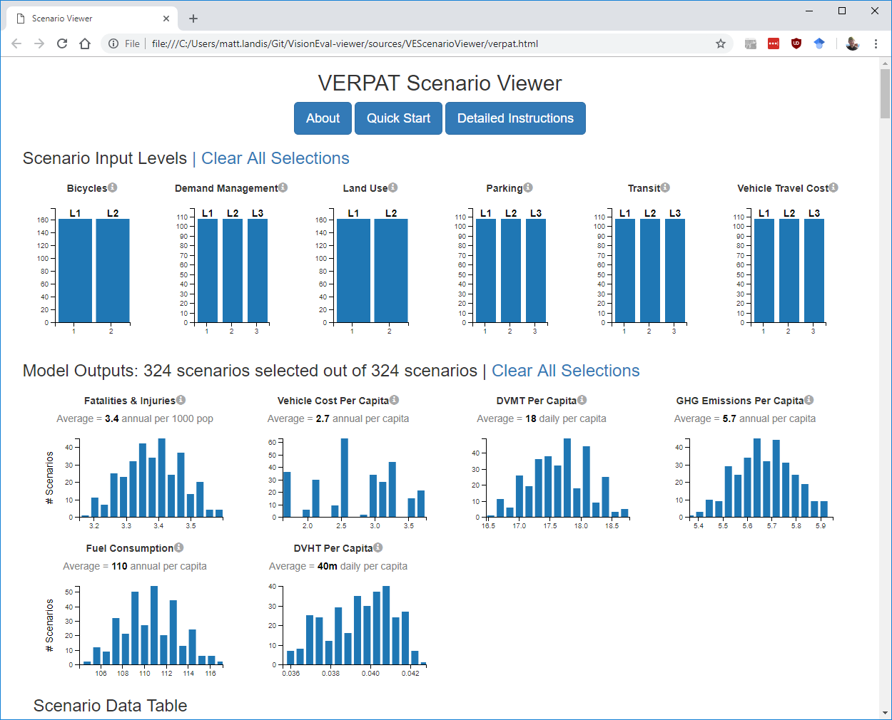
For simplicity, six key metrics are calculated from multiple scenario runs and are shown on the Scenario Viewer output page:
- Fatalities & Injuries: annual traffic fatalities and injuries per 1000 persons
- Vehicle Cost Per Capita: average annual cost for owning and operating vehicles per person
- DVMT Per Capita: average daily vehicle miles traveled per person
- GHG Emissions Per Capita: average annual metric tons of greenhouse gas emissions per person
- Fuel Consumption: average annual gallons of gasoline and other fuels consumed per person
- DVHT Per Capita: average daily vehicle hours of travel per person
Each one is displayed as a histogram of the number of scenarios.
More detail on how to view and select results is described in Multiple Scenarios.