Trinity Runtime Profiling
To make use of progress monitoring, you need to install the Trinity plugins. Simply type 'make plugins' in the base Trinity installation directory to do this.
To examine a summary report of resources consumed during a complete run of Trinity, you can run Trinity with the '--monitoring' parameter. This will cause Trinity to run the collectl alongside of it to capture resource usage statistics. Collectl polls the operating system to examine CPU, memory, and I/O usage and we capture those data at regular intervals (defined by the Trinity parameter '--monitor_sec', default set to 60 seconds).
The resource usage statistics are collected in a file that is written to '${PWD}/collectl/collectl.dat'. You can generate a report summary and a viewable plot of resource usage vs. time by running the following once the Trinity job has completed:
$TRINITY_HOME/trinity-plugins/COLLECTL/examine_resource_usage_profiling.pl collectl
Note, be sure to run this in your original working directory that contains the collectl/ subdirectory.
This will generate output files:
 collectl.cpu_usage.matrix
 collectl.ex2.mem_usage.matrix
 collectl.IO_usage.matrix
and
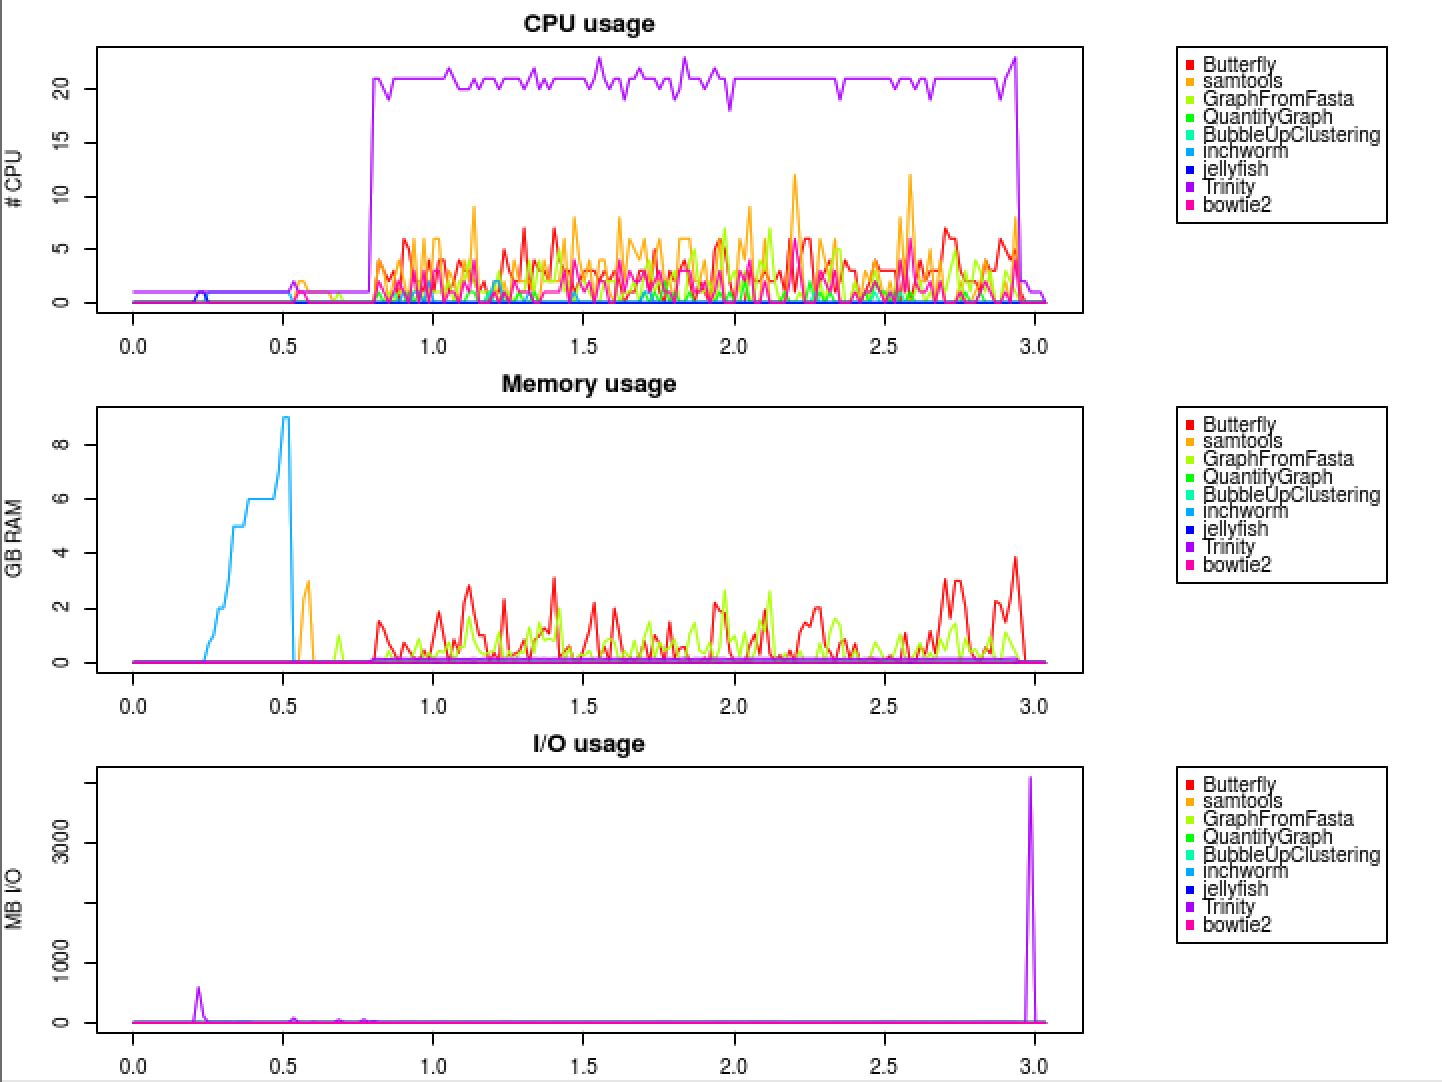
collectl.plot.pdf
View the pdf to examine the resource usage vs. run time. For example, here's the progress monitoring view for processing 10M PE 76 base mouse fastq files through Trinity, showing the resource usage as a function of time (hours).
and another example using 50 M PE reads:
