Output of Trinity Assembly
When Trinity completes, it will create a 'trinity_out_dir.Trinity.fasta' output file (or prefix based on the output directory you specify).
Trinity groups transcripts into clusters based on shared sequence content. Such a transcript cluster is very loosely referred to as a 'gene'. This information is encoded in the Trinity fasta accession. An example Fasta entry for one of the transcripts is formatted like so:
 >TRINITY_DN1000_c115_g5_i1 len=247 path=[31015:0-148 23018:149-246]
 AATCTTTTTTGGTATTGGCAGTACTGTGCTCTGGGTAGTGATTAGGGCAAAAGAAGACAC
 ACAATAAAGAACCAGGTGTTAGACGTCAGCAAGTCAAGGCCTTGGTTCTCAGCAGACAGA
 AGACAGCCCTTCTCAATCCTCATCCCTTCCCTGAACAGACATGTCTTCTGCAAGCTTCTC
 CAAGTCAGTTGTTCACAGGAACATCATCAGAATAAATTTGAAATTATGATTAGTATCTGA
 TAAAGCA
The accession encodes the Trinity 'gene' and 'isoform' information. In the example above, the accession 'TRINITY_DN1000_c115_g5_i1' indicates Trinity read cluster 'TRINITY_DN1000_c115', gene 'g5', and isoform 'i1'. Because a given run of trinity involves many many clusters of reads, each of which are assembled separately, and because the 'gene' numberings are unique within a given processed read cluster, the 'gene' identifier should be considered an aggregate of the read cluster and corresponding gene identifier, which in this case would be 'TRINITY_DN1000_c115_g5'.
So, in summary, the above example corresponds to 'gene id: TRINITY_DN1000_c115_g5' encoding 'isoform id: TRINITY_DN1000_c115_g5_i1'.
The Path information stored in the header ("path=[31015:0-148 23018:149-246]") indicates the path traversed in the Trinity compacted de Bruijn graph to construct that transcript. In this case, node '31015' corresponds to sequence range 0-148 of the transcript, and node 23018 corresponds to sequence range 149-246 of the transcript sequence. The node numbers are unique only in the context of a given Trinity gene identifier, and so graph nodes can be compared among isoforms to identify unique and shared sequences of each isoform of a given gene.
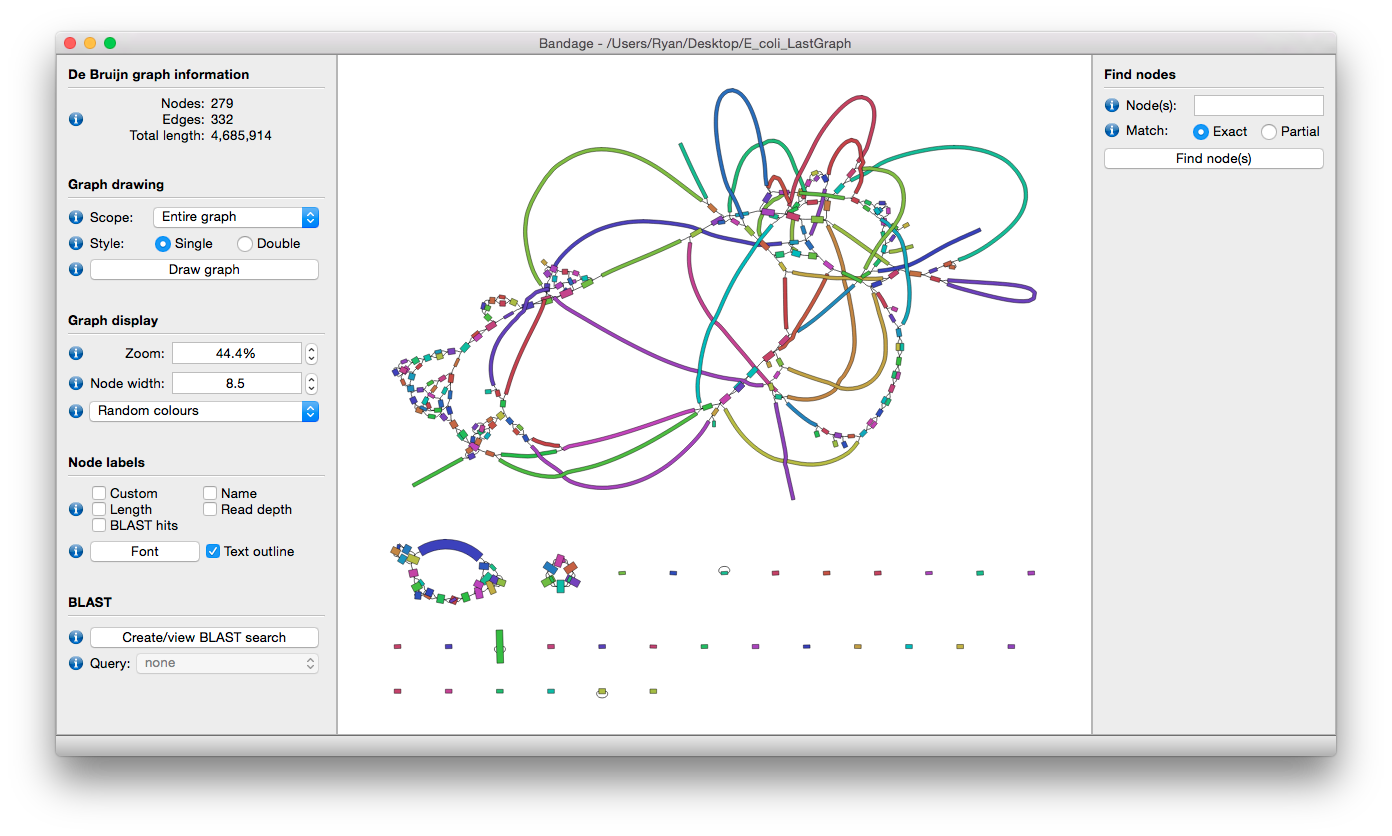
The Trinity assembly can be visualized using Bandage. See video https://www.youtube.com/watch?v=VuRN28XyFcI.