Navigating Trinity DE features Using TM4 MeV
Welcome to our introductory guide to using MeV to navigating your differentially expressed gene or transcript data!
First, be sure to have the TM4 MeV software installed.
Note, the tutorial below refers to the earlier desktop application MeV, but the latest version of MeV is actually a web-application and can be found here. Eventually, the tutorial below will be updated to reflect the latest web app.
Next, follow the instructions below to upload your expression matrix into MeV. We'll assume that you're starting with results generated from having run through the [DE analysis] step, and have a file such as 'diffExpr.P0.001_C2.matrix.log2.dat' in your workspace, as generated from 'analyze_diff_expr.pl' in the DE analysis step. This matrix contains the (TMM-normalized) expression values for those features that are at least 2^2 (or 4) -fold DE with an FDR <= 0.001. Note, as you can see from the filename, this matrix has already been log2 transformed, which we'll comment on again shortly.
If you're using the matrix file generated by the Trinity DE analysis process, it's going to be formatted for use with typical R software and will need to be ever-so-slightly tweaked for using with MeV.
The column header line needs to be shifted over so that it lines up with the actual data columns. This is simple to do in the 'vim' text editor on linux.
Open the file using 'vim':
vim diffExpr.P0.001_C2.matrix.log2.dat
If you don't know how to use vim, simply do the following operations:
- click 'i' to enable insert-mode.
- insert a tab character as the first character (just click the tab key on the keyboard)
- exit insert-mode by clicking the 'esc' key on the keyboard
- save and exit 'vim' by typing ':wq' and enter.
The matrix should now be ready for loading into MeV as described below.
From the main MeV application menu, select 'File'->'Load Data':
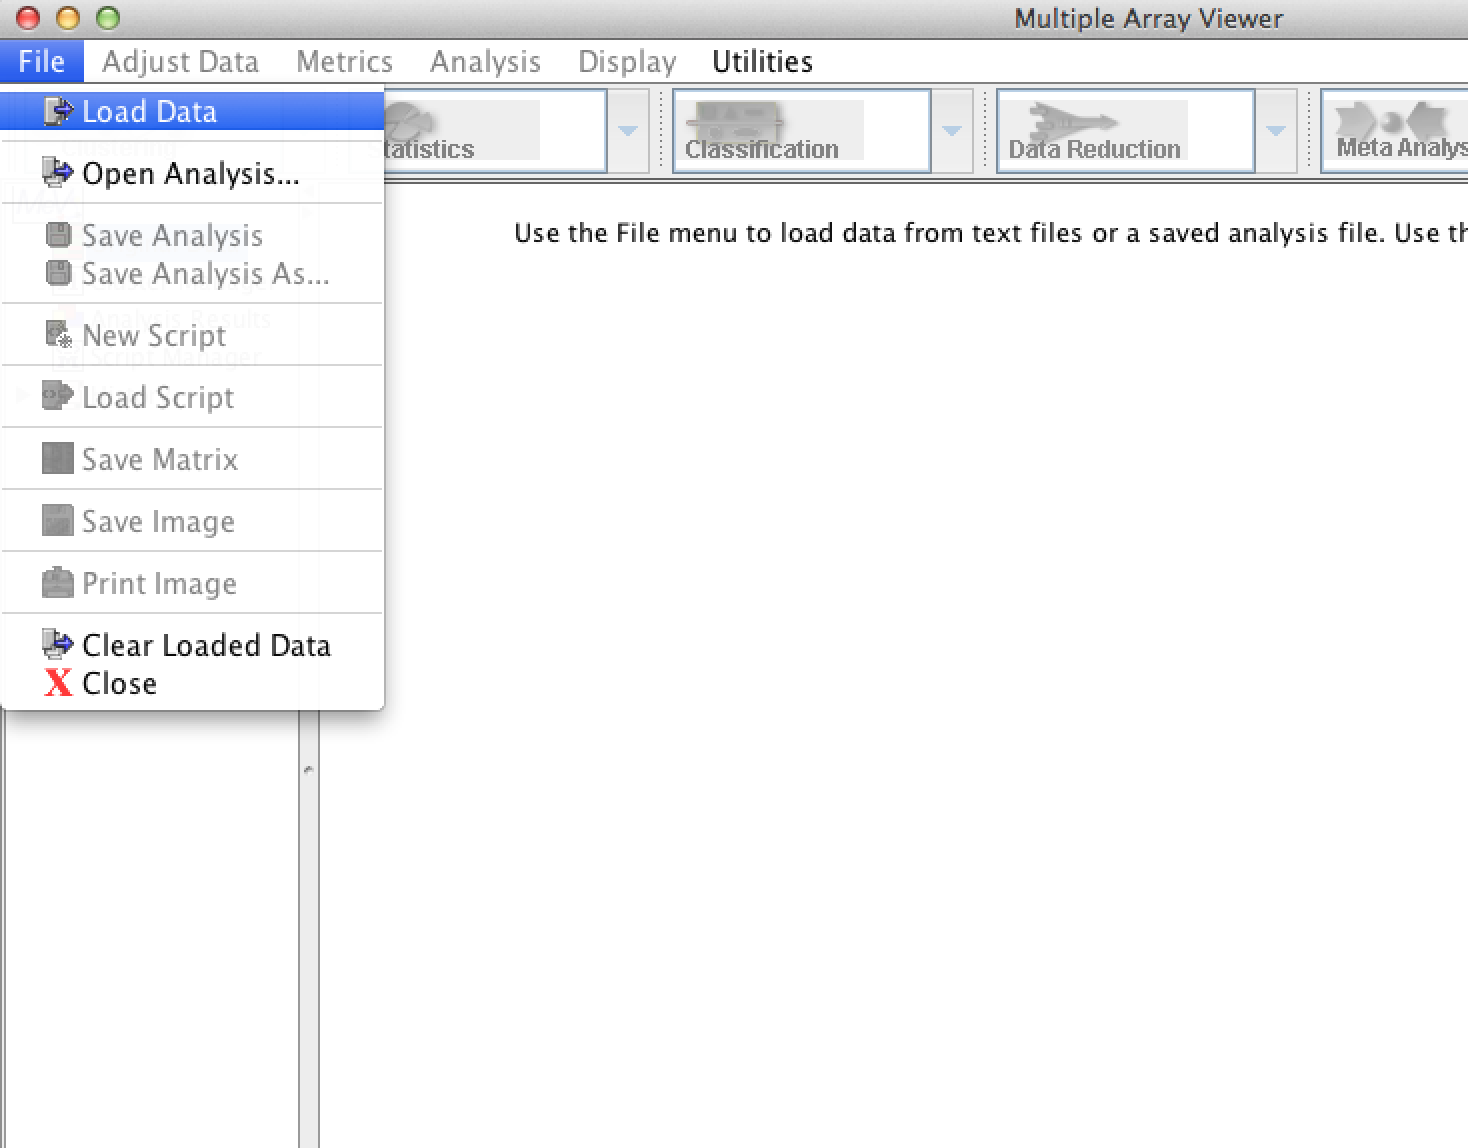
This will give you the file loading dialog:
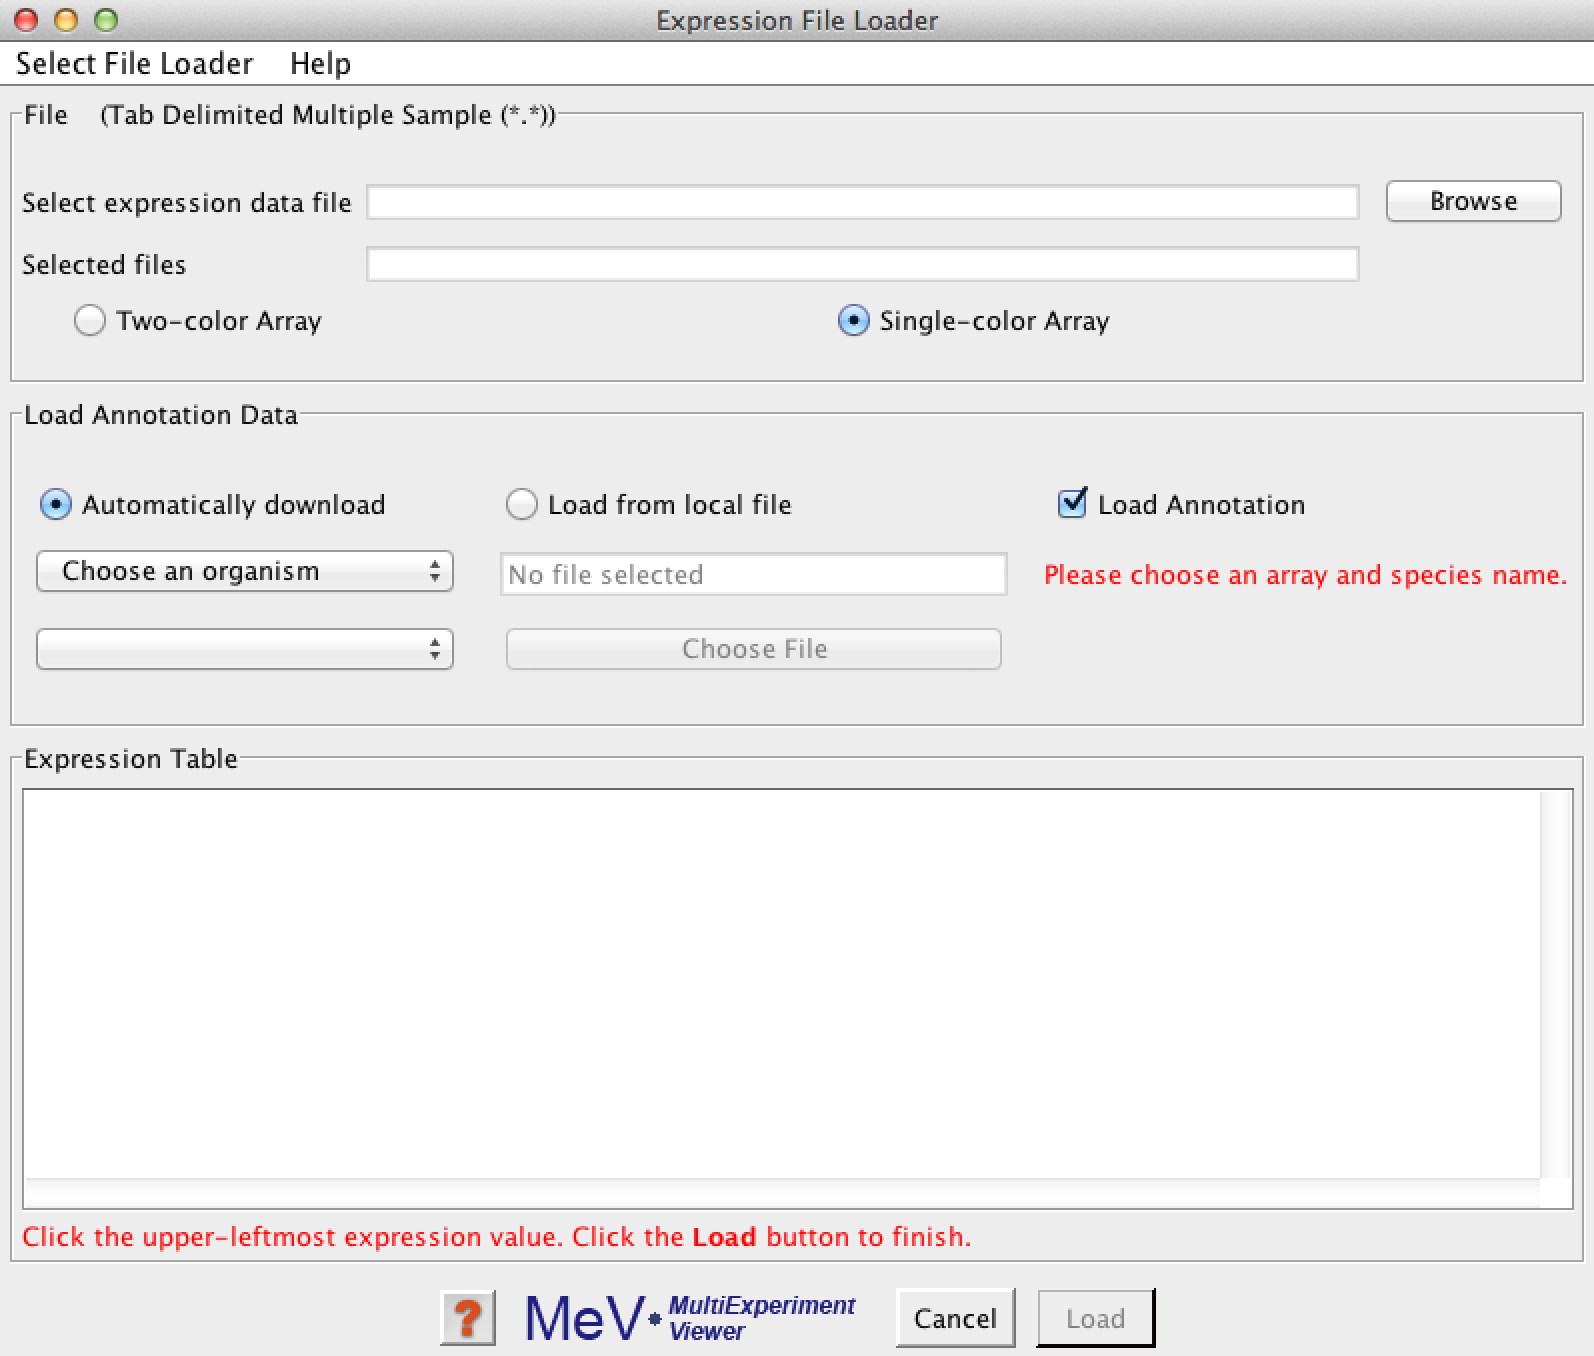
Click the 'Browse' button and select your expression matrix file:
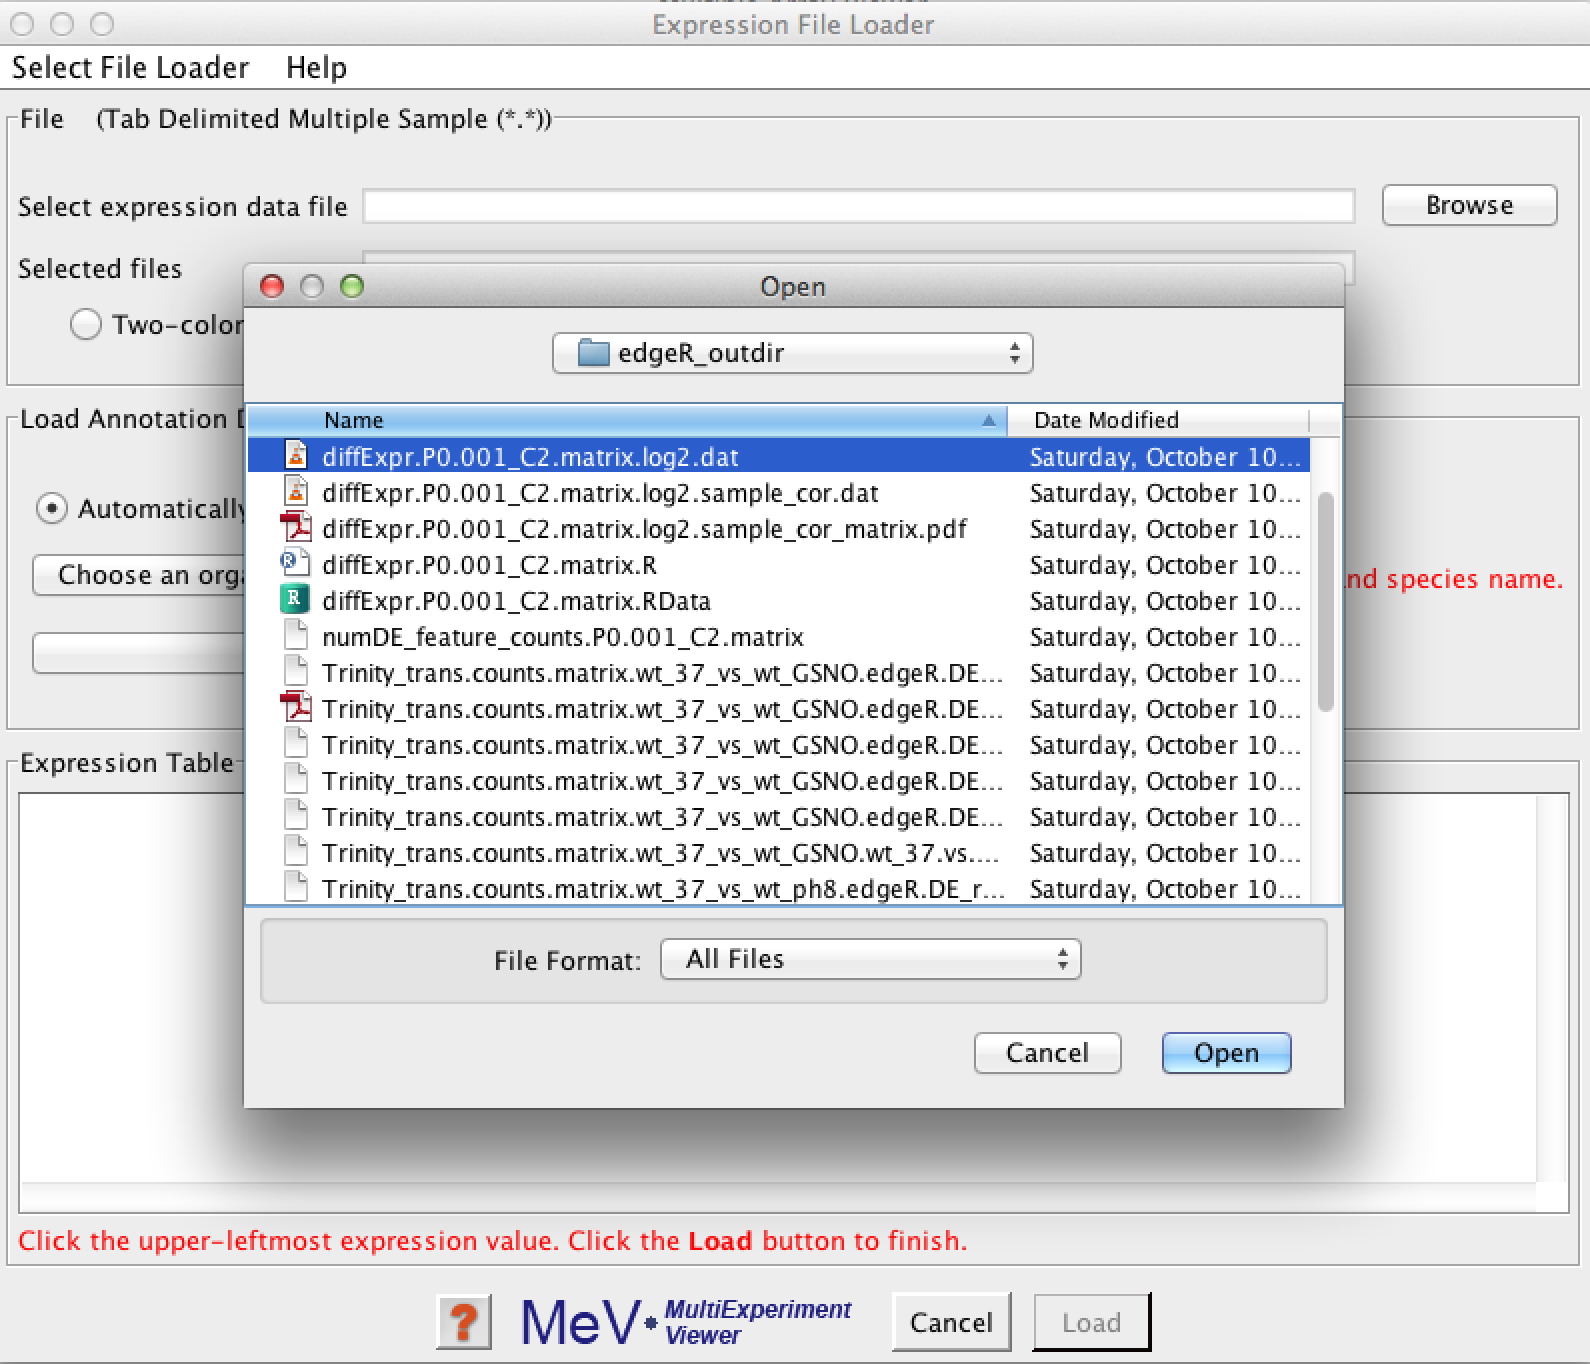
after selecting your data file, it should provide you with a quick view of your data like so:
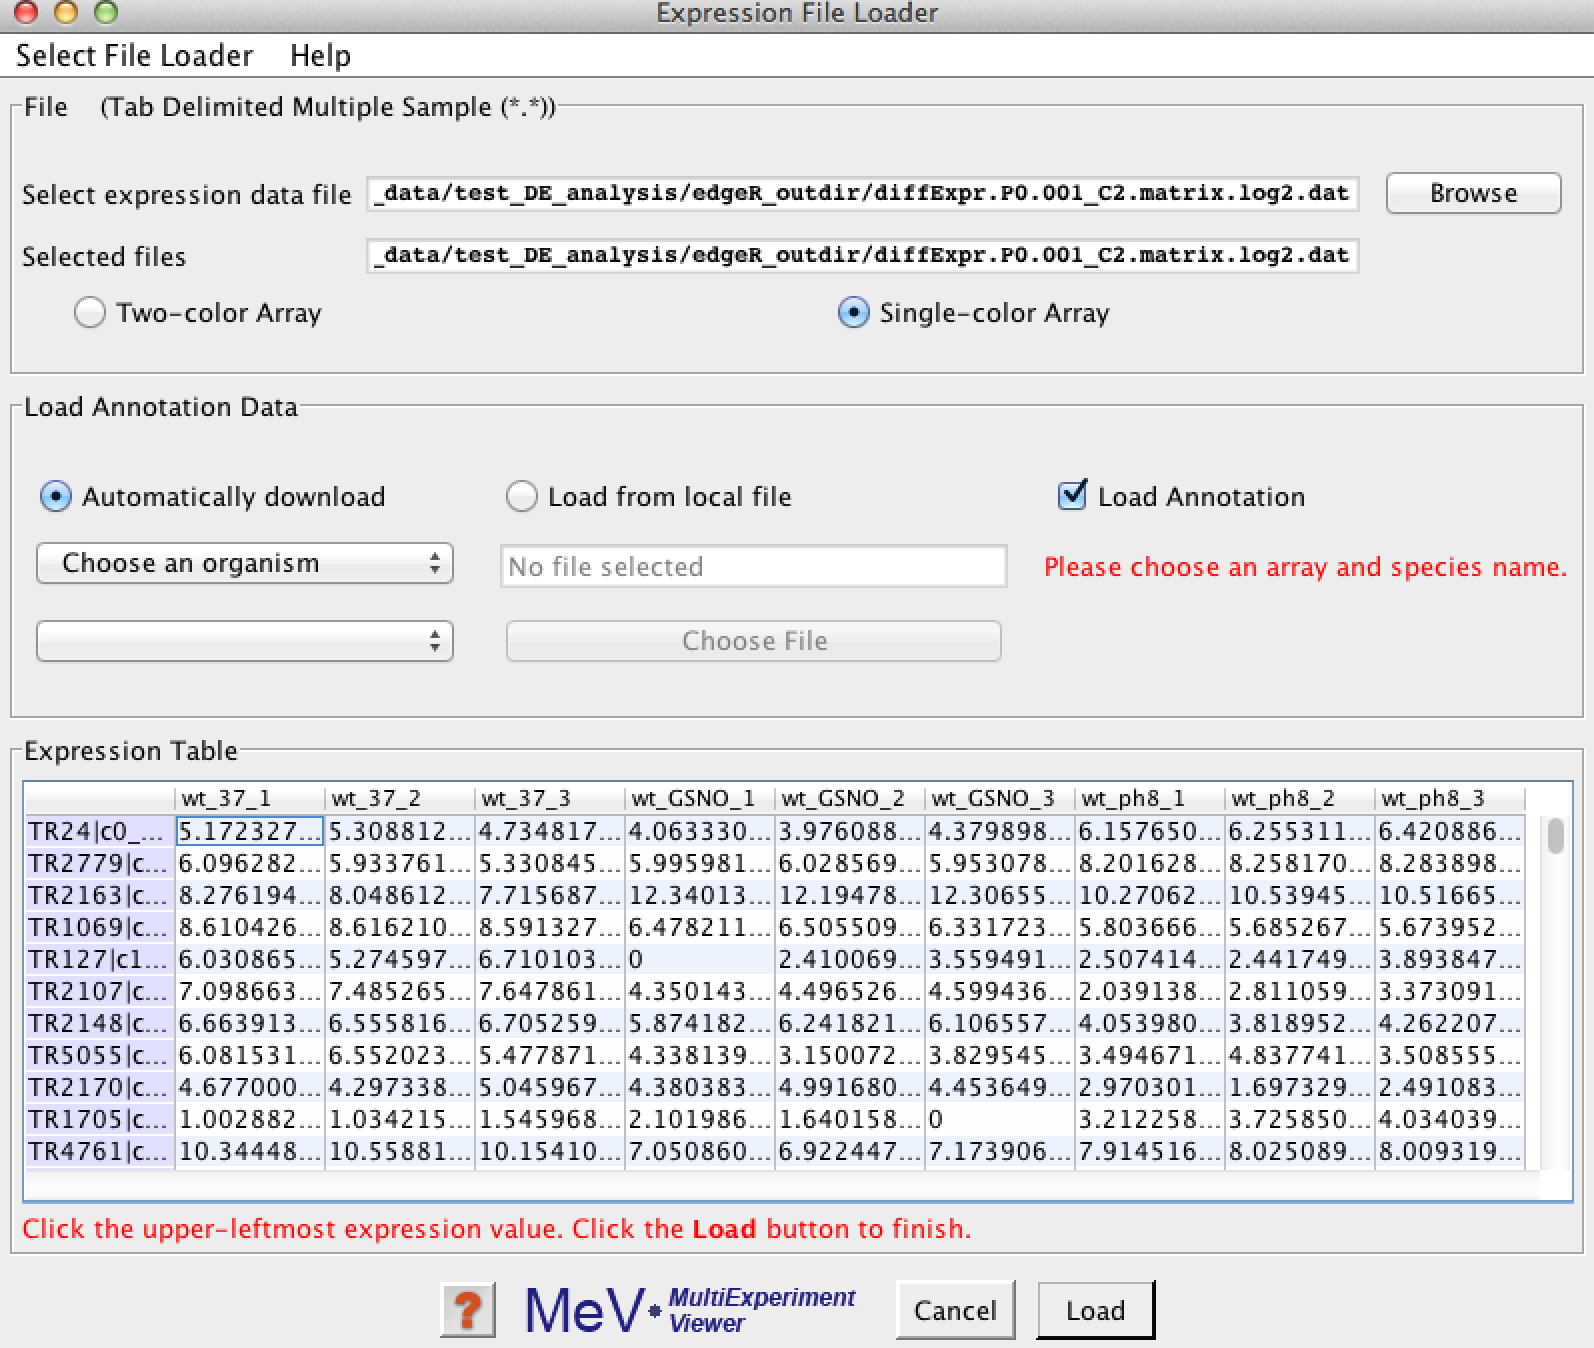
Click the first expression data point in the upper-left corner of the data table. You'll see its boundaries highlighted indicating that it was selected.
Click the 'Load' button, and this should present you with your initial data-loaded view in MeV:

The initial heatmap view might have the cells and/or the text labels smaller than you'd like. You can change this by visiting the menu option 'Display' -> 'Set Element Size' -> 'Custom'. I tend to set this to width of 20, and height of 10.

Before clustering the expression data, we might want to perform certain transformations. One common one is to log2-transform your expression data. Since we already loaded in data that was previously log-transformed, we don't need to do this here.
If you loaded in a data matrix that was not log-transformed, you can run the log2-transformation via menu option 'Adjust Data' -> 'Log Transformations' -> 'Log2 Transform'
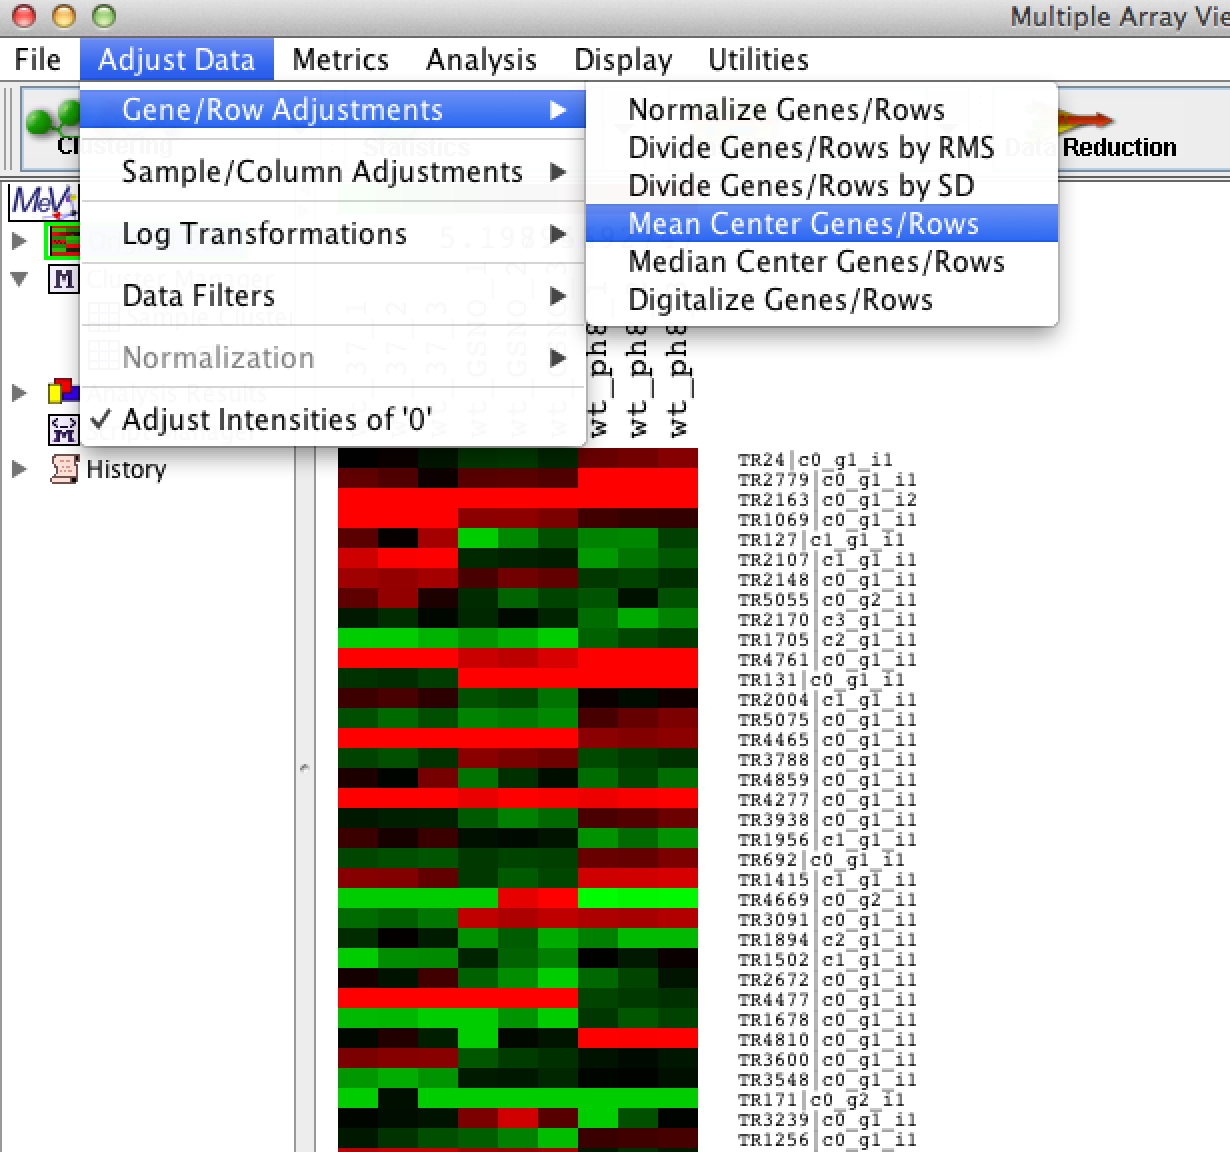
If you're interested in clustering based on expression patterns (and discounting within-gene or within-transcript expression intensities), then you should mean-center the data. This involves taking the mean expression value for each gene or transcript, and subtracting it from each expression value for that gene or transcript. The mean value will then be zero, and your upregulated or downregulated samples will have positive or negative values, respectively. Center-mean the data by using menu option: 'Adjust Data' -> 'Gene/Row Adjustments' -> 'Mean Center Genes/Rows' as shown below:
For whatever reason (wish I knew!), the main view doesn't update with a new view of the data, but no worries. You'll see the results of our manipulations once we start generating other heatmaps below.
Since we've centered the data, we'll want to update our color scale limits. Do this via the menu option: 'Display' -> 'Set Color Scale Limits'

which will provide the dialog below. Set the color scale range to have (-5, 0, 5) for the lower, mid, and upper limits, and then press the 'OK' button.
you may choose different limits based on the range of values in your data, but the mean-centering should have the mid set at zero.

Click the 'Clustering' button at top followed by the 'Hierarchical Clustering' option as shown:

You should see the dialog below. Select 'Euclidean Distance' for the distance metric (or experiment with other options) and then click 'OK'.

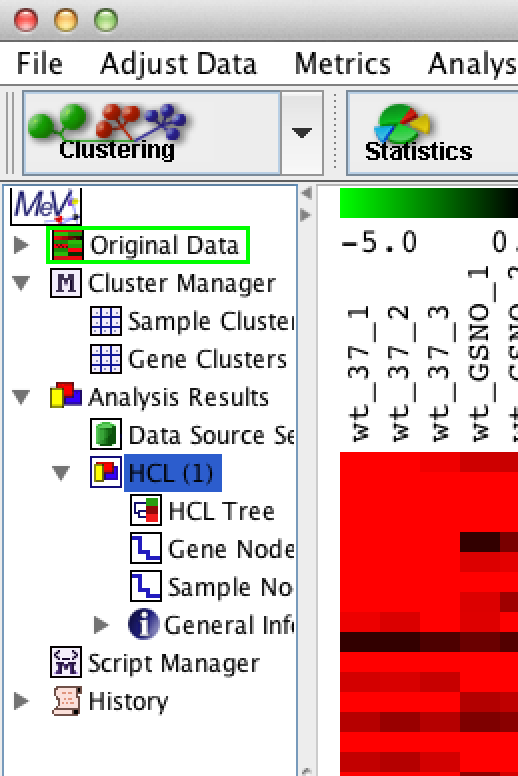
Clustering can usually happen very quickly. Once done, you'll see an "HCL" analysis show up in the analysis tracker on the left, as shown:
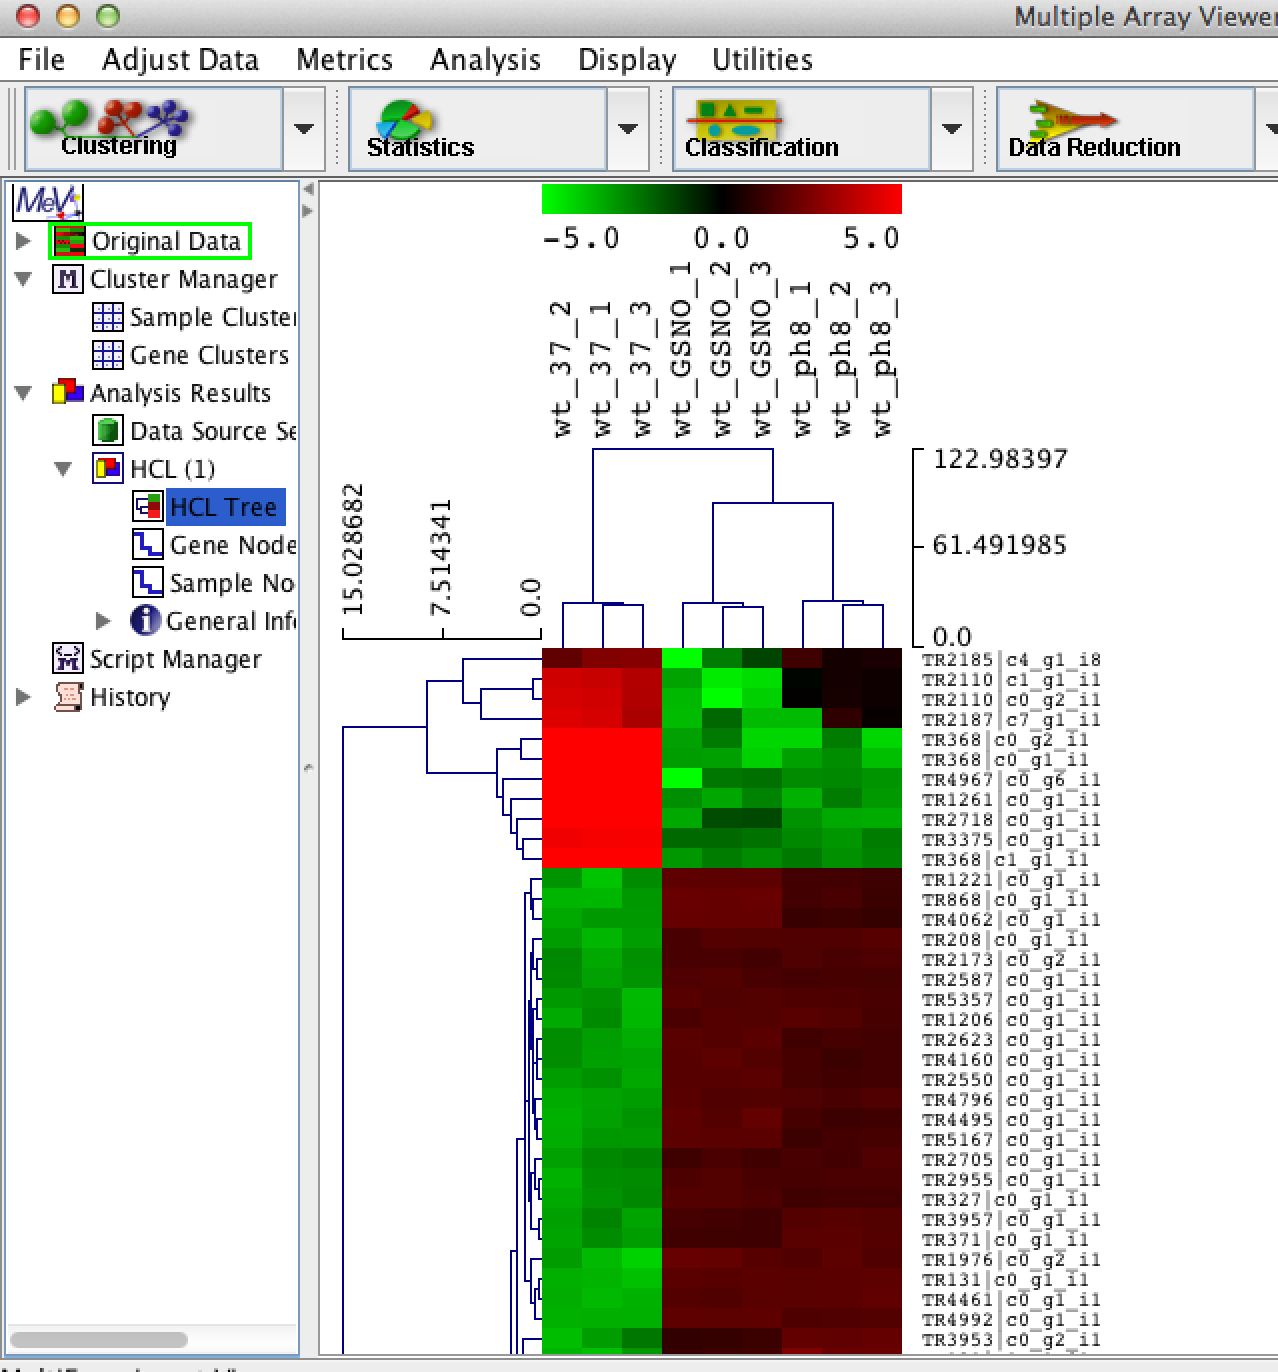
Click on the 'HCL Tree' analysis node and you should see your newly clustered heat map:
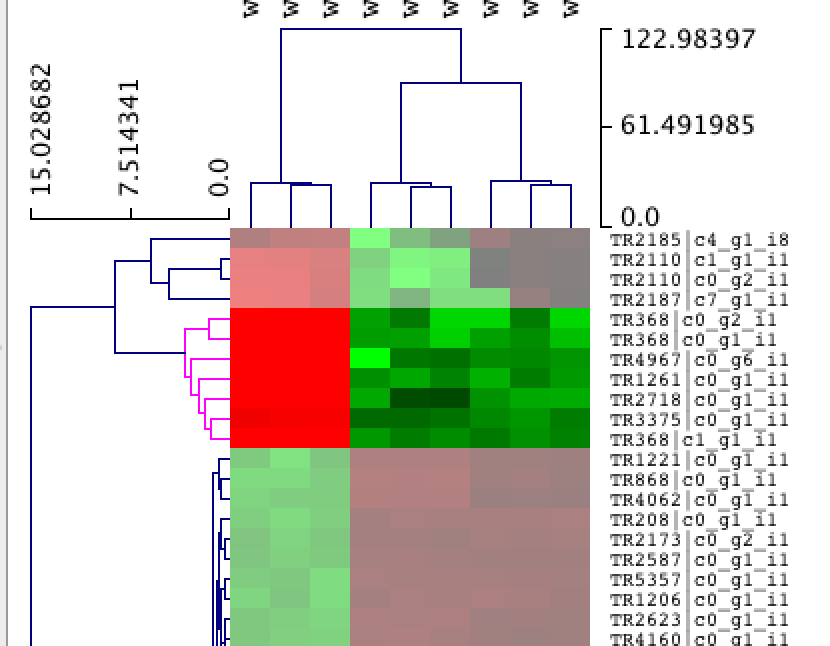
You can navigate the heatmap by scrolling up/down in the main viewer window. You can select clusters in the heatmap simply by clicking on regions in the hierarchical tree:
Now... explore MeV on your own. It's a tool with rich functionality. Visit the [MeV website] (http://www.tm4.org/mev.html) for full documentation and any MeV-specific user support.