Diagnostics
Here we discuss tools and techniques for diagnosing behavior in a \psi pipeline. We will be covering collecting and visualizing pipeline diagnostics information.
The graph structure of a pipeline, along with information about the state of each component and statistics regarding the flow of messages may be visualized and inspected in PsiStudio.
A global aggregate view is invaluable for understanding and spotting problems in a large system. This view can help not only to understand the structure but, as we will see, to understand the flow of data at a glance. Here we will use an example pipeline taken from the Azure Kinect Sample to illustrate the diagnostics system.
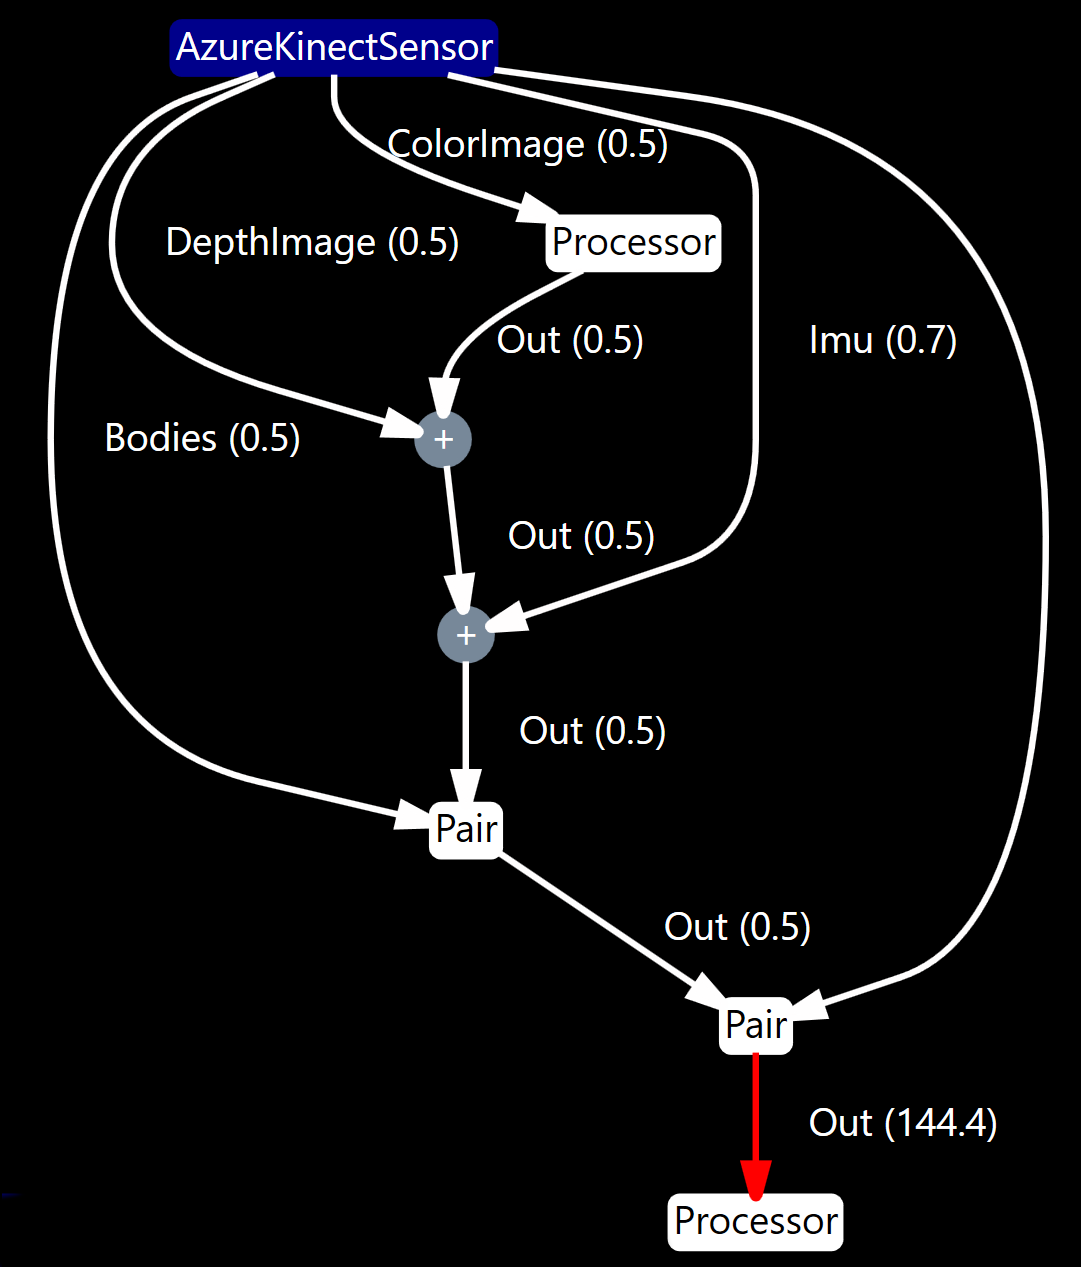
The code for the Azure Kinect Sample boils down to the below; creating the AzureKinectSensor component, applying Resize() to the ColorImage stream, and using Join and Pair to fuse several other sensor streams.
using (var pipeline = Pipeline.Create("AzureKinectSample", DeliveryPolicy.LatestMessage, ...)
{
    var azureKinect = new AzureKinectSensor(...);
    azureKinect.ColorImage.Resize(widthOutput, heightOutput)
        .Join(azureKinect.DepthImage)
        .Join(azureKinect.Imu, TimeSpan.FromMilliseconds(10))
        .Pair(azureKinect.Bodies)
        .Pair(azureKinect.DepthDeviceCalibrationInfo)
        .Do(message => ...);
    ...
}
The resulting graph looks like this:

With just a few lines of code, a graph of many nodes has been created. In general, if you are used to an actor model framework such as ROS, where nodes are quite coarse-grained, you may be surprised to see the number of components comprising a typical \psi application. Every .Select(...), .Where(...) and .Join(...) operation on a stream results in the creation of a new component. This more fine-grained approach in \psi leads to higher performance due to pipeline parallelism and tends to afford more modular, cohesive, loosely coupled systems.
Organizing the structure and naming components (i.e. the nodes in the graph) becomes increasingly important as a system grows. By default component names displayed are the type name (e.g. "AzureKinectSensor"). A component may however override ToString() to provide another name. Subsuming portions of the graph into composite components helps to organize the graph hierarchically.
If the nodes of the graph represent individual components and subpipelines, the edges represent stream connections from an emitter to a receiver. Source components (sensors, etc.) are shown in green and hierarchically organized aggregate components are shown in blue. Drilling into the subpipeline encapsulated by such a component is done by double-clicking on the hierarchical component, and a few buttons at the top of the visualization panel allow for breadcrumb hierarchical navigation.
Several simplifications are done by default to the rendered graph to unclutter the view. First, very common components such as those corresponding to the Join operator, or to Connectors, are minimized to small circled icons (the Join operator is represented with a '+' sigh, whereas Connectors are '☍'). You may hover over these components with the mouse (as with all nodes) to see the complete name and type. Another simplification relates to cases where streams are logged to disk. In \psi, when the Write(...) operator is applied to a stream to persist it to a store, in effect a connection is formed to an Exporter component corresponding to that store. When multiple streams are logged, all of these links would clutter the view and therefore, by default, these links are hidden.
They may be shown by checking the "Show Exporter Links" checkbox in Properties. Other visual properties such as colors, edge thickness and the direction of the graph layout (e.g. top-to-bottom, left-to-right, ...), may also be changed in the property panel for the visualizer.
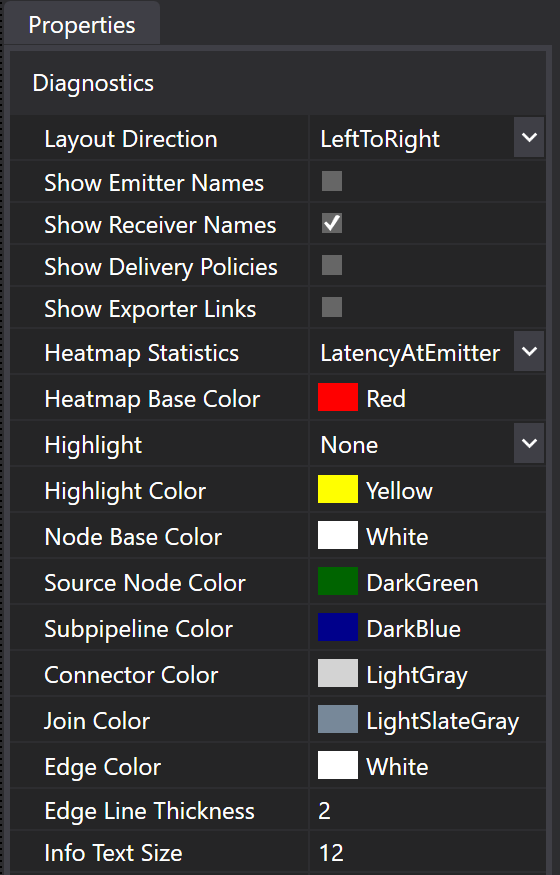
Edges, by default, show the receiver name along with chosen statistical values such as latency or queue size. Checkboxes on the property panel for the visualizer (shown above) allow adding the emitter name and/or delivery policy to the label. Edges spanning levels of the hierarchy, bridging connectors across subpipelines, are shown as dotted lines.
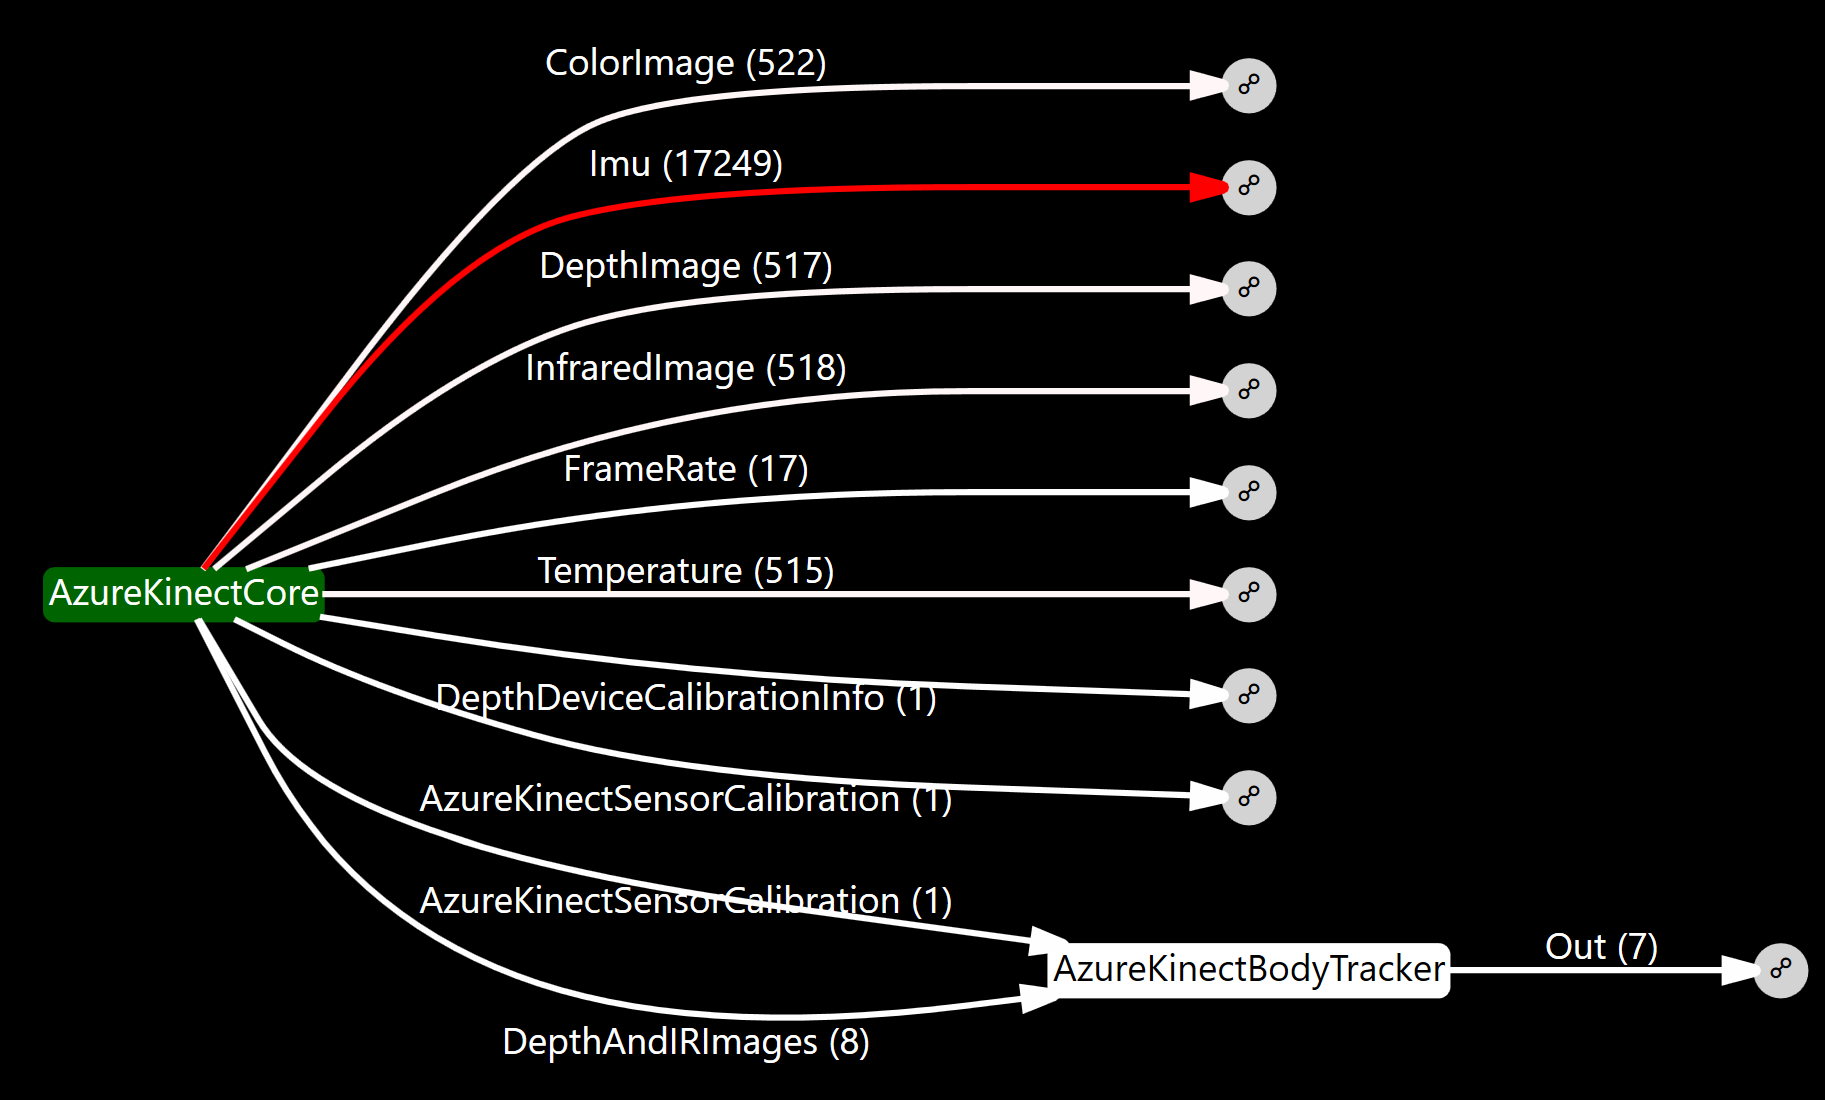
Here we show a subpipeline graph; having double-clicked the AzureKinectSensor in the first graph.
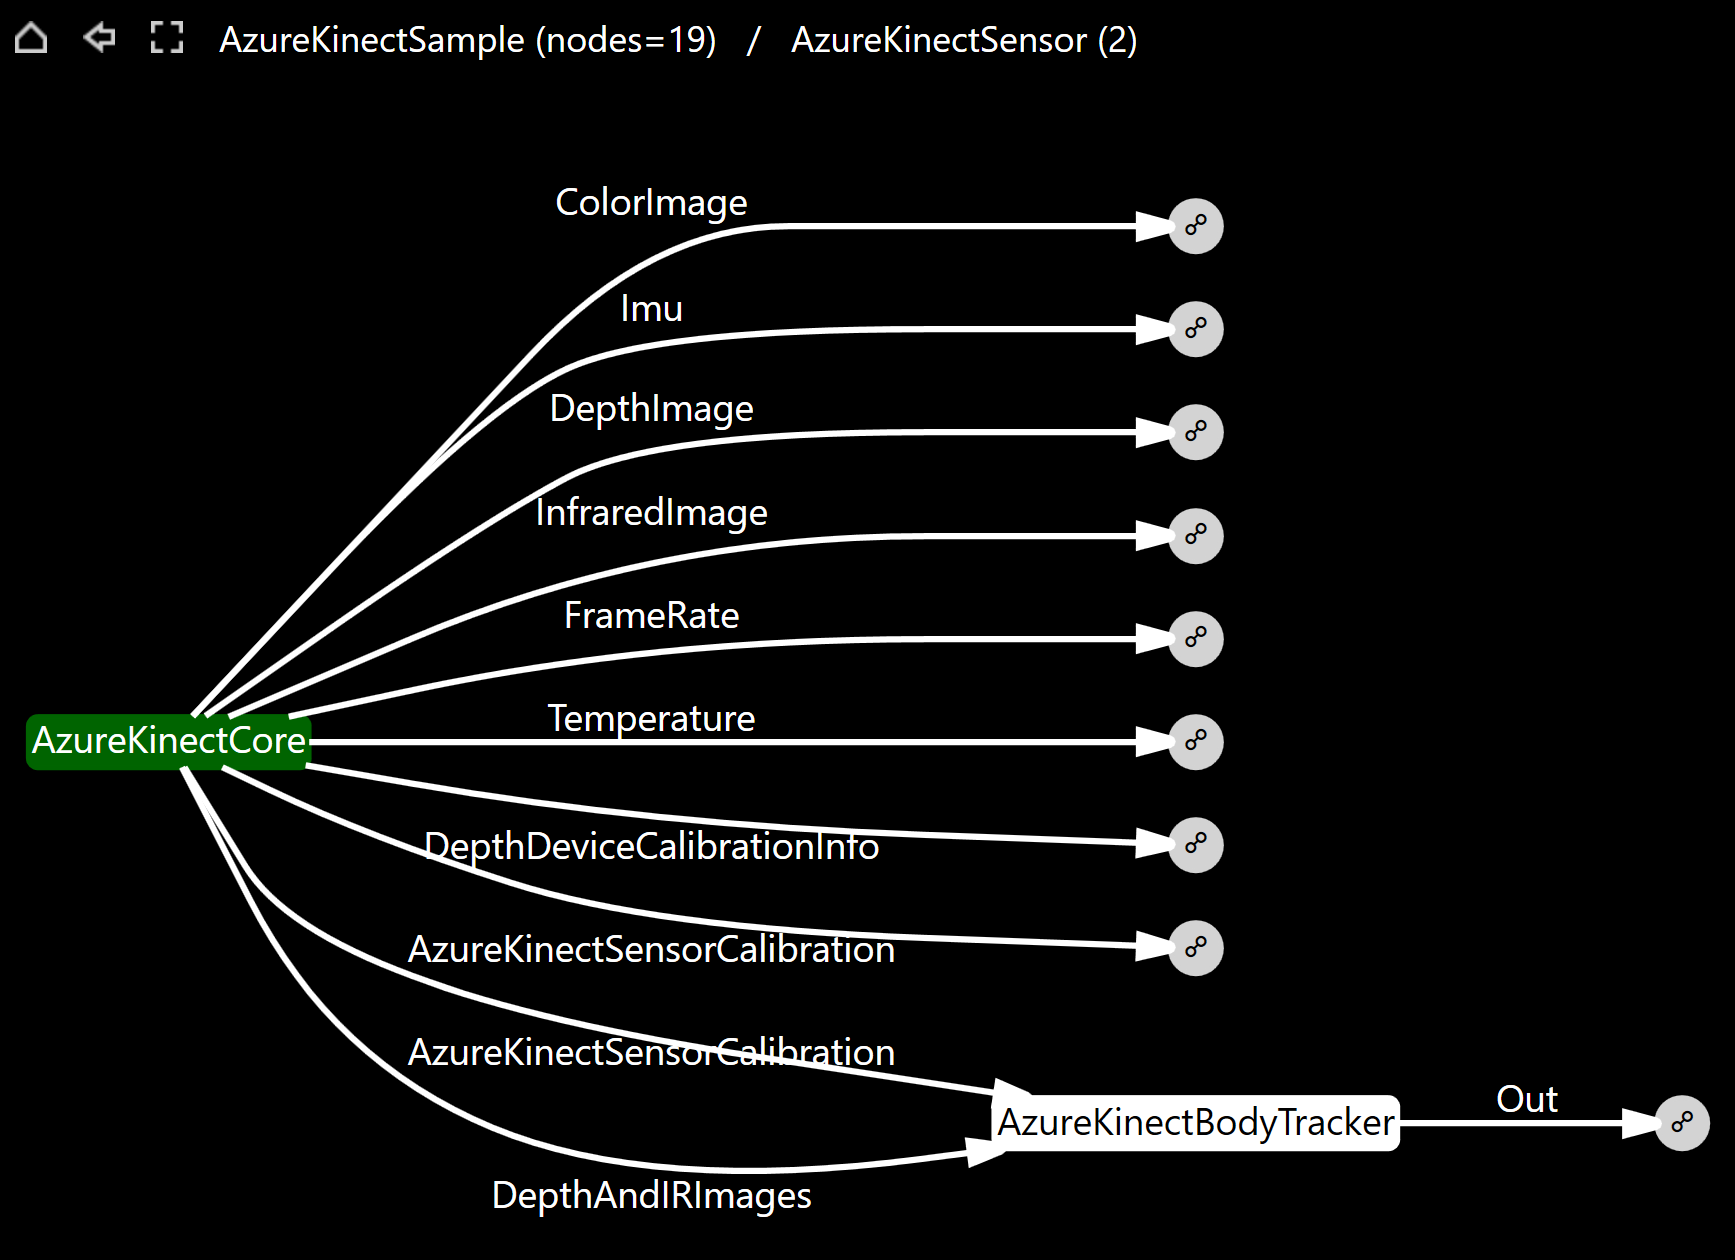
We can see that the AzureKinectSensor component aggregates two other components; an AzureKinectCore source component and an AzureKinectBodyTracker. Notice also the "breadcrumb" navigation bar at the top. This displays the hierarchy and allows jumping back up with a click. Alternatively, the Back arrow walks up the hierarchy and the Home icon returns to the root pipeline. You can pan around the graph view with the mouse and zoom in/out with the mouse wheel. The third icon to the right of the Back arrow returns to a view fitting the graph within the available screen real estate.
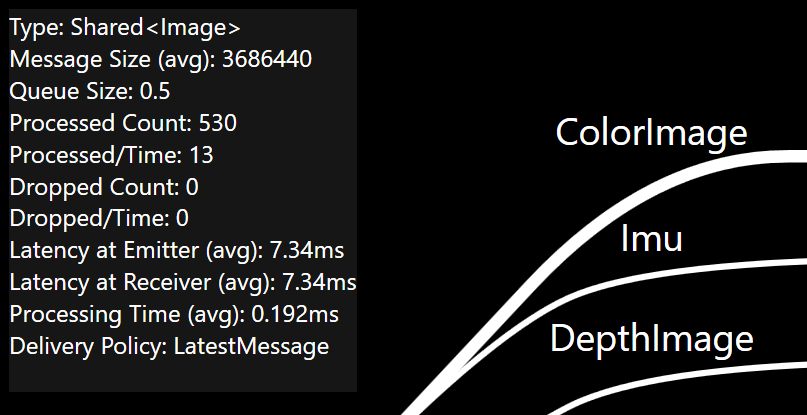
Selecting an edge (e.g. ColorImage) shows an information panel in the upper left of the visualization area. Clicking the edge again or clicking the info panel itself hides it. The info panel displays the following pieces of information:
- Type: Message type name.
- Message Size (avg): Average message size in bytes (disabled by default; see below).
- Queue Size: Instantaneous count of queued messages.
- Processed Count: Instantaneous total count of processed messages.
- Processed/Time: Count of messages processed per unit time (1 second by default).
- Dropped Count: Instantaneous total count of dropped messages.
- Dropped/Time: Count of dropped messages per unit time (1 second by default).
- Latency at Emitter (avg): Average message latency at the point of emission.
- Latency at Receiver (avg): Average message latency at the point of receiving.
- Processing Time (avg): Average processing time consumed in order to produce messages.
- Delivery Policy: Delivery policy applied to the receiver.
Please note that the Latency at Emitter (avg) and Latency at Receiver (avg) statistics listed above capture the message latency, e.g. CreationTime minus OriginatingTime, for the messages that are emitted (or received). This is not the same as the latency at the time point the message is actually emitted or received (which would be CurrentTime minus OriginatingTime). We plan to add additional statistics to capture this information in a future release.
Note: Message Size is not collected by default (see below, Configuring the Diagnostics Stream).
Some of the statistics are instantaneous such as queue size and total processed and dropped message counts. Others are collected over time, including counts of processed and dropped messages per unit time and the averages such as latency and processing time. The time span over which they are aggregated is configurable with the AveragingTimeSpan setting (covered below).
Values displayed in the information panel update as time is navigated in PsiStudio (or in Live Mode). This allows for quickly gaining an understanding of the behavior of message flow over the life of the application.
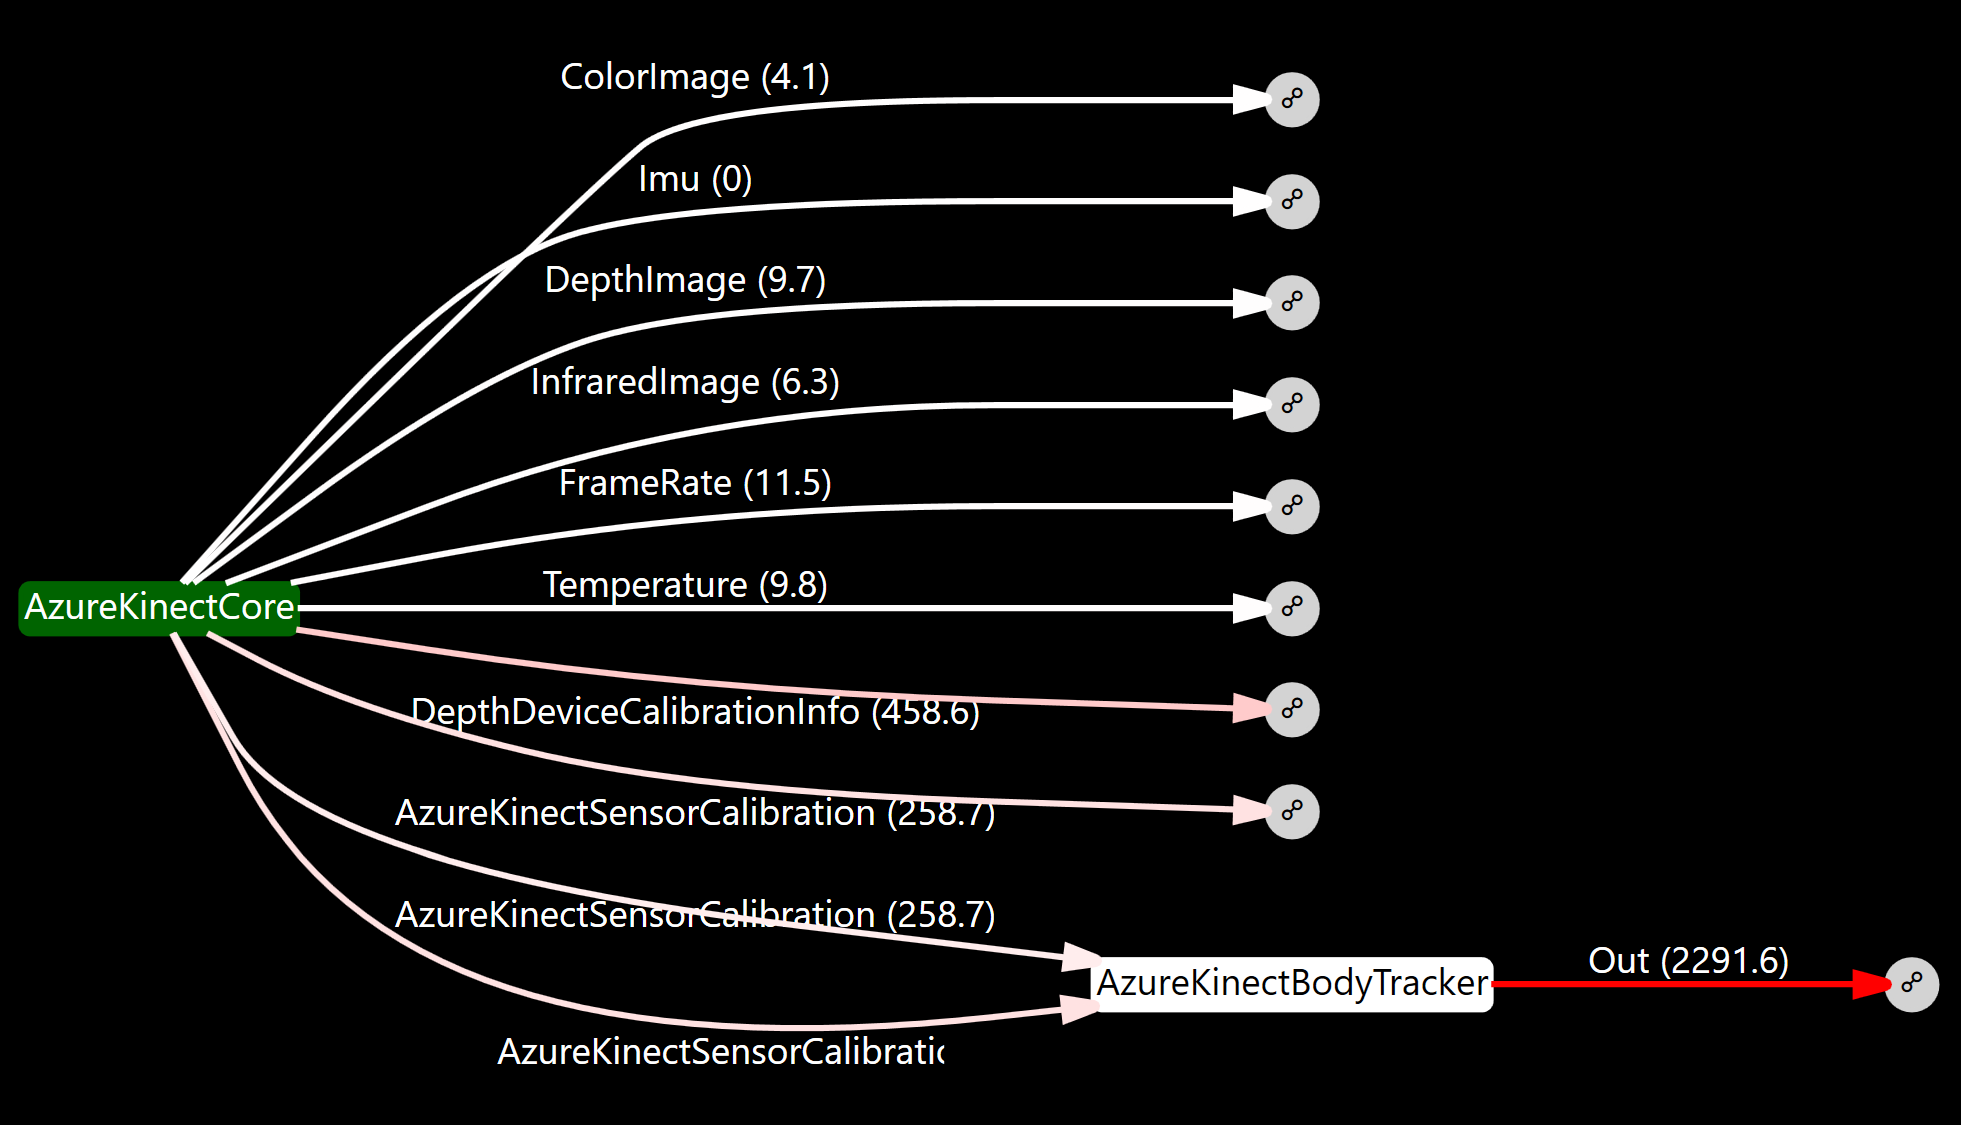
Where diagnostics really shines is in giving insight into system wide behavior at a glance. The graph may be highlighted in a colored heatmap based on the statistics.
Highlighting latencies in this example pipeline, we can quickly see by the edges colored in red that the majority of the latency (~2.2s) in this particular example system is downstream from the AzureKinectBodyTracker component.
Highlighting processing time clearly shows that indeed the AzureKinectBodyTracker consumes the majority of time.

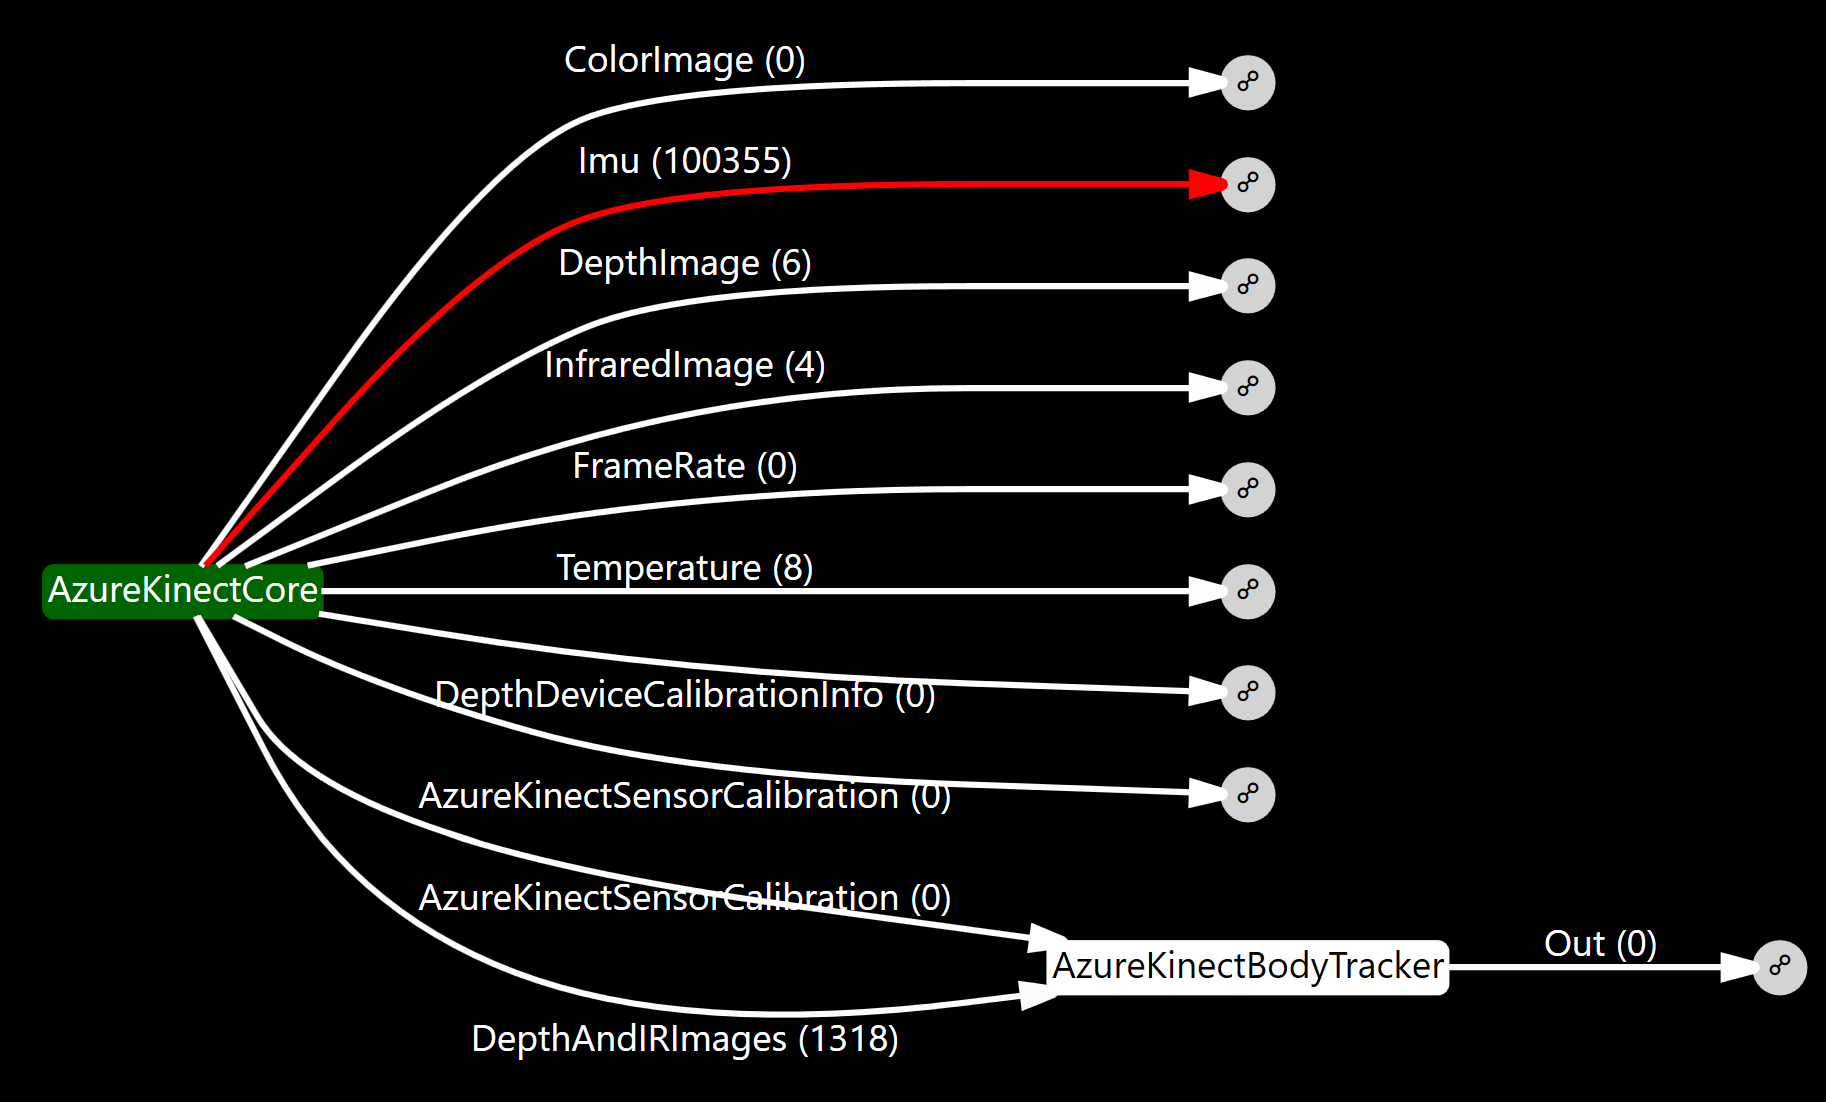
Highlighting throughput shows a large volume of messages emanating from the Imu stream because of its high sample rate relative to the image frames (~30×).
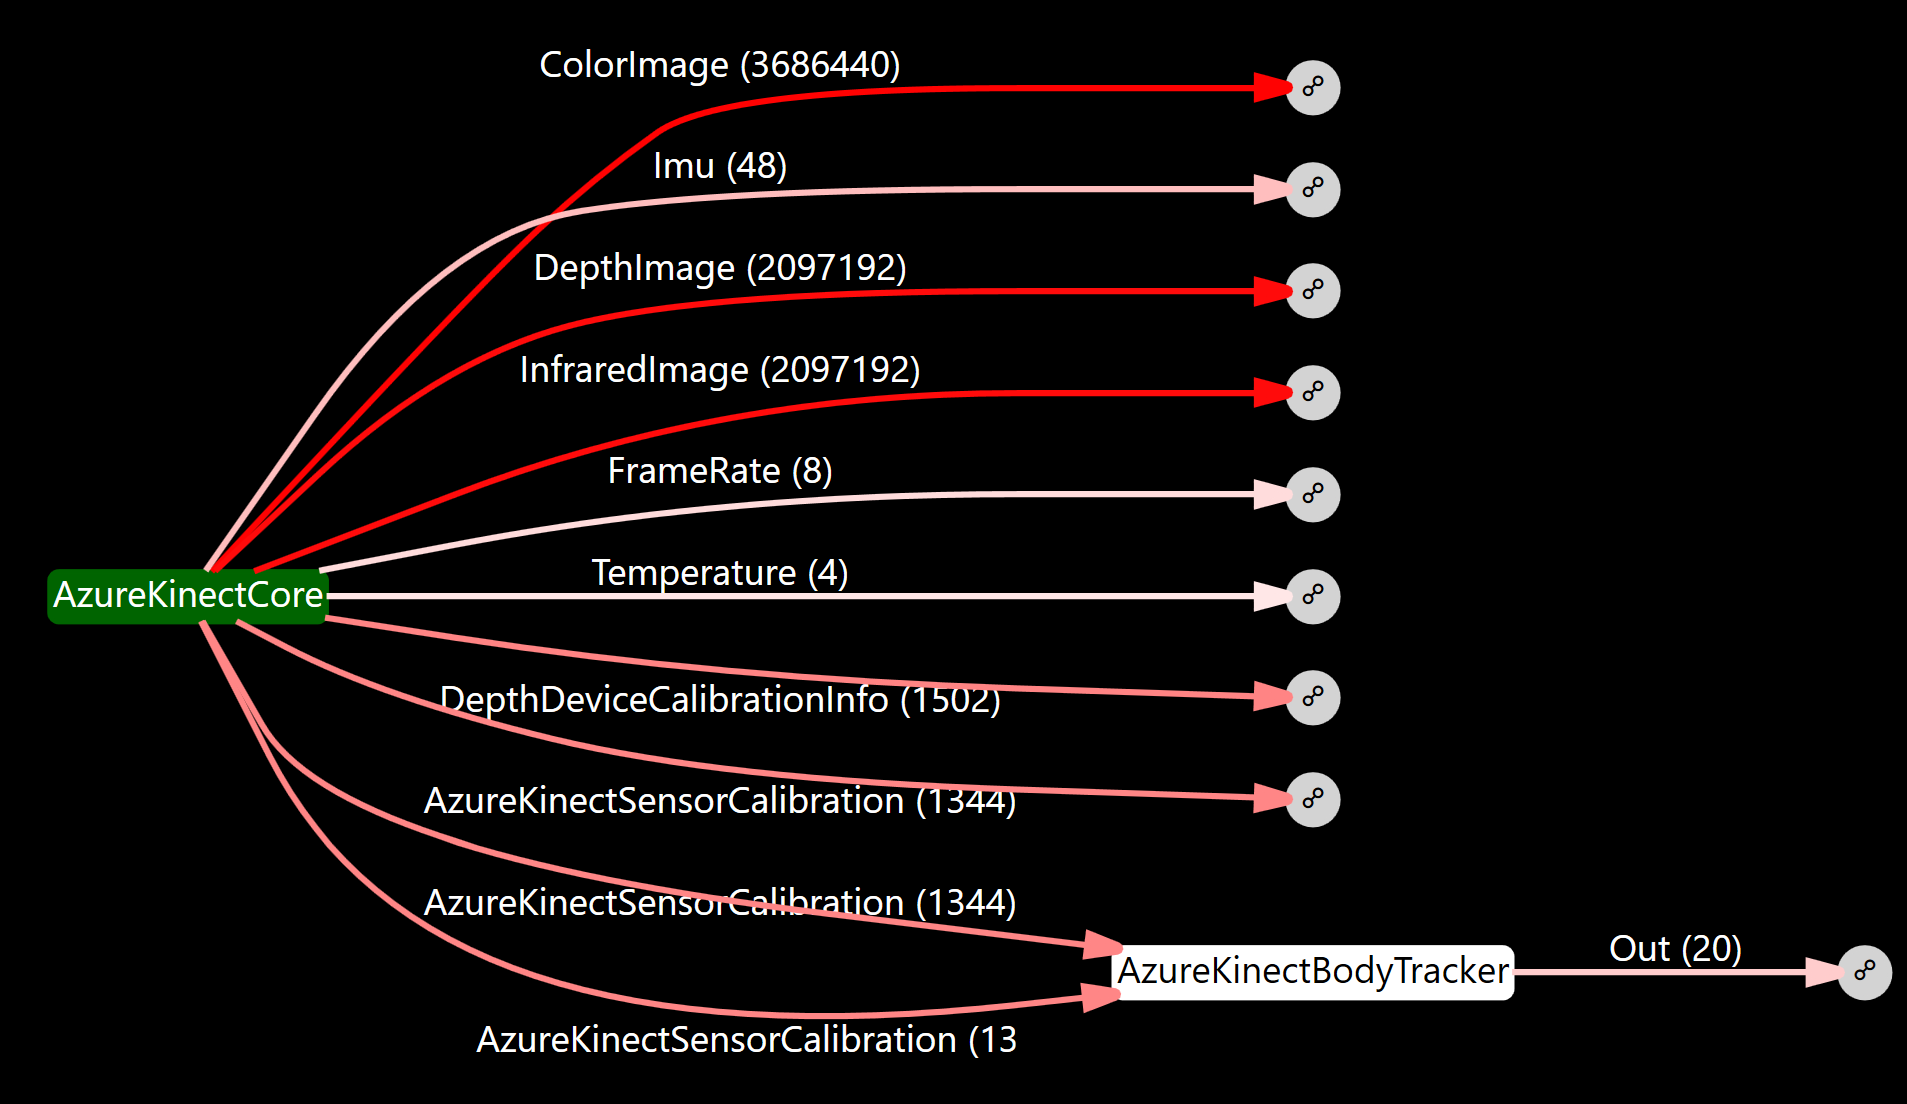
However, highlighting message size, we can see that the Color, Depth and Infrared image streams are producing by far the largest messages (2—3.5MB). Note again that Message Size is not collected by default (see below, Configuring the Diagnostics Stream).
Visualizing the Dropped Count heatmap, we can verify that the excess messages are not queuing and are instead being dropped as expected because the Delivery Policy used in the sample code. Tuning delivery policies to control dropping vs. queueing is an important aspect of designing a well behaved pipeline.
The ability to quickly see such statistics across the whole graph is extremely useful when diagnosing a \psi system. Other techniques we will cover, such as performance counters, may expose more granular information but nothing else will give such a whole-system overview at a glance.
As an example of using the diagnostics system to pinpoint issues in an application, let's again use the Azure Kinect Sample. As we walk through this sample we see that a series of Joins and Pairs are used to fuse the sensor streams and a final Do is used to process the results. Suppose the code had been written as:
azureKinect.ColorImage.Resize(widthOutput, heightOutput)
.Join(azureKinect.DepthImage)
.Join(azureKinect.Imu)
.Pair(azureKinect.Bodies)
.Pair(azureKinect.DepthDeviceCalibrationInfo)
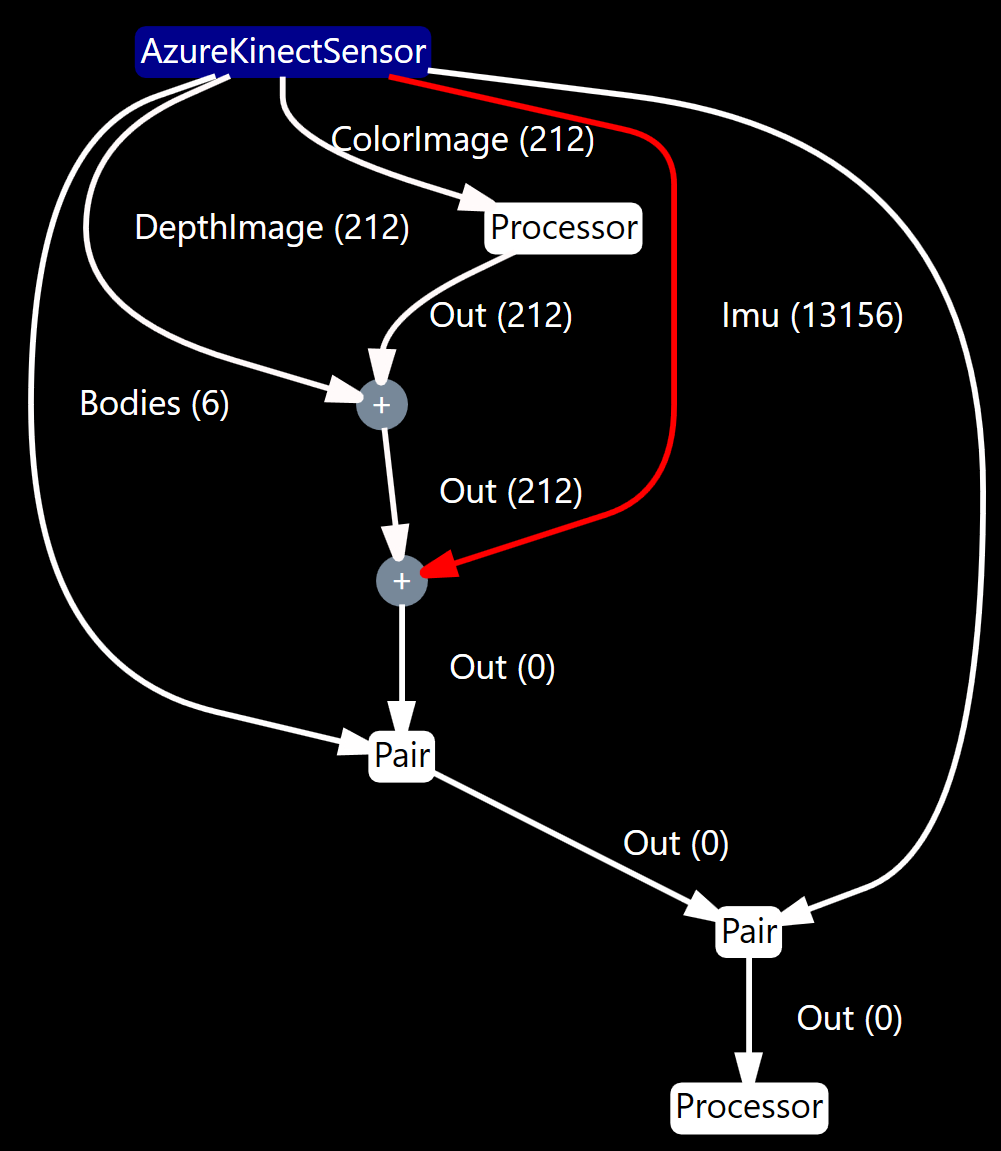
.Do(message => ...);In this case, the behavior would not be what we expect. We observe that the Do(...) (Processor) is not receiving any messages. This can clearly be seen in the diagnostics throughput heatmap. The final Join (+) at the bottom is receiving messages from the previous Join (+) and from the Imu stream, but no fused messages are coming out.
The problem is that the Join of the Imu stream is too restrictive; by default matching exactly identical originating times. This is the default behavior of Join as explained in more detail in the Stream Fusion and Merging topic.
The ColorImage and DepthImage streams successfully join, but the IMU operates on a different cadence to the image streams and the odds of the messages aligning exactly to the tick are very low. Using a small 10ms window, the Join begins to work.
.Join(azureKinect.Imu, TimeSpan.FromMilliseconds(10))A second problem then is that messages are queuing at the final Do(...) (Processor) and are causing the application to fall increasingly further behind real time. This is quite apparent to a user of the application and can be seen easily in the diagnostics Queue Size heatmap.
Changing to a LatestMessage delivery policy allows messages to drop and enables the application to keep up.
.Do(message => ..., DeliveryPolicy.LatestMessage);Collecting diagnostics information for display in PsiStudio is a matter of enabling a special stream emanating directly from the pipeline. Each PipelineDiagnostics message of this stream contains information about the structure of the pipeline, the state of each component and statistics about the flow of messages. To visualize in PsiStudio, this stream must be written to a store and that store opened in PsiStudio.
using (var pipeline = Pipeline.Create(enableDiagnostics: true))
{
    var store = PsiStore.Create(pipeline, "Demo", @"C:\Data\Demo");
    pipeline.Diagnostics.Write("Diagnostics", store);

    ...
}
Various aspects of diagnostics can be configured when creating the Pipeline.
var config = new DiagnosticsConfiguration()
{
    TrackMessageSize = true,
    AveragingTimeSpan = TimeSpan.FromSeconds(2),
    SamplingInterval = TimeSpan.FromSeconds(10),
    IncludeStoppedPipelines = true,
    IncludeStoppedPipelineElements = true,
};

using (var pipeline = Pipeline.Create(
    enableDiagnostics: true,
    diagnosticsConfiguration: config))
{
    ...
}
Message size is not collected by default because doing so noticeably affects performance due to an extra serialization of each message in order to count the bytes. To see Message size statistics, TrackMessageSize must be enabled. The default is false.
We also mentioned above that the time span over which some of the statistics are aggregated may be specified by the AveragingTimeSpan setting. The default is 1 second.
When enabled, diagnostics information is updated continuously while the pipeline is active. However, the size of each PipelineDiagnostics message and the extremely high frequency at which changes are observed make it impractical to emit messages for every change. Instead, the SamplingInterval determines the rate of PipelineDiagnostics messages. The default is 100 milliseconds.
Finally, information may be maintained about the state of components and subpipelines even when they are inactive. This can be occasionally useful when diagnosing shutdown and finalization issues. The default is false for IncludeStoppedPipelines and IncludeStoppedPipelineElements.
Aside from visualizing in PsiStudio, the Diagnostics stream may be inspected programmatically to watch for anomalies in a system; "watchdog" code monitoring a system's health.
The following extension methods are available in the Microsoft.Psi.Diagnostics namespace.
Query pipeline structure:
-
GetPipelineCount- Gets count of pipelines. -
GetPipelineElementCount- Gets count of pipeline elements. -
GetEmitterCount- Gets emitter count within pipeline and descendant. -
GetReceiverCount- Gets receiver count within pipeline and descendant.
Gather aggregated and instantaneous statistics:
-
GetAverageQueuedMessageCount- Gets queued receiver count within pipeline and descendant. -
GetDroppedMessageCount- Gets dropped message count across receivers within pipeline and descendant. -
GetDroppedMessageAveragePerTimeSpan- Gets dropped message count in last averaging time span across receivers within pipeline and descendant. -
GetProcessedMessageCount- Gets processed message count across receivers within pipeline and descendant. -
GetProcessedMessageAveragePerTimeSpan- Gets processed message count in last averaging time span across receivers within pipeline and descendant. -
GetThrottledReceiverCount- Gets throttled receiver count across receivers within pipeline and descendant.
Inspect individual pipeline, element, emitter and receiver diagnostics:
-
GetAllPipelineDiagnostics- Gets all pipeline diagnostics (including descendant subpipelines). -
GetAllPipelineElements- Gets all pipeline element diagnostics within a collection of pipeline diagnostics. -
GetAllPipelineElementDiagnostics- Gets all pipeline element diagnostics within a pipeline diagnostics (and all descendant subpipelines). -
GetAllEmitterDiagnostics- Gets all emitter diagnostics within a collection of pipeline or element diagnostics (and all descendant subpipelines). -
GetAllReceiverDiagnostics- Collection of all receiver diagnostics within a collection of pipeline or element diagnostics (and all descendant subpipelines).
Helpers:
-
AverageTime- Compute average time from a sequence of time spans (e.g. ProcessingTimeHistory). -
AverageSize- Compute average size from a sequence of sizes (e.g. QueueSize).
The information available on the Diagnostics stream and returned by the above extension methods exposes everything that is known by the diagnostics system. It is the same information that is used in the PsiStudio visualization.
The root is a PipelineDiagnostics representing diagnostics information about the pipeline producing the Diagnostics stream. It is a summarized snapshot of the graph with aggregated message statistics. The PipelineDiagnostics class contains:
-
Id- Pipeline ID. -
Name- Pipeline name. -
IsPipelineRunning- A value indicating whether the pipeline is running (after started, before stopped). -
PipelineElements- Elements in this pipeline. -
ParentPipelineDiagnostics- Parent pipeline of this pipeline (it any). -
SubpipelineDiagnostics- Subpipelines of this pipeline. -
AncestorPipelines- Ancestor pipeline diagnostics. -
DescendantPipelines-Descendant pipeline diagnostics.
The child SubpipelineDiagnostics (and ParentPipelineDiagnostics) may be walked to explore the structure of hierarchical pipelines. Helper properties also allow traversal of all Ancestor/DescendantPipelines. Components within each pipeline may be enumerated with the PipelineElements property; a collection of PipelineElementDiagnostics instances, discussed next.
The PipelineElementDiagnostics class represents diagnostic information about an individual component, containing:
-
Id- Pipeline element ID. -
Name- Pipeline element name. -
TypeName- Pipeline element component type name. -
Kind- Pipeline element kind. -
IsRunning- A value indicating whether the pipeline element is running (after started, before stopped). -
Finalized- A value indicating whether the pipeline element is finalized. -
Emitters- Pipeline element emitters. -
Receivers- Pipeline element receivers. -
PipelineId- ID of pipeline to which this element belongs. -
RepresentsSubpipeline- Pipeline which this element represents (e.g. Subpipeline). -
ConnectorBridgeToPipelineElement- Bridge to pipeline element in another pipeline (e.g. Connectors).
Subpipelines are, in fact, represented as components in their parent pipelines. These components (PipelineElementDiagnostics) are associated with the pipeline that they encapsulate by way of the RepresentsSubpipeline property; a PipelineDiagnostics instance.
The ConnectorBridgeToPipelineElement property deserves some explanation and involves some unique pipeline mechanics. Connectors are components and may span pipelines. That is, they may connect components in their pipeline to components in another pipeline. This is accomplished under the covers by a pair of connector components; one in the first pipeline bridged to another in the second pipeline. One connector will have receivers but no emitters, while the other will have emitters but no receivers. Messages passed to one "magically" emit from the other: a behavior unique to this component. Such pipeline-spanning connector components will have their ConnectorBridgeToPipelineElement populated with the connector from another pipeline.
The EmitterDiagnostics class represents diagnostic information about an emitter on an individual component, containing:
-
Id- Gets emitter ID. -
Name- Gets emitter name. -
Type- Gets emitter type. -
PipelineElement- Gets pipeline element to which emitter belongs. -
Targets- Gets emitter target receivers (ReceiverDiagnostics)
The ReceiverDiagnostics class represents diagnostic information about a receiver on an individual component and is where we find all of the statistics about message flow in the system:
-
Id- Gets receiver ID. -
ReceiverName- Gets receiver name. -
DeliveryPolicyName- Gets name of delivery policy used by receiver. -
TypeName- Gets receiver type. -
Throttled- Gets a value indicating whether receiver is throttled. -
QueueSize- Gets average awaiting delivery queue size. -
ProcessedCount- Gets total count of processed messages. -
ProcessedPerTimeSpan- Gets count of processed messages in last averaging-timespan window. -
DroppedCount- Gets total count of dropped messages. -
DroppedPerTimeSpan- Gets count of dropped messages in last averaging time span window. -
MessageLatencyAtEmitter- Gets message latency at emitter (when queued/dropped) over past n-messages. -
MessageLatencyAtReceiver- Gets message latency at receiver (when delivered/processed) over past n-messages. -
ProcessingTime- Gets component processing time over the past n-messages. -
MessageSize- Gets average message size over the past n-messages (if TrackMessageSize configured). -
PipelineElement- Gets pipeline element to which emitter belongs. -
Source- Gets receiver's source emitter.