Intel Trace Analyzer and Collector

- https://software.intel.com/en-us/intel-trace-analyzer/documentation
- https://software.intel.com/en-us/itc-user-and-reference-guide-user-guide
- http://www.prace-ri.eu/IMG/pdf/WP237.pdf
- https://software.intel.com/en-us/intel-trace-analyzer-support/training
- https://scc.ustc.edu.cn/zlsc/tc4600/intel/2017.0.098/itac/FAQ.pdf
similar tools
Below we consider the case when a user/developer would like to manually measure non-MPI timing of certain regions of the deal.II library and/or user code. This necessitates extra include and link flags.
If you are using a cluster that uses modules, you should set appropriate environment variables by loading the respective modules. This might look like:
module load intel64/18.0up02 itac/2018up02 cmake git
This might already initialize the variables for Intel Trace Analyzer and Collector (ITAC) correctly.
Otherwise, set the repective environment variables explicitly:
source <INTEL_INSTALL_DIR>/parallel_studio_xe_<VERSION>.x.xxx/bin/psxevars.sh
cmake ../ -DCMAKE_CXX_FLAGS:STRING="-g -trace -O2 -march=native" -DDEAL_II_LINKER_FLAGS="-trace" -DDEAL_II_INCLUDE_DIRS="$ITC_INC" -DDEAL_II_USER_INCLUDE_DIRS="$ITC_INC" -DDEAL_II_DEFINITIONS="USE_VT" -DDEAL_II_USER_DEFINITIONS="USE_VT"
where ITC_INC is environment variable with ITAC include directory, i.e. /apps/intel/ComposerXE2018/itac/2018.2.020/include.
Notes:
- Avoid specifying MPI libraries manually, this ruins link sequence set up by compiler flag
–trace.
Now you can add timers to required parts of the library
#ifdef USE_VT
#include <VT.h>
#endif
...
#ifdef USE_VT
  VT_Region region("my_name", “my_group", __FILE__, __LINE__);
#endif
<some-function>
#ifdef USE_VT
  region.end();
#endif
Finally build the library
make all -j20
Configure the user project/library as usual
cmake ../ -DDEAL_II_DIR=/path/to/dealii
Similar to the above, you can manually add timers to certain parts of the project and then build it
make all -j20
# Log file
LOGFILE-NAME my_trace.stf
LOGFILE-FORMAT STF
# disable all MPI activity
ACTIVITY MPI OFF
# enable all bcasts, recvs and sends
SYMBOL MPI_WAITALL ON
SYMBOL MPI_IRECV ON
SYMBOL MPI_ISEND ON
SYMBOL MPI_BARRIER ON
SYMBOL MPI_ALLREDUCE ON
# enable all activities in the Application class
ACTIVITY Application ON
#
STATE Application:* UNFOLD
STATE lib*:* FOLD
STATE libdeal*:* UNFOLD
qsub -l nodes=1:ppn=40,walltime=01:00:00 -I
module load intel64/18.0up02 itac/2018up02
export VT_CONFIG=/path/to/trace.conf
mpirun -trace -np 20 my_executable
You should see at the end:
[0] Intel(R) Trace Collector INFO: Writing tracefile….
$ module load itac/2018up02
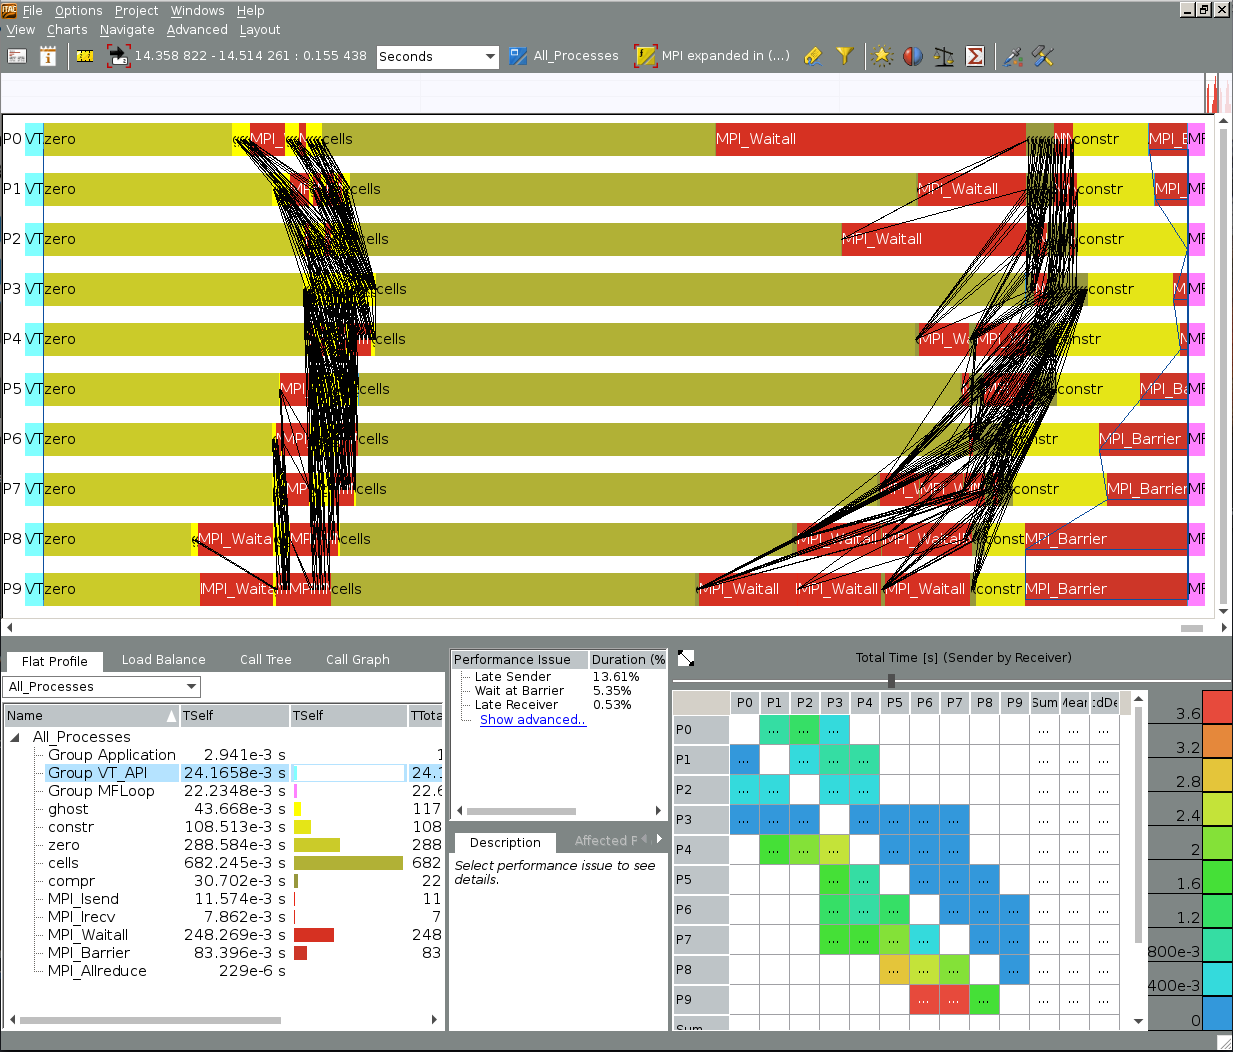
$ traceanalyzer my_trace.stf