Gallery
This page is a collection of images put here for mainly aesthetic reasons, and a little bit in order to show what can be done with deal.II. Most of the pictures also contain a brief summary of what they show, in order to give an idea of the kind of problem they are meant to solve.
Feel free to add your own pictures here, but please add the name of the person who did the simulation -- others may be so excited by it that they would want to contact you!

Finite element simulation with an invariant-domain preserving convex limiting scheme (9.5M gridoints). The corresponding first-order method is discussed in step-69. There are also videos available of the 2D computation and a corresponding 3D simulation with 1.8 billion gridpoints (click on the pictures below):


(Author: Matthias Maier, 10 April 2020)

High-Reynolds number computations lead to instationary solutions that are, however, often enormously important in practice. This picture is by Manuel Quezada de Luna (Texas A&M University) and was taken from a simulation of flow between the blades of a compressor or turbine.


These pictures are from a semester project by Yuhan Zhou at Texas A&M University. The goal was to compute parasitic conducivities and impedances from multilayer chip layouts. Other than generating data, this project also produced a number of pretty pictures!
 |
The image shows results obtained with a variant of step-22 and step-31, tutorial programs that compute thermally driven convection with Stokes flow. The image shows three non-equidistantly spaced heat sources at the bottom and the flow field that emanates from the rising plumes of hot air.
The flow pattern becomes unstable at various times switching from one configuration to another. The full dynamics only really become visible when watching these images as a movie. Several movies of various configurations are posted on Wolfgang Bangerth's webpage https://www.math.colostate.edu/~bangerth/pictures.html#convection.
(Author: Wolfgang Bangerth, December 2007)
 |
 |
These images show a Laplacian with singular and hypersingular right hand sides, supported on a co-dimension one circle.
(Author Luca Heltai, 16 May 2007)

These images result from a constrained topology optimization problem related to the minimization of steady state thermal compliance on a 2D square plate. The optimization is performed on a hierarchically adapted grid: After completing optimization on a coarse grid level, the grid is adapted based on topology indicator derivatives and the optimization loop is restarted with interpolated topology indicator field on the (adaptively) refined grid as initial guess. The figure shows the global optimized topology and a selected zoomed part.
(Author: Rohallah Tavakoli, 9 February 2007)

This image shows the saturation at one time step of a simulation of how a mixture of two fluids moves through a random medium. The full description as well as movies of this problem and a 3d simulation can be found as step-21 in the tutorial of deal.II.
(Author: Wolfgang Bangerth, 2006)


Dendritic growth of crystals.
(Author: Denis Danilov)

Phase field modeling of the normal grain growth.
-Slawa, 07:49, 6 September 2010 (UTC)


The pressure of an incompressible flow around a backward facing step is visualized. The Reynolds number is 50. The question is, if the positive singularity (the left one, on the inflow side) is a real physical phenomenon. Indeed, it is numerically stable. (Andre Große-Wöhrmann, 2005)

Convection in itself is a hard problem (see the entry further up this page on thermally driven convection]](http://www.math.tamu.edu/~bangerth/pictures.html#optical].), but if it is between moving surfaces or with nonvertical gravity, it is even more challenging. This is what makes simulations of the earth's interior, both of the liquid rock earth mantle as well of the liquid metal outer core, so complicated. The picture to the right shows streamlines of a simulation of a convecting fluid in a radial gravity field between a hotter inner sphere and a cooler outer sphere, both of which are rotating and dragging the fluid along. Under such conditions, very complicated flow patterns develop after a while - among which are those that are responsible for the earth's magnetic field.
(Author: Andre Grosse-Woehrmann, 2005)
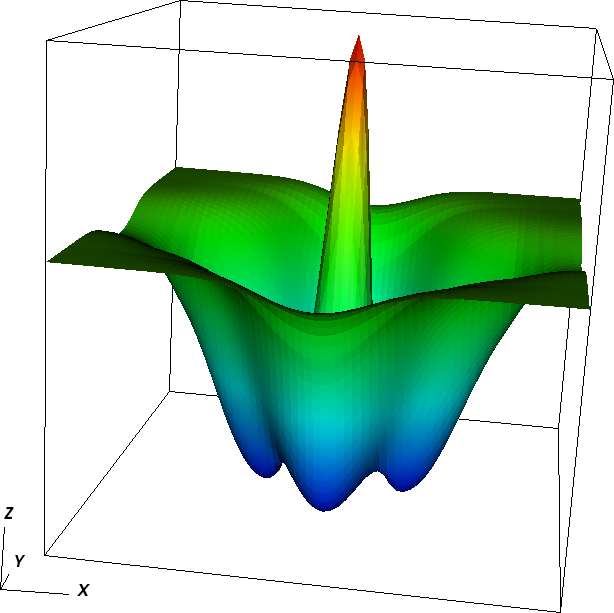

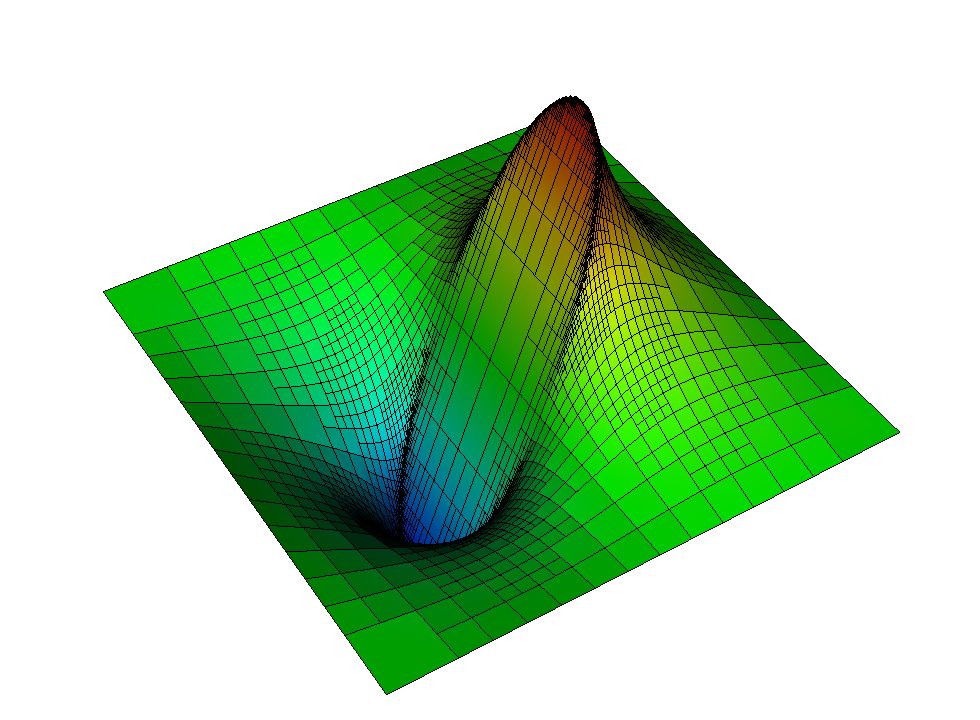
The step-25 tutorial program demonstrates the solution of the nonlinear, wave equation-type sine-Gordon equation, from which the pictures here are taken. Full movies of these solutions can be found in the results section of that program as well.
(Author: Ivan Christov, 2006)
Modelling transport via the wavelike approach, numerical waves occur.
(Author: Andre Große-Wöhrmann, 2005)

Modeling nonlinear transport equations is slightly more complicated since they can develop shocks even if the initial conditions are smooth. This isn't the case for the initial conditions that produced this solution of the KPP equations, but the difficulty of capturing the solution's features is still apparent.
(Author: Orhan Mamedov, Vladimir Tomov, Abner Salgado, as part of a student project, 2011)

This is the boundary supported fictitious domain method applied for the problem of Stokes.`You can see the pressure and the velocity field. The velocity is enforced on the circle via a weak condition. The key feature of this method is that this curve may be independent of the discretization mesh.
(Author: Andre Große-Wöhrmann, 2005)

This is the boundary supported fictitious domain method applied to the potential equation. Again the curve may be independent of the mesh. Nevertheless the mesh is refined in the vicinity of the curve.
(Author: Andre Große-Wöhrmann, 2005)

Deformation can be described in many ways. step-42 is a tutorial program (written by Joerg Frohne, 2013) that deals with plasticity and the picture above shows the displacement by pressing a printing letter in the shape of the Chinese character for "force" into a metal block. (The displacement at every node is exaggerated by a factor of 100.)


On the other hand, the images above correspond to the step-18 tutorial program. It shows the gradual deformation of a cylinder under pressure from above, until it essentially fails. The color coding indicates stress levels in the material. Because it looks nice, at the very bottom, there is also an isosurface view of the x-displacement early on in the simulation. More details about this simulation can be found in the step-18 tutorial.
(Authors: Wolfgang Bangerth, 2005; Joerg Frohne, 2013)

Here is an image of a mesh of a rather complicated domain. It shows a mesh created from CT data of the left lung
(Author: Li Pan, 2006)

Quasistatic crack propagation in brittle materials can be simulated using the energy principle, where a crack grows in the direction of maximal energy release. Here, the direction of the crack is computed by an asymptotic formula for the change of energy in two dimensions using (classical) stress intensity factors (linear elasticity). The crack is elongated step-by-step and the domain is remeshed in each step.
The pictures show crack paths in an orthotropic material with two axes of elastic symmetry in a compact-tension specimen. Both pictures show the crack under the same Mode-II shear loading, but with different orientation of the initial crack to the planes of elastic symmetry.
The third picture shows a crack propagating in an isotropic base material with an anisotropic local inhomogeneity. This numerical experiment demonstrates how a local perturbation in the material can influence a crack path.

When changing the numbering to something regular, some of the structures in DataOutRotation were forgotten. Instead of iso-surfaces symmetric to the center, we got this nice picture looking a bit like a complicated turbine. (Guido Kanschat, 17 January 2006)

Poisson equation with homogeneous Dirichlet boundary conditions solved using Rvachev R-functions method combined with finite elements. Mesh is nonconforming, boundary conditions are enforced exactly. Pacman domain is considered as a benchmark because it contains curved parts as well as reentrant corner :)
For those who are interested to learn a bit about theory of R-functions, here is a link to my old 2-pages conference paper. More detailed and extensive info in English is available at Spatial Automation Lab. (Slawa, 6 September 2010)

This had to be a simulation of directional solidification/dendritic growth. But something was wrong with the model and it produced such a nice tree in the end :) (Slawa, 6 September 2010)