t2 can be downloaded and installed from this repository. This is MongoDB's internal tool, so talk to your manager if you do not have access.
The README page provides simple instructions for downloading and installing t2 on OSX, Linux or Windows.
t2 can visualize many kinds of time series data, including WiredTiger statistics, iostat, FTDC data, arbitrary CSV files, etc.
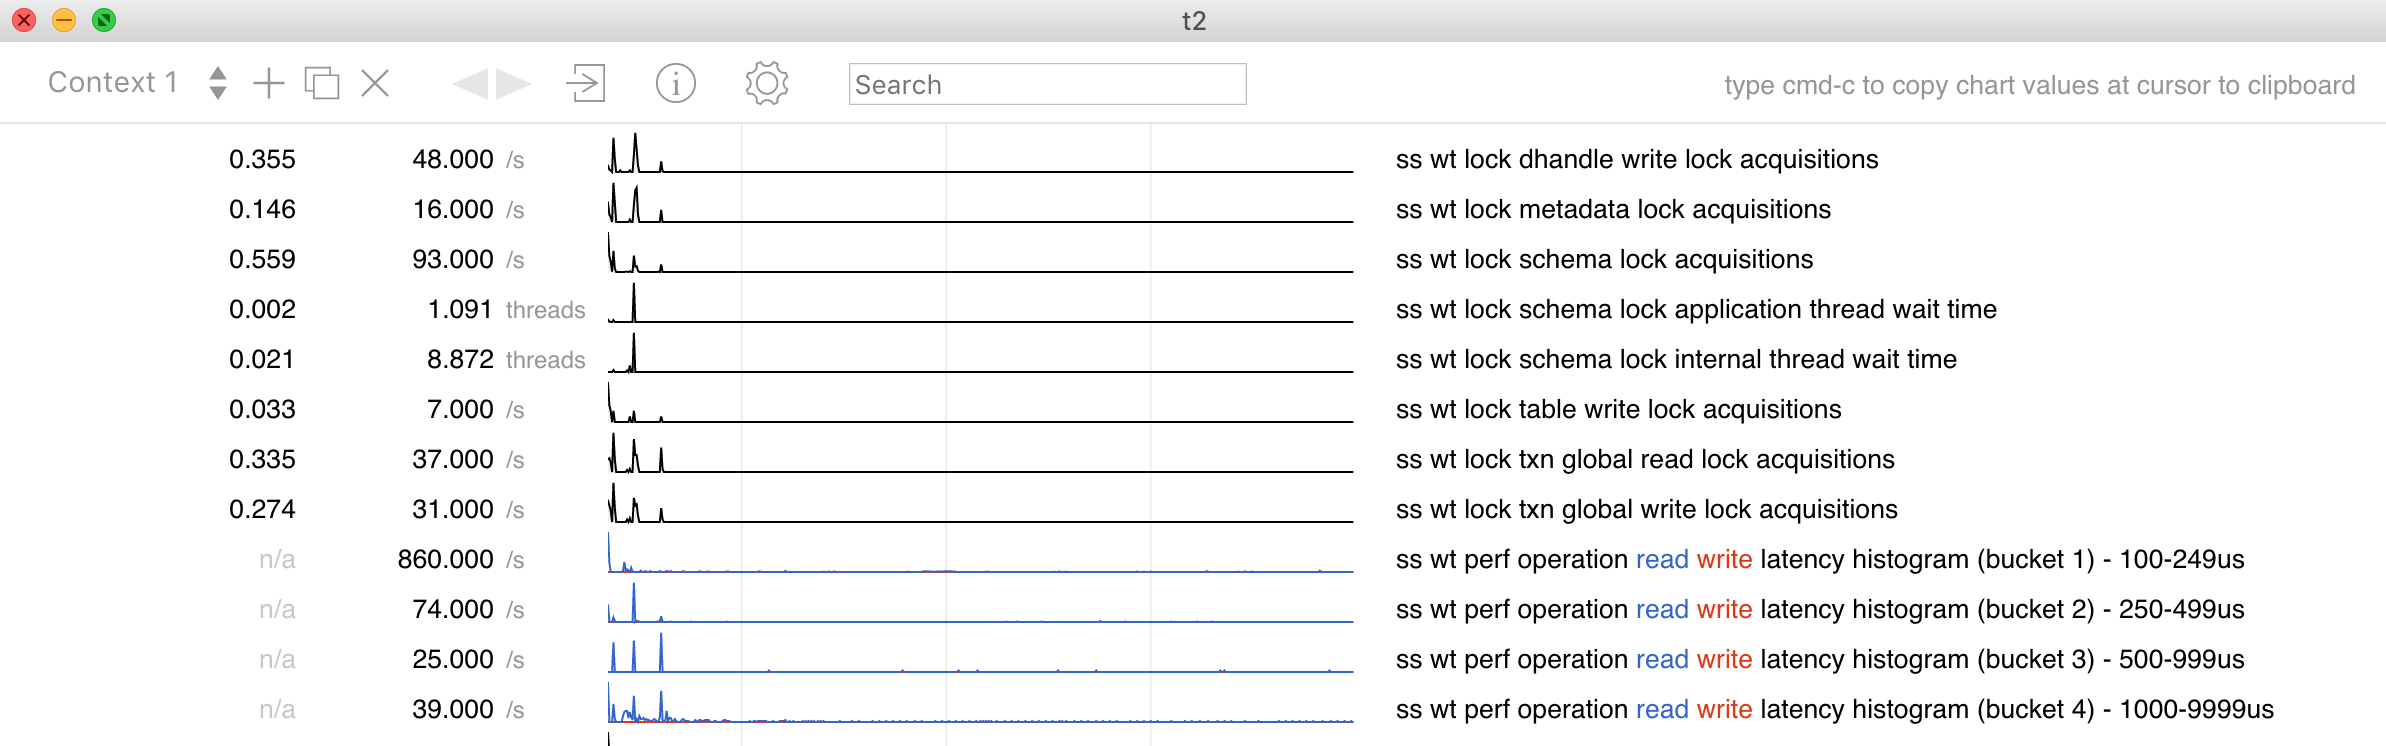
Here is an example visualization of WiredTiger statistics.
To generate WiredTiger statistics in the format that t2 can understand, it is preferable to use JSON format. Supply the following string to your WiredTiger configuration options:
statistics_log=(json=true,wait=1)
The value of the wait parameter will determine how often the statistics are recorded into the file.
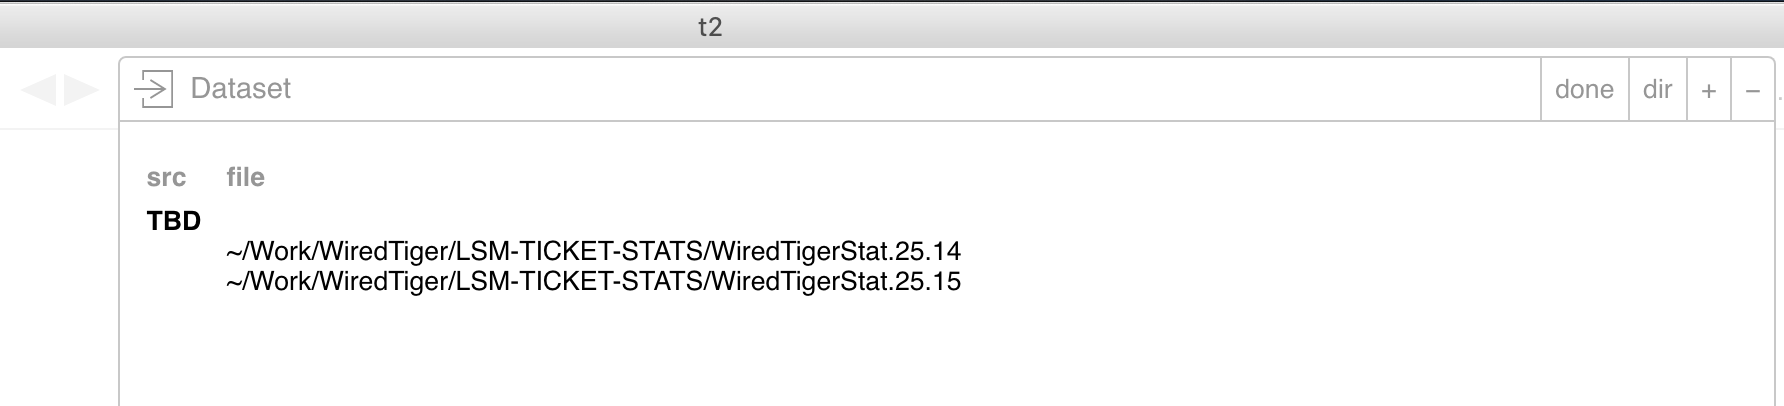
At the end of the run, your WiredTiger application configured with JSON-format statistics will produce one or more files, whose names look like this WiredTigerStat.25.14 or like that WiredTigerStat.25.15 (the first number shows the date of the month, the second indicates the time of the day).
To visualize these files with t2, all you do is:
./t2 WiredTigerStat.25.14
A single WiredTiger job would often produce several statistics files. This would happen if the job spanned more than one hour. For instance, if your job began at 14:50 and ended at 15:20, as in the example below, you would have two statistics files. In our example, they are called WiredTigerStat.25.14 and WiredTigerStat.25.15.
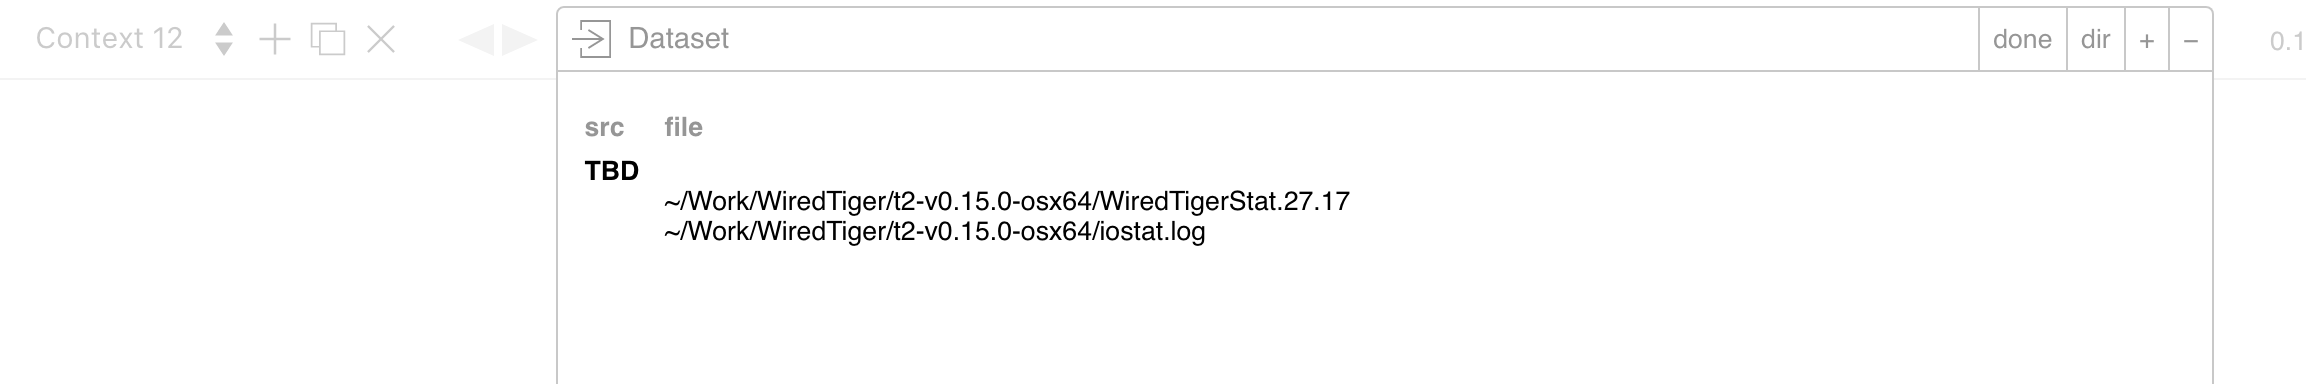
Let us see how to display these files, such that their data is aggregated on a single timeline. (We will treat the subject of comparing different runs in a separate section below). First, place all the statistics files from the same run into the same directory. Then, add them to the same context by pressing the arrow at the top of the t2 GUI, like so:
Then click "done".
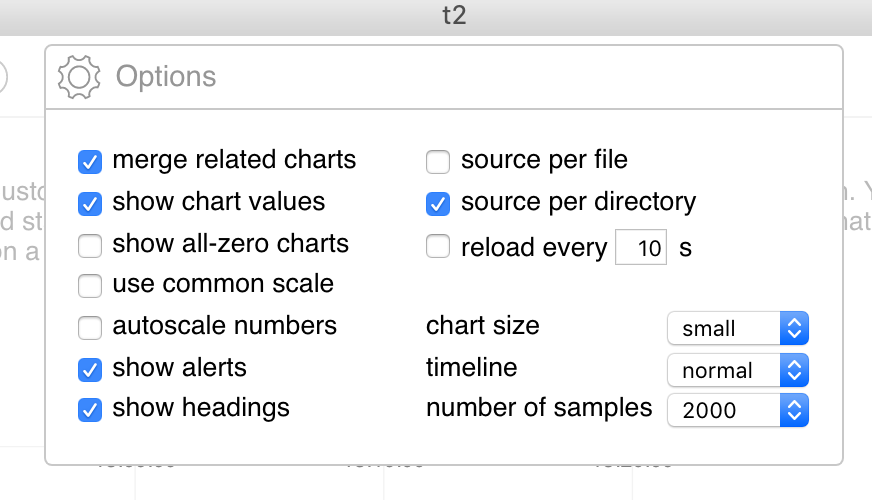
At first, the statistics from the different files will not be shown on the same line, but will appear staggered. To remove the staggering, click on the "settings" icon on top and select "source per directory":
The charts will then align properly.
Often we want to compare statistics from two different runs, a "good" run and a "bad" one. This is a bit more tricky, so we will discuss two options. For more information, please read here.
You can trick t2 into thinking that the files from the good run and the bad run are actually from the same source by placing them into the same directory and selecting "source per directory" as in the above example. Then, click on the "Settings" wheel and select "condensed" in the "timeline" properties drop-down box. As a result, the good run and the bad run will be concatenated, like so:
In my example, the good run and the bad run took the same amount of time, so we can clearly see that the stats for the bad (second) run start in the middle of the timeline. Since there is a gap between the two runs, the timestamps are only meaningful for the first run, not the second. You need to use t2 version 0.15.1 or higher to get that working.
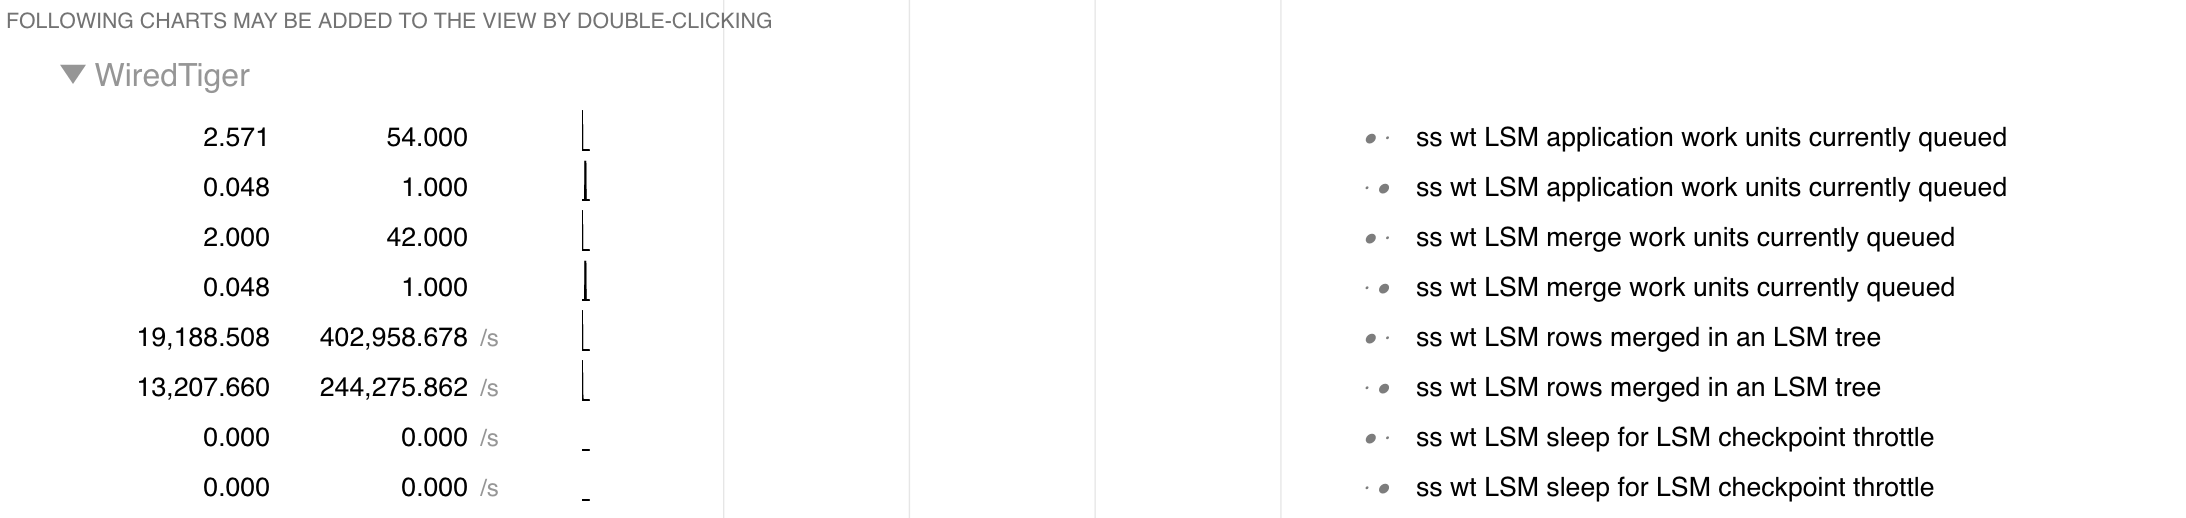
Another option is to display the data, such that same metrics from different runs are shown one above another, like in the following picture. Notice that each a metric from the "good" run is followed by the same metric from the "bad" run.
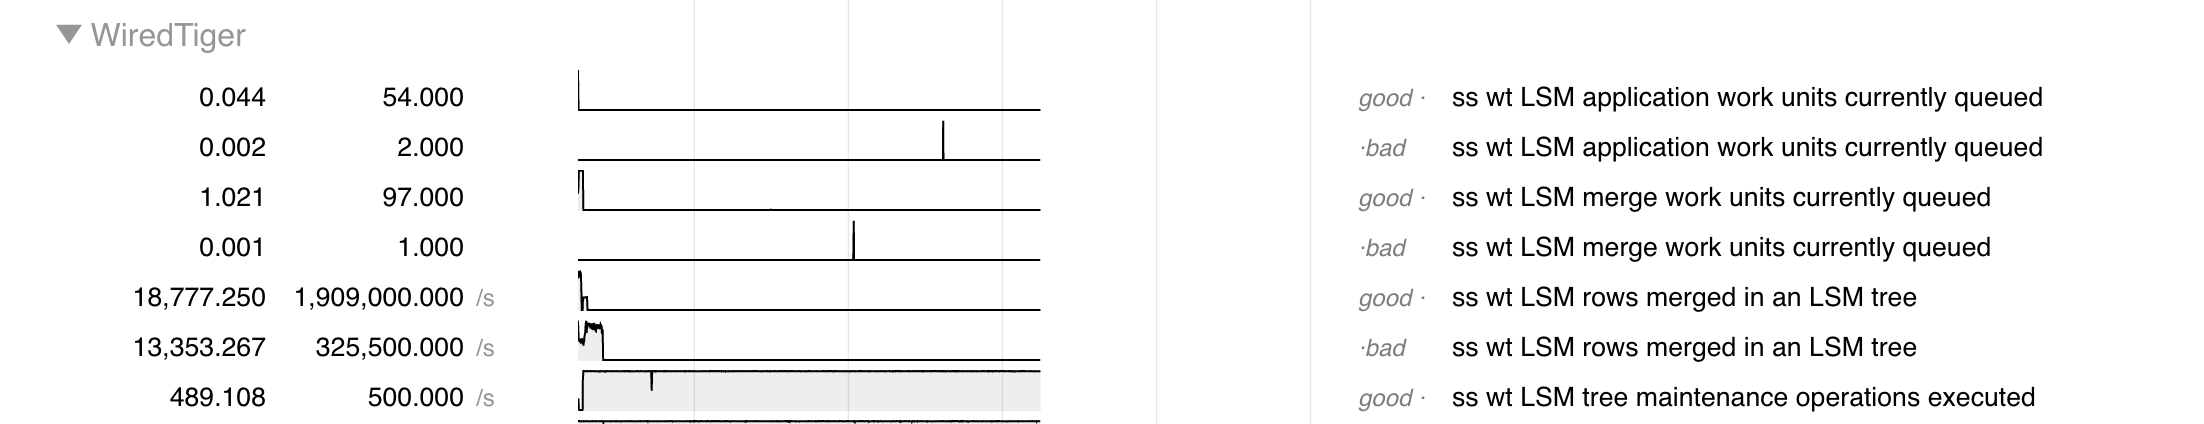
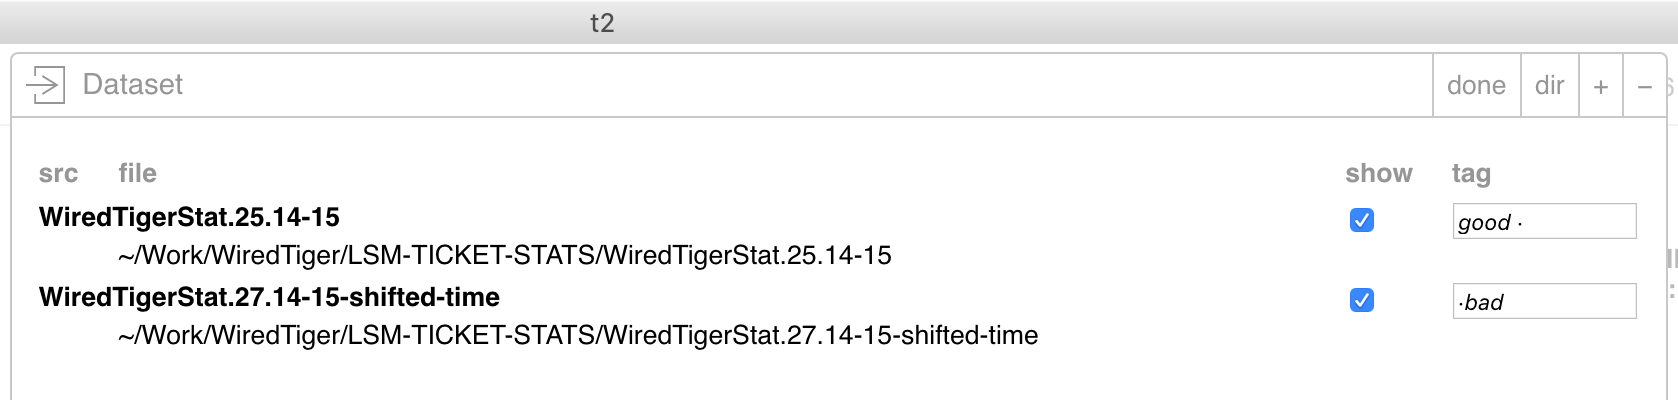
To get this working, first add two files to your viewing context as in the above examples, but don't select "source per directory", so that t2 knows that you are comparing two different runs. As you add the files, tag the one containing the statistics from the good run as "good" and the other file as "bad", like so:
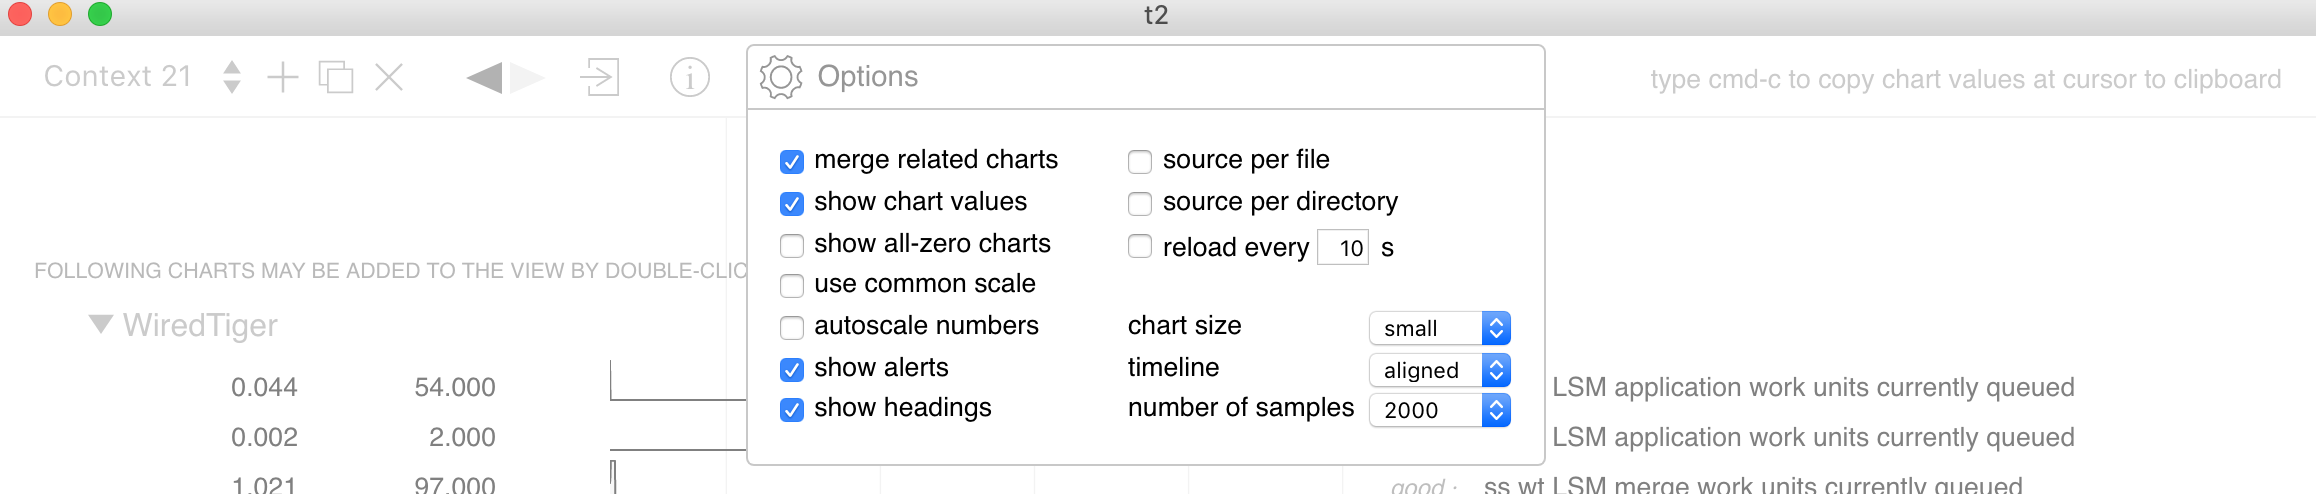
Next, in the "settings" box, select the "aligned" option. This option will ensure that the metrics are stacked one on top of the other:
If your data were collected at time intervals that were close to each other, then you should be all set. However, if there was a significant time gap between the good run and the bad run, this gap will dominate the view, making the comparison difficult, as in this example:
At the time of this writing (t2 version 0.15.1) there is no simple recourse. The easiest way to fix this is to replace the timestamps in one of your files, so that they appear chronologically closer to the timestamps in the other file. This can be done using the "search-replace" feature of a text editor. If using a text editor, be careful, for if the file is too large, the editor might truncate it. In that case, resort to good old lex, yacc or other stream-editing tools.
Another way to compare multiple runs is to use different contexts. That way, each run will be shown in a separate t2 screen or viewing context. Let's say you have three runs. You start t2 and load your first set of data. In the upper left of the window you will see two things: "Context 1" and a + sign. If you hit the plus sign it will create "Context 2" and you can then import the data set. Then use the dropdown for "Context 1" and "Context 2" to select between them. Also you can rename "Context 1" to be something meaningful for you: "8 Threads" or "10G Cache" or whatever.
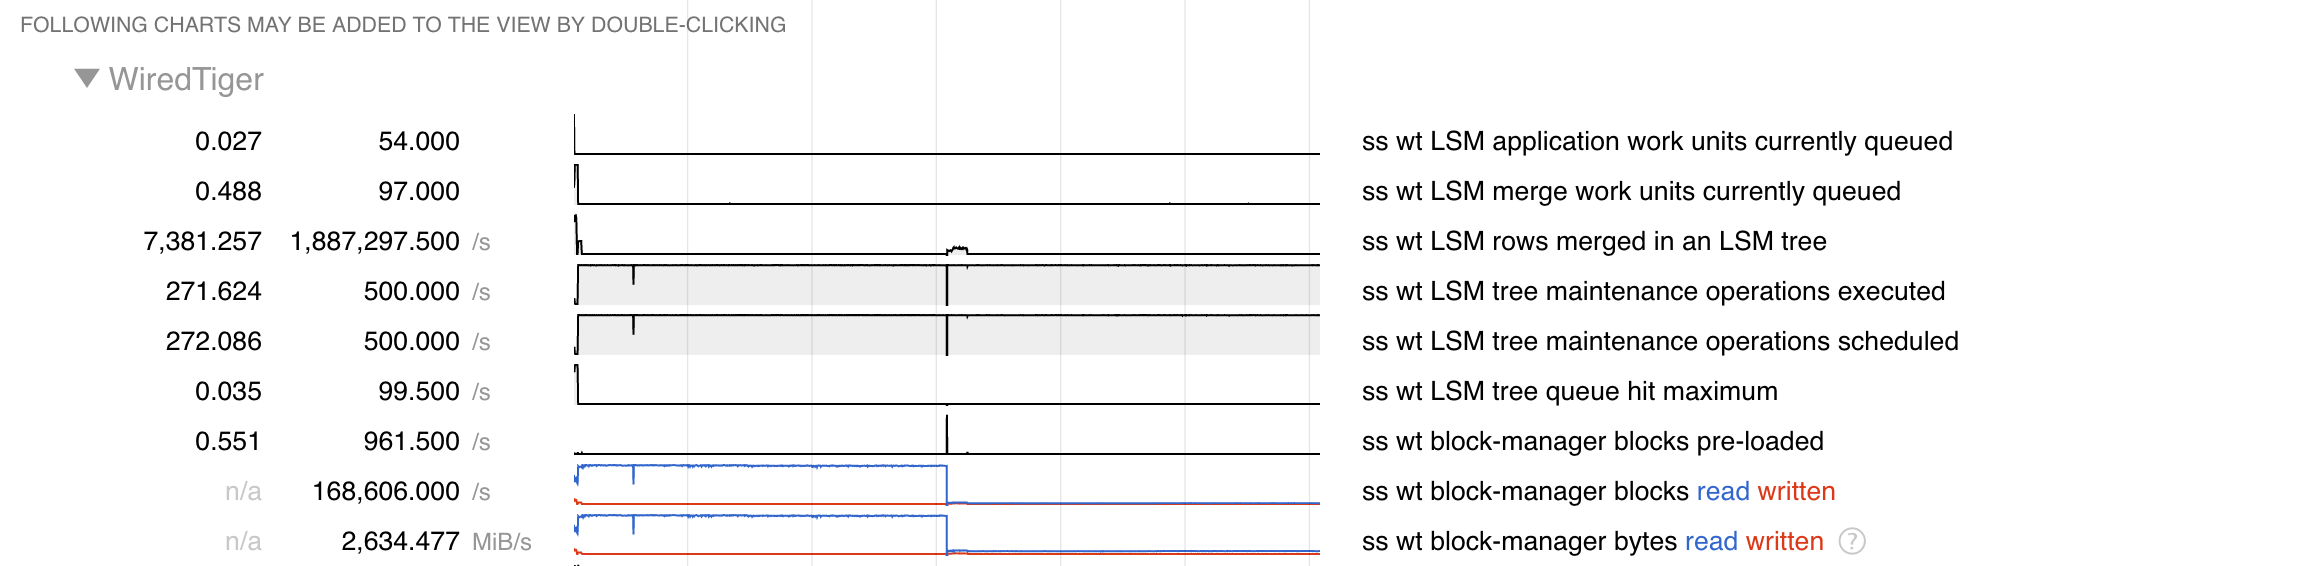
t2 also includes WiredTiger-specific views or filters, which will display a portion of statistics related to a particular theme. For example, if you select the "WT Eviction Efficiency" view from the menu at the top, you will see something like this:
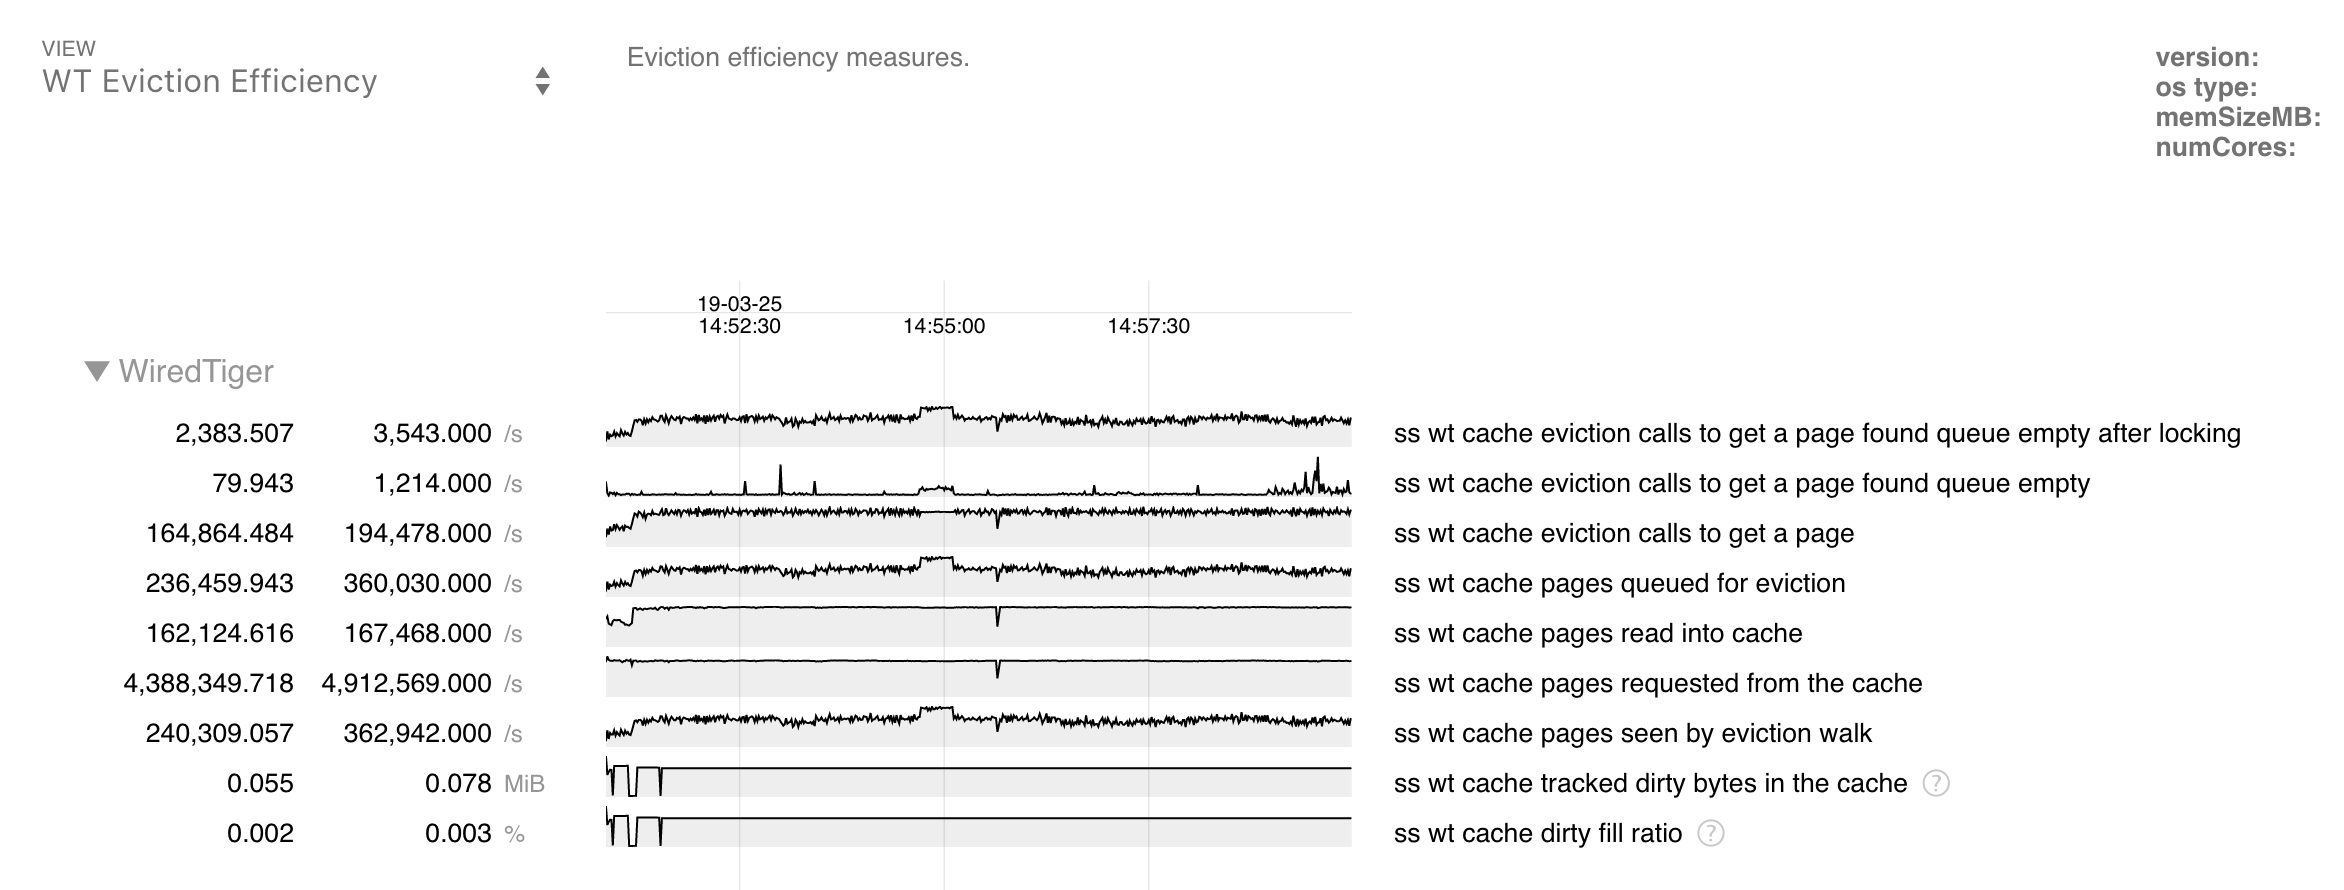
And the remaining statistics will be shown at the bottom, below the filtered chart.
If you wanted to understand what else was going on in the system as your workload was running, you can look at other system metrics using t2. For example, to gather iostat metrics while your workload is running, invoke this command:
LC_TIME=en_US.UTF-8 iostat -k -t -x 1 > iostat.log
Then simply open iostat.log in t2. The environment variable setting the correct timestamp format is crucial for t2 to understand the resulting output.
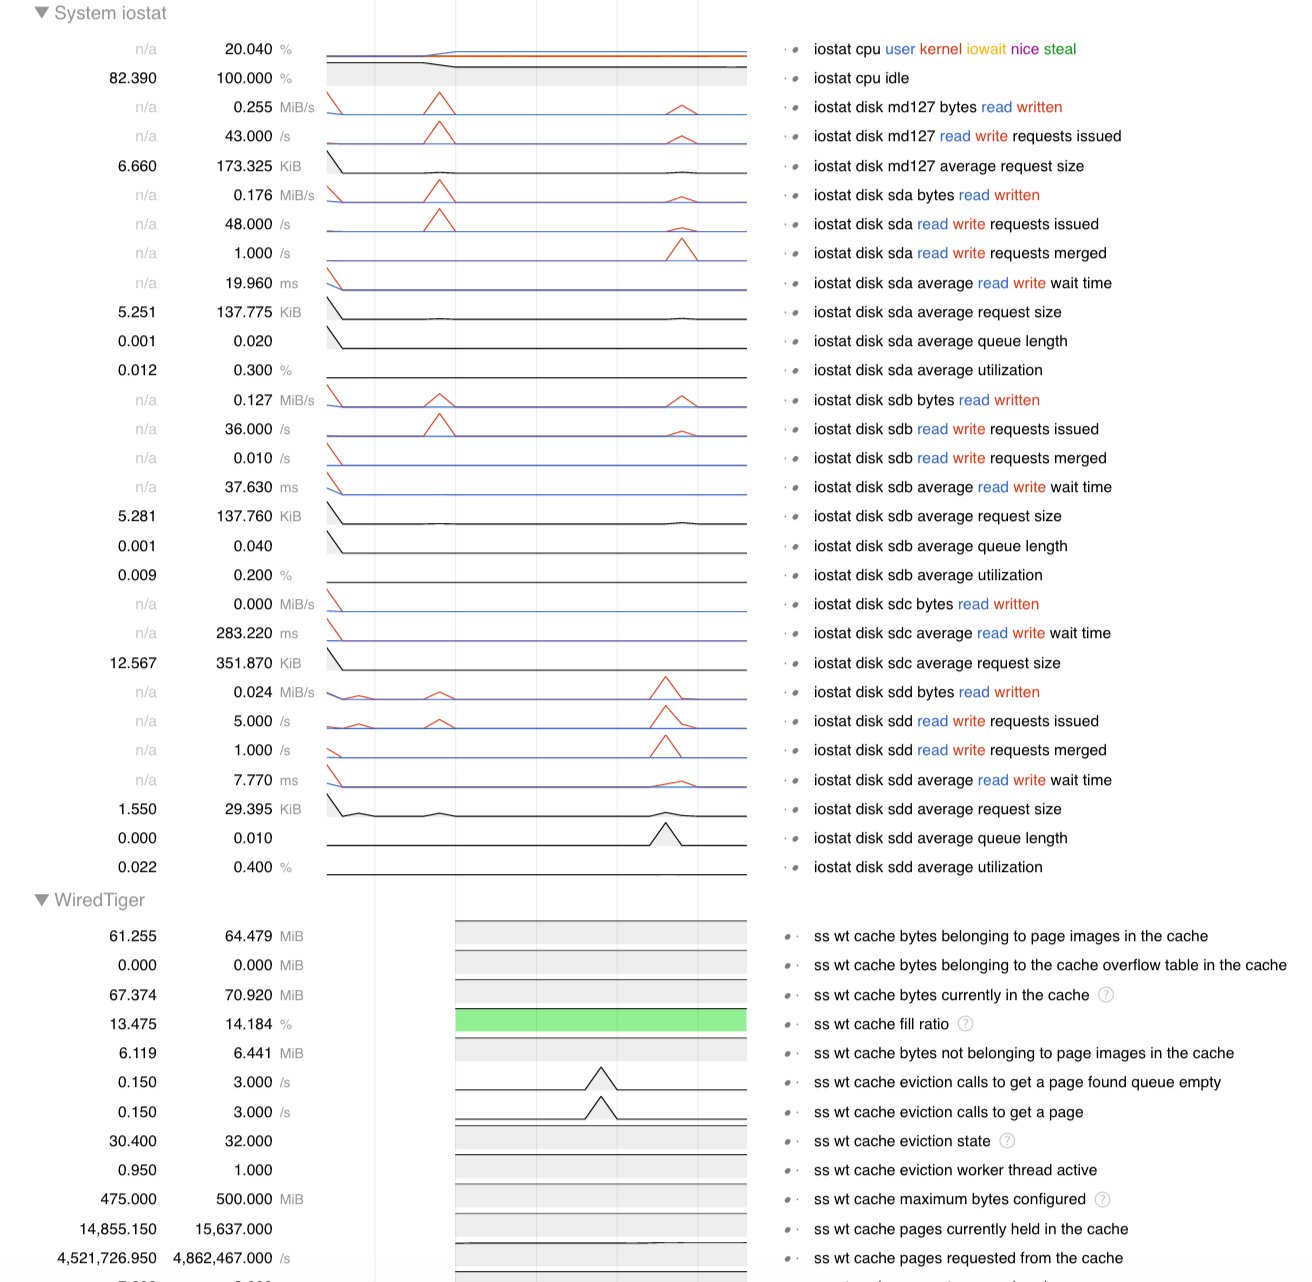
If you want to examine the iostat output on the same timeline as your WiredTiger statistics, simply add both the iostat log file and the WiredTiger statistics file (collected roughly at the same time) to the same view by clicking the "arrow" button on top:
You will then see both iostat and WiredTiger statistics in the same window:
In general, you can get t2 to display custom any CSV file. Here is an example CSV file that illustrates the format that t2 expects:
time,cloned,remaining
2018-05-23T06:10:47.130Z,243,166944
2018-05-23T06:10:48.131Z,2767,166944
2018-05-23T06:10:49.132Z,5570,166944
2018-05-23T06:10:50.133Z,8604,166944
Basically, the first line is the header, then you need to have your time series data, such that the timestamp is in the Unix en_US.UTF-8 format.
You can specify more details about your units of measurement, please refer to README page.
If you run into issues with t2, it's best to contact Bruce Lucas, who has been very helpful!