Perf with t2
The output of perf can be viewed with t2. First, using perf, gather the data that you want to visualize. Instructions for doing this are summarized here. You will need to use the perf record -g command (sampling with callstacks) to produce the perf.data file.
Then, follow these instructions to generate a CSV file from perf.data:
# Generate text output. Run this on the same node you ran 'perf record'. This command assumes that
# perf.data is in the current directory.
perf script > perf.txt

# Install the required python module.
sudo pip install python-dateutil

# Generate the CSV. The 'reverse' option will visualize callstacks, such that if there is a
# function-hotspot in the code, and we can arrive at that function via multiple paths, all
# these paths will be summarized at the common root.
python perf2stacks.py < perf.txt > perf.stacks
python stacks2csv.py --reverse < perf.stacks > perf.csv

# View in t2.
t2 perf.csv [...]
More information on installing and using t2 can be found here.
At the time of this writing, after installing the latest version of t2 you need to clone the t2 repository in order to obtain the latest version of perf2stacks.py as it has a crucial fix. The scripts directory in the t2 repository contains the README file with more information about this process.
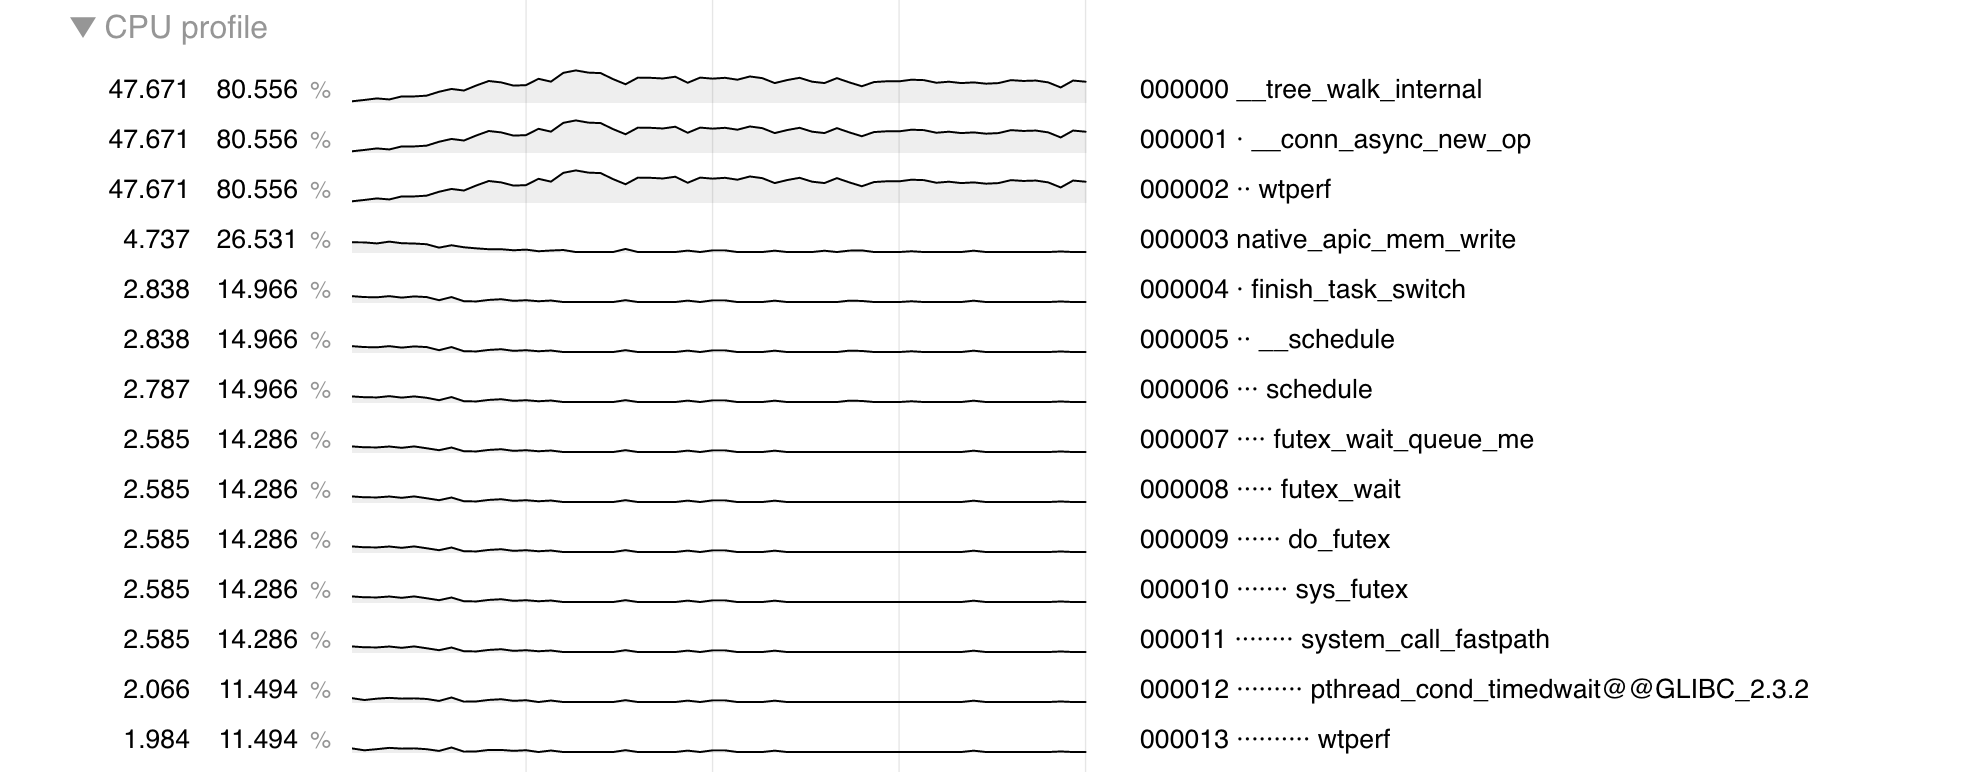
Here is an example output that you might see: