Performance Issues (old)
Note: this document applies to VS Code version 1.18 or older. For newer version please refer to the Performance Issues page.
This page documents how you can help us to track down performance issues. It contains:
- Questions about your setup
- Experiments you can make to reproduce and narrow down
- How to create performance profiles you can provide to us for further analysis.
To help us narrow down the issue please include answers for the following questions:
- What is the size of your workspace/project (how many files)?
- What languages are used in this project?
- Which Code process consumes the most resources? VS Code is a multi process architecture and we need to know which process is causing the issue. You can identify the process based on the command line arguments that were used to start the process.
- On Mac/Linux, we recommend to use the htop process viewer. You can also use the Activity Monitor to find the
PIDof the process and from a terminal you can runps aux | grep <pid>to find its arguments. .
. - On Windows, we recommend to use the process explorer. You can also use open the Task Manager, switch to the Details tab and make the "Command Line" column visible as shown below.

- On Mac/Linux, we recommend to use the htop process viewer. You can also use the Activity Monitor to find the
Please try to reproduce the performance problems in different setups:
-
Can you reproduce the issue when you start VS Code with extensions disabled? You can start VS Code with extension disabled using the
--disable-extensionscommand line argument, e.g.,code --disable-extensions. -
If you cannot reproduce the issue when the extensions are disabled, then can you narrow down the extension by selectively disabling extensions? You can disable extensions in the Extensions Viewlet
 and restart/reload. Once you found the extension please file an issue against the extension. To file an issue against an extension: find the extension in the market place, and use the
 Issueslink in the Resources section. -
Try to reproduce the problem on different folders; a folder with less files, a folder that is not under source control, or open a single file.
-
Try to reproduce the issue in the VS Code Insider version. This will run our latest code and use a different setup (settings, extensions). You can install the insider version here https://code.visualstudio.com/insiders.
-
Run VS Code when your settings are reset/empty. Open your settings, copy your customizations and then emtpy the JSON contents so that only
{}is left. -
Run VS Code in verbose mode and check whether there is any suspicious output in the console or the developer tools. You start VS Code in verbose mode with
code --verbose. Also open the DevTools ("Help>Toggle Developer Tools") and open the console there.
When VS Code feels slow to start you can check the startup timers. Hit "F1" and select "Startup Performance". This will open developer tools and print some startup stats onto the the "Console".
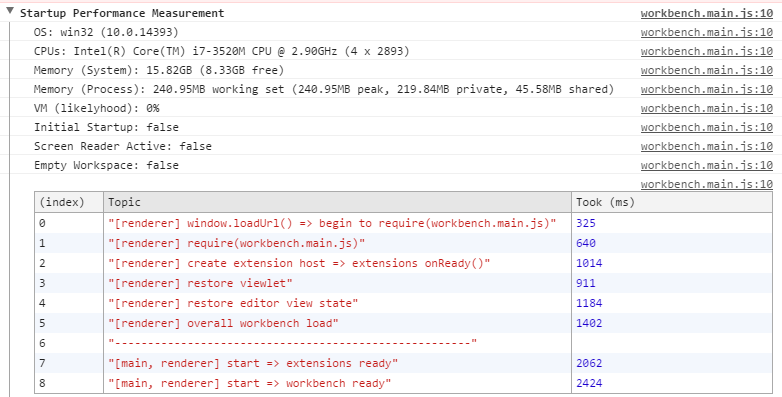
Please share these numbers with us as they often allows us to understand what is slow.
When you cannot share the workspace exposing the problem with us, then you can help us by providing performance profiles that we can analyze:
- If VS Code feels not responsive then please create a CPU profile of the VS Code core (renderer process) and attach it to the issue. To create a profile:
- Execute "F1 > Toggle Developer Tools." In the overflow menu of the developer tools
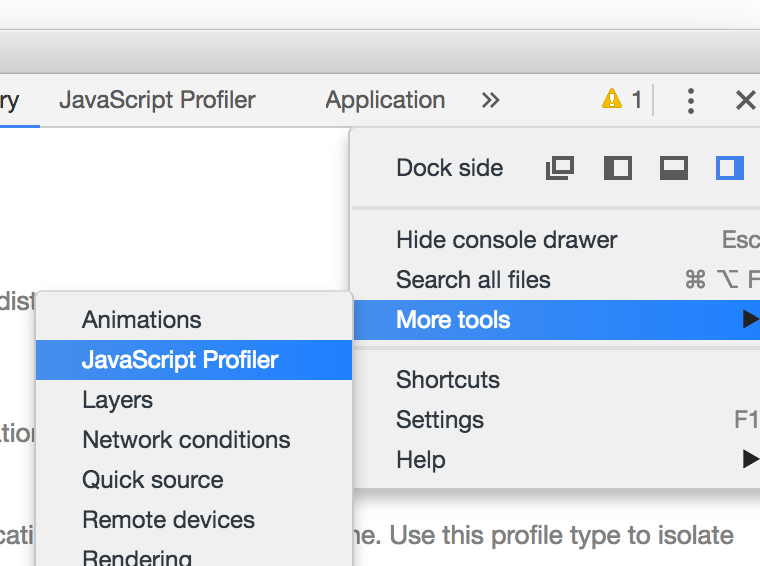
- Select 'More Tools > JavaScript Profiler'. In there select start.
- Let it profile for 30 to 60 seconds, stop it.
- When the performance issue happens on startup, start the profiler and then reload the window using "F1>Reload Window."
- Save the profile to a file and attach the file to your issue.
- Execute "F1 > Toggle Developer Tools." In the overflow menu of the developer tools
- If VS Code is slow to start then please create a startup CPU profile. Do the following
- Make sure to only have one window open
- Quit VS Code (Cmd+Q for Mac, closing the last window on Linux/Windows)
- Start VS Code from the command line like so
code --prof-startup - VS Code will start and create two profile-files in your home-directory. Please attach these files to your issue or create a new issue with these two files
- If VS Code feels not responsive and the CPU profile doesn't provide insights then please a create a CPU profile of the extension host process. The extension host process is the process that executes your installed extensions. To create a profile:
- Start VS Code from the command line the with
--inspect-extensions=<port>-flag, for examplecode --inspect-extensions=9333. - In VS Code, from the 'Command Palette (F1)', select 'Developer: Toggle Developer Tools', hit Enter.
- Select the Console tab and find a message that starts with "Debugger listening on port 9333" and that ends with a chrome-devtools-link.
- Open that link in Chrome for dedicated DevTools for the extension host.
- Use the Memory and CPU profiler to understand how memory and compute resource are being used.
- Save the profile to a file and attach the file to your issue.
- Start VS Code from the command line the with