Explain extension causes high cpu load
Visual Studio Code runs extensions in a separate Node.js process – the extension host. This isolates extension code from VS Code itself, but it doesn’t isolate different extensions from each other. Due to the single threaded nature of JavaScript, an extension can, willingly or not, monopolize the extension host thread, block all other extensions, and make operations appear as unresponsive.
To detect this situation, VS Code monitors the extension host so that it knows when it becomes unresponsive. It then attaches a CPU profiler for a short while to analyze what part of the extension host has been causing the unresponsiveness.
When an extension is monopolizing the extension host process, VS Code encourages users to file an issue against the extension in question. When you receive such an issue, you should do the following:
- Make sure the
<myExtensionId>.cpuprofile.txt-file has been uploaded. If not, ask the author for it. - Remove the
.txt-suffix - Open the JavaScript profiler via F1 > Developer Tools > ⋮ > More Tools > JavaScript Profiler
- Select Load and pick the
.cpuprofile-file

Use the JavaScript profiler to drill into individual functions and analyse in what part of the code most time has been spend. Keep in mind that a huge file, a huge number of files, or some other "unexpected" input may have been involved and that was the cause of the high CPU load.
Sometimes it's not code execution but code loading (which is also blocking) which causes unresponsive extension host. Profile then are harder to read and often look like this:
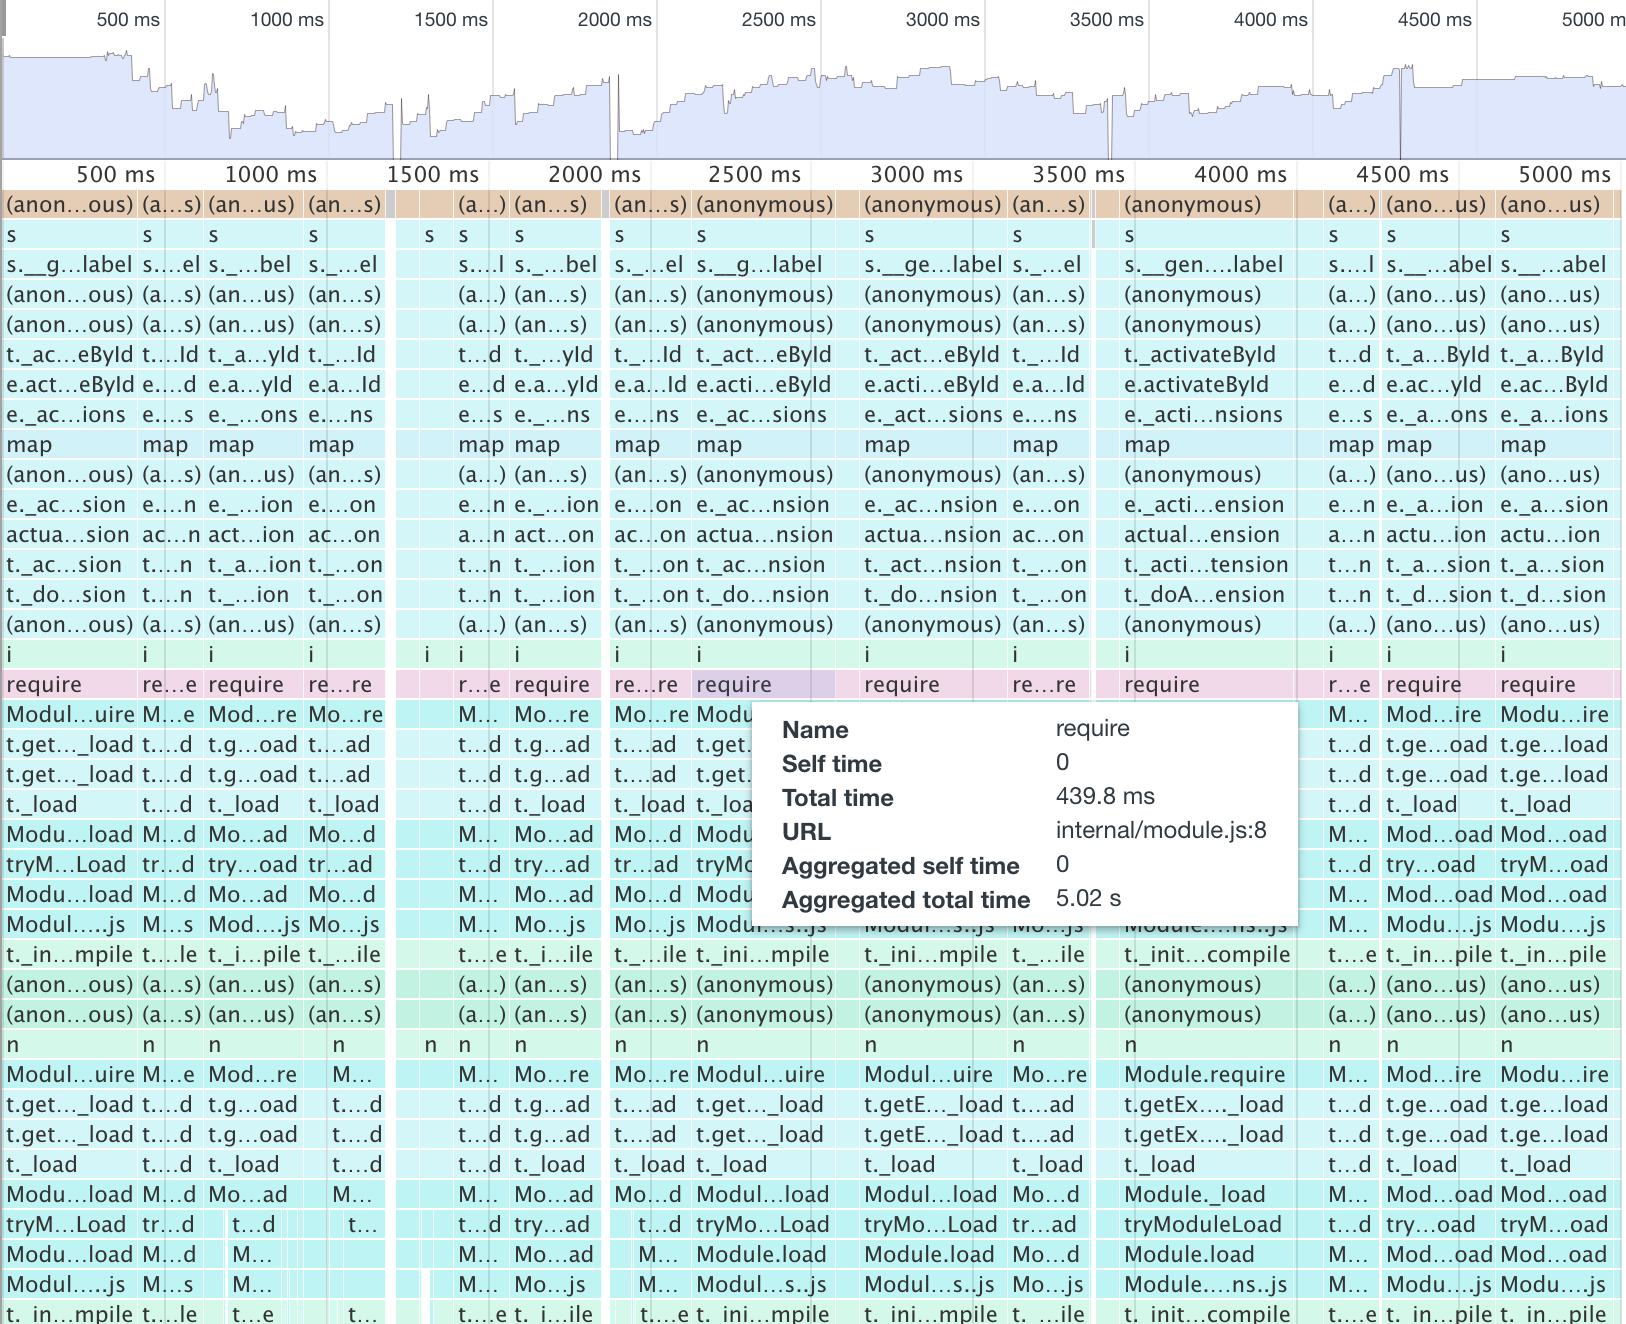
The problem is that there are too many, often little, files that all need to be read and loaded. Considering bundling your extension, e.g with https://webpack.js.org or https://rollupjs.org/. For the former there is a sample: https://github.com/Microsoft/vscode-extension-samples/tree/master/webpack-sample
If you can reproduce the slowdown or if you want to verify your changes, you can also profile the extension host yourself. Follow this guide: https://github.com/Microsoft/vscode/wiki/Performance-Issues#profile-the-running-extensions