[DEV] Perf Tools for VS Code Development
The page lists some tools to investigate and understand performance of VS Code. They complement the built-in Performance, CPU Profiler, and Memory tabs of dev tools and usually require code changes (which usually must not be committed)
The following tools are available to the "core" of VS Code, e.g main, renderer, shared, and extension host process but not to extensions.
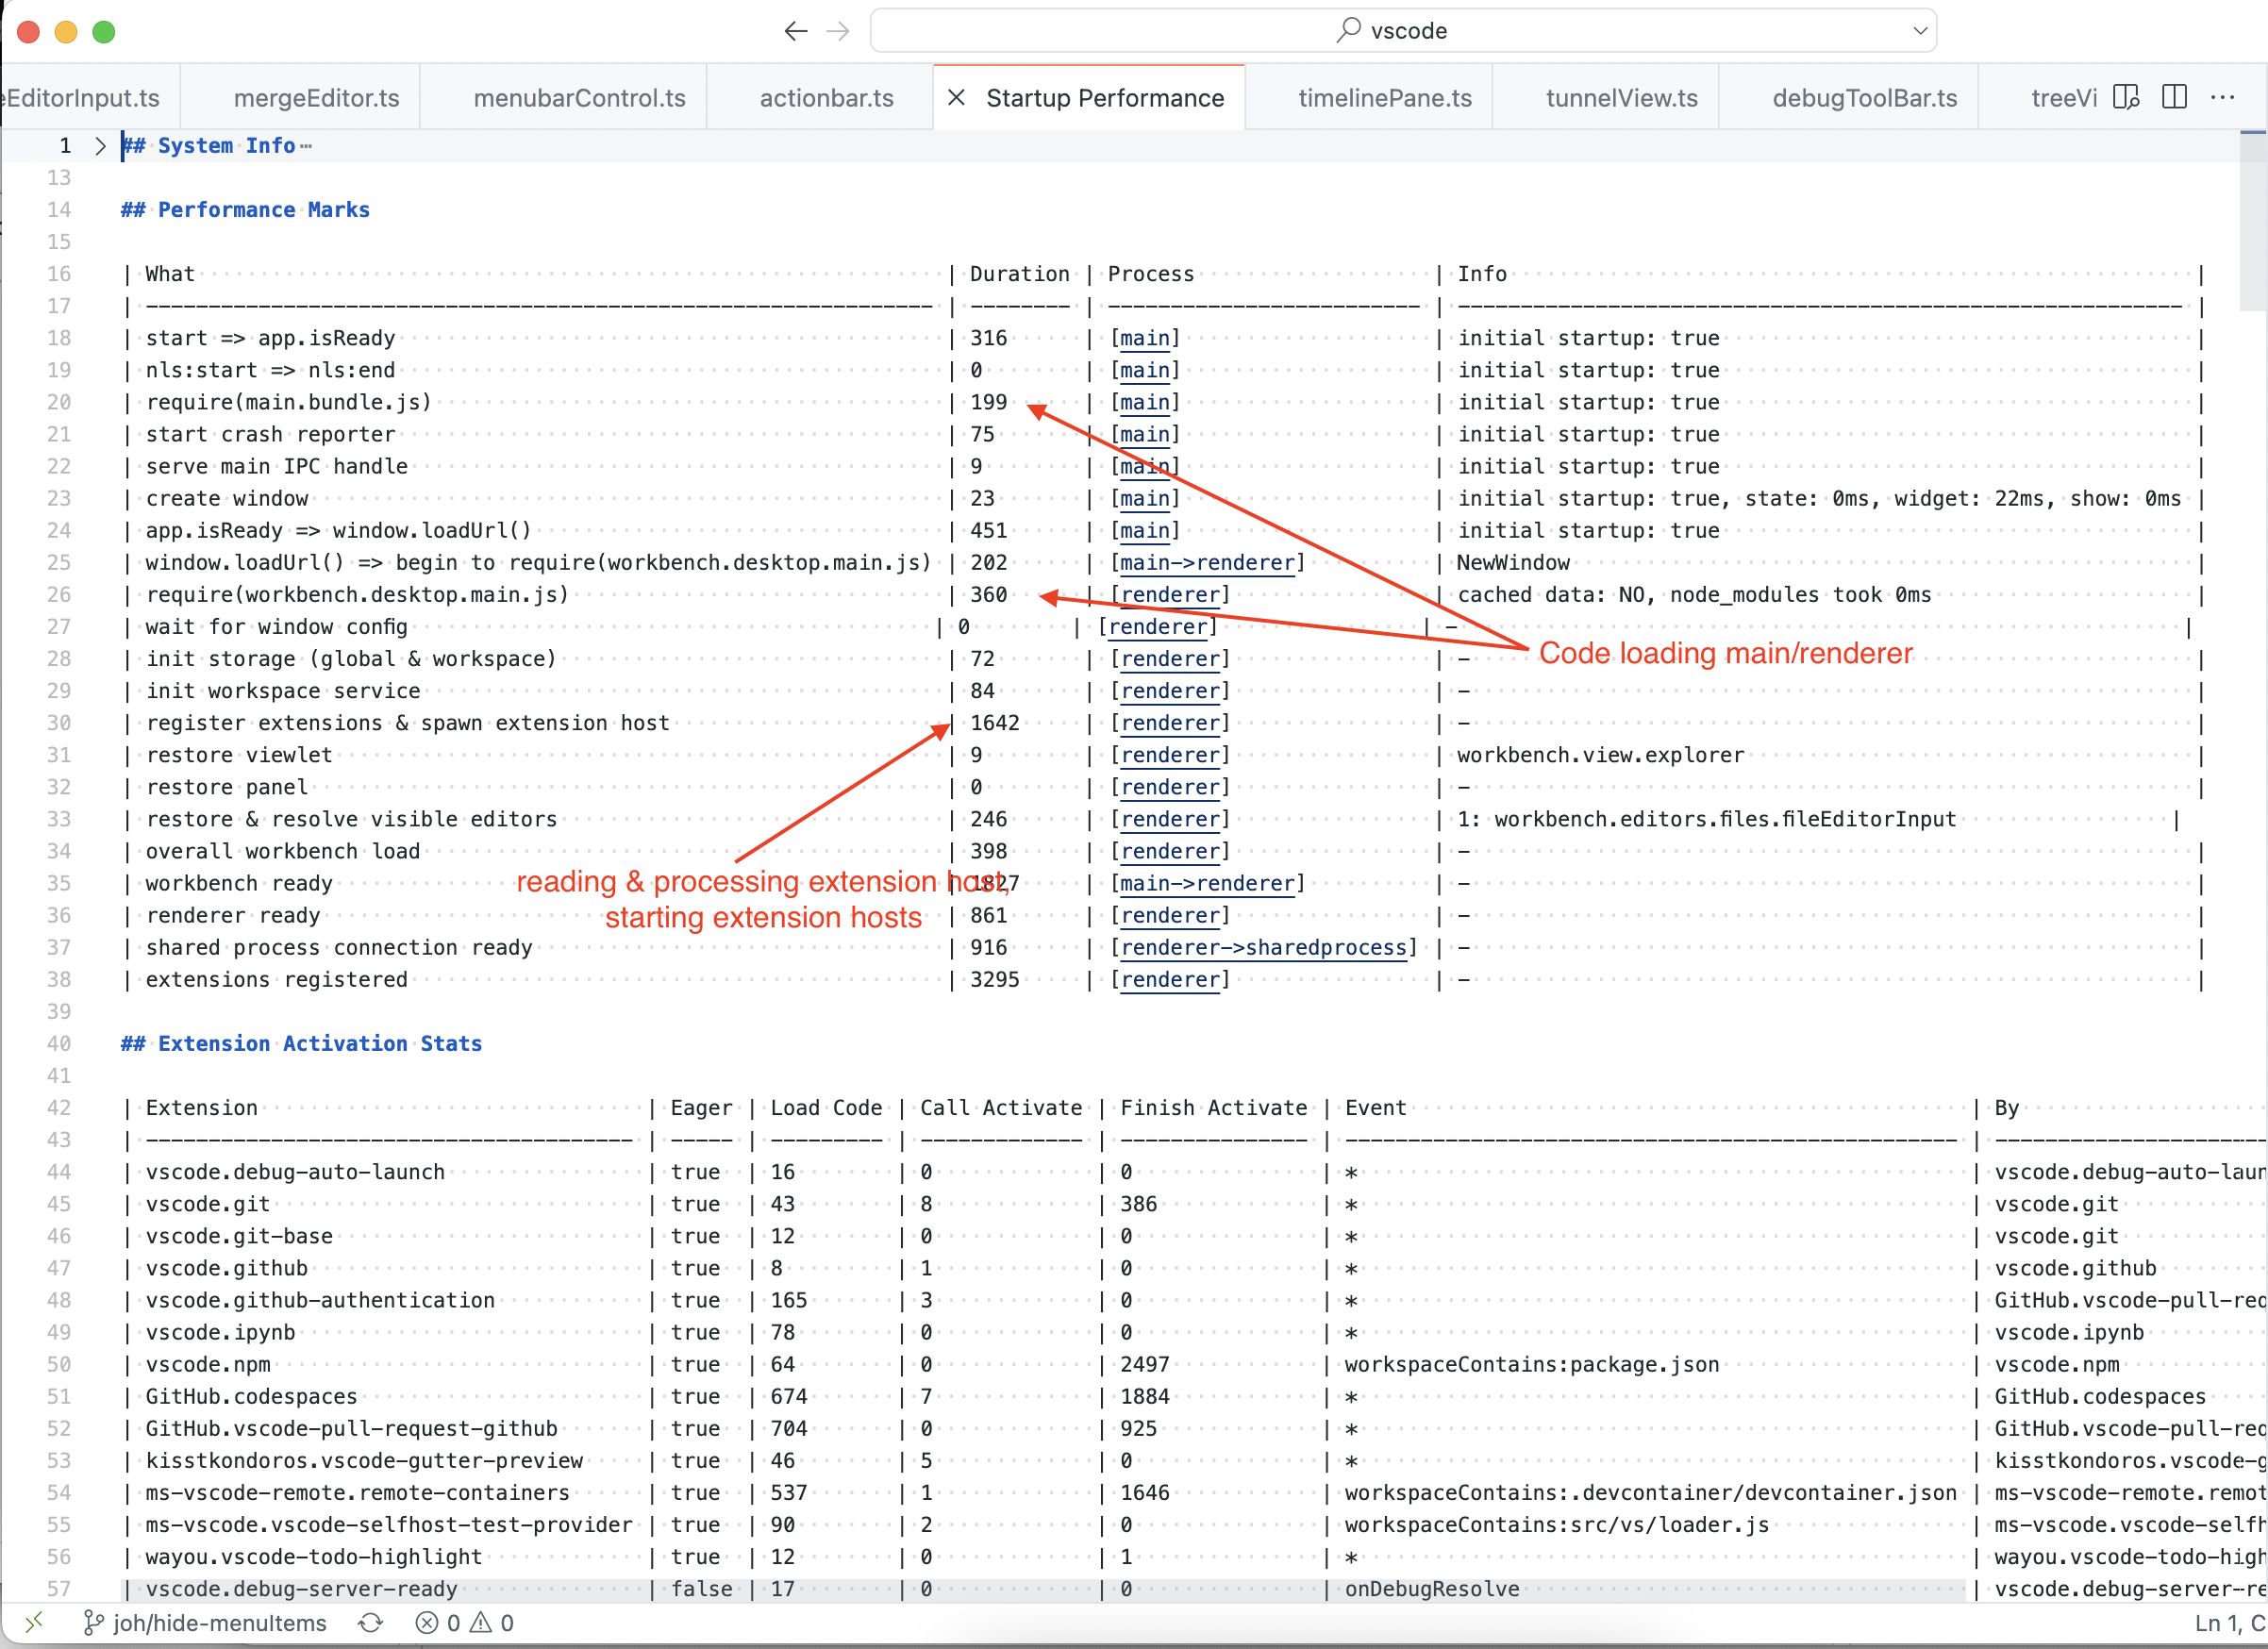
The startup performance editor (F1 > Developer: Startup Performance) gives you a good overview of things that are important for startup, eg
- high-level aggregation of perf-marks (see below for more details)
- extension activation stats (activation reason, code loading time, time to finish calling activate)
- code loading stats (dev only)
The screen capture below shows a sample and highlights some interesting bits like code loading, processing extension contributions, and extension stats. The durations are derived from well-known perf-markers. Simplest is to look them up in source here
We have the performance.mark-utility that works very similar to the standard mark-function. The difference is that you can use it in any context (node, electron, browser, or worker) and that it works with unix timestamps. This allows them to be compared across different processes.
Performance markers should be used for significant points of program execution and usually come in pairs of willXYZ and didXYZ.
// Create the window
mark('code/willCreateCodeWindow');
const createdWindow = window = this.instantiationService.createInstance(CodeWindow, {
	state,
	extensionDevelopmentPath: configuration.extensionDevelopmentPath,
	isExtensionTestHost: !!configuration.extensionTestsPath
});
mark('code/didCreateCodeWindow');-
Note that mark names should start with
code/- other marks aren't considered for down-level tooling (perf-editor, telemetry) - Note that marks around async code might measure more than you think because yielding the event loop gives any scheduled code a chance to run
Performance marks can be used in the following ways
-
All marks from all contexts are send as telemetry events. That allows to aggregate any of them and to learn how long things take in the "real world"
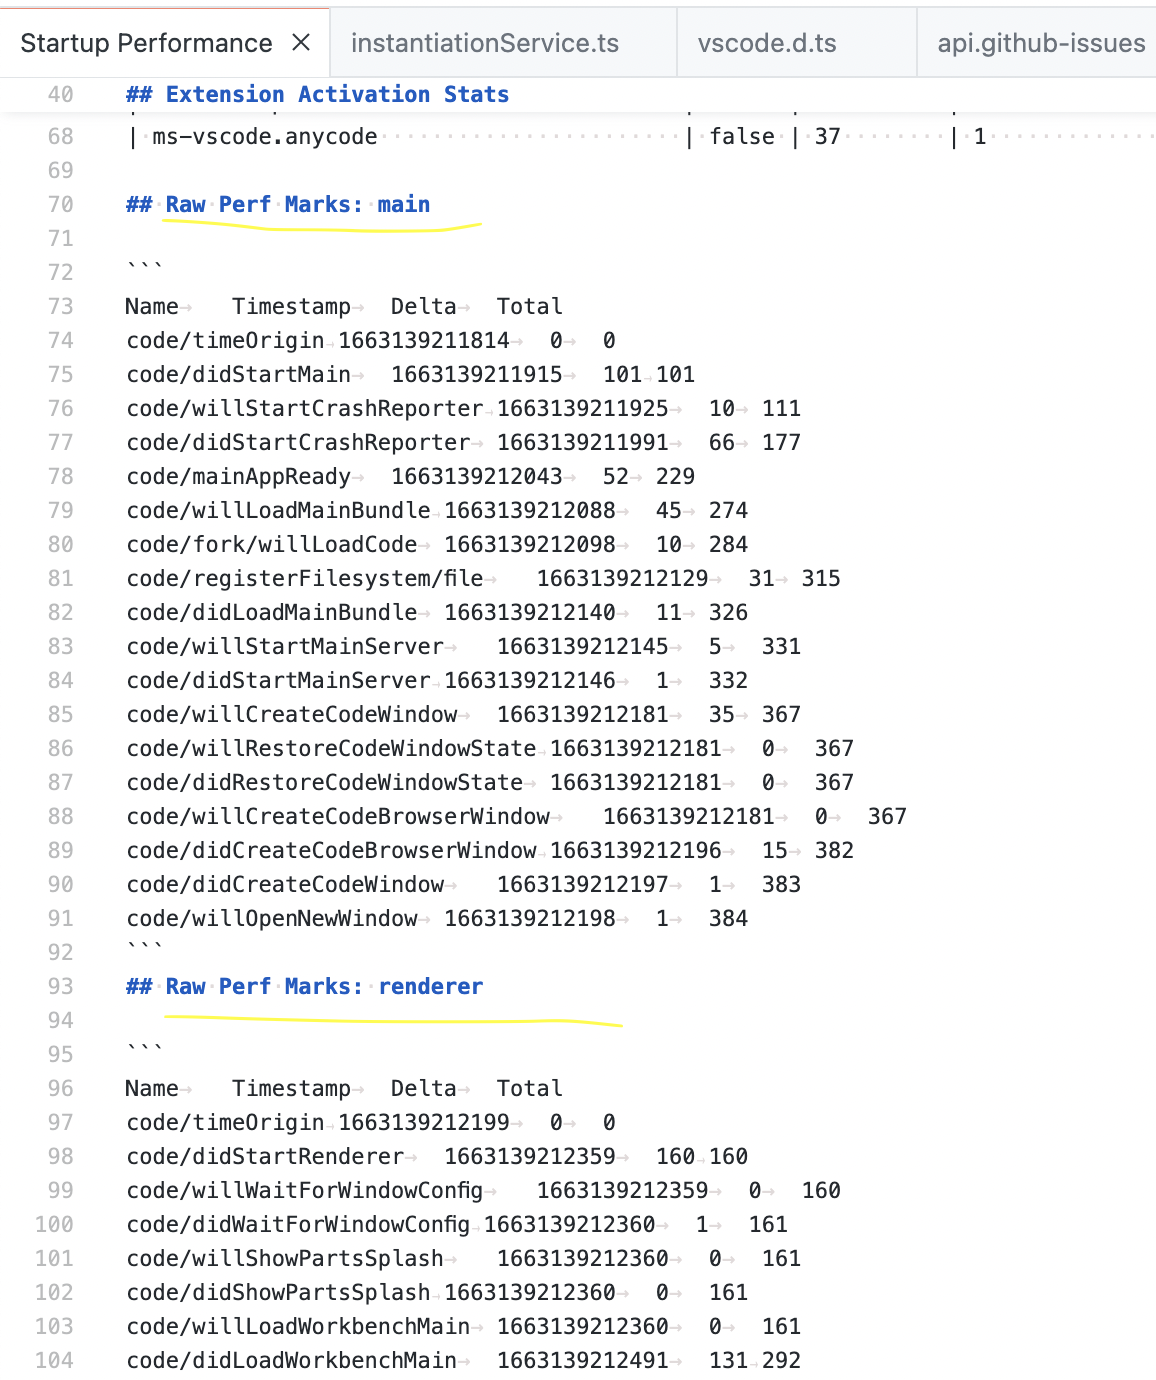
-
All marks from all contexts are listed in the "Startup Performance"-editor. They are formatted so that you can copy-paste them into Excel and they include name, the absolute timestamp (unix epoch), the delta from the previous marks, and the total time since the time origin
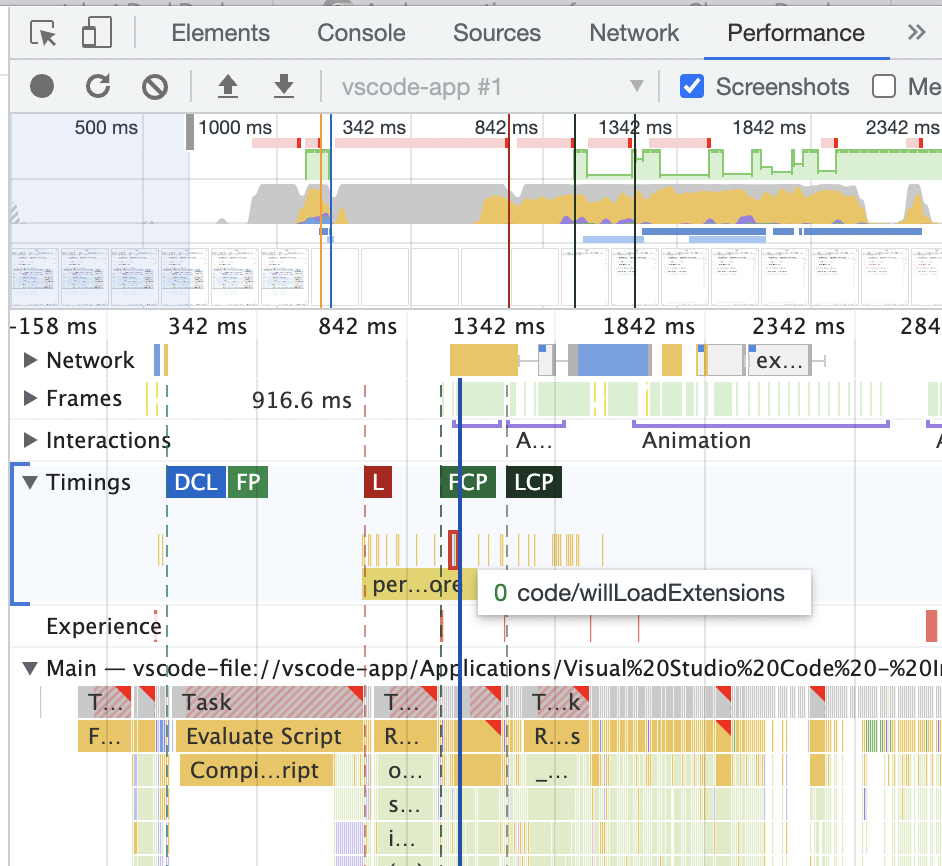
- Marks form the renderer are visible in the Performance-tab when recording while reload, like so
Emitting events can be a source of performance issues. Image an event with 100 listeners: if the average listener takes 2ms to execute then each fire costs 200ms. This slows down your component but isn't in your control. A fun exercise is to step into each listener to see what they do or to profile firing. This is quite laborious too and therefore you can get a high-level overview via EmitterOptions._profName. Do the following
- When creating your emitter, pass the
_profName-option. ❗This is dev-time only and MUST NOT be committed - Reload or execute the code in questions
- Run "F1 > Print Emitter Profiles"
- On the dev tools console and you'll see a summary including the listener count, the invocation count, total and average durations
(This isn't VS Code specific but dev tools)
Know that you can use console.profile and console.profileEnd to profile just some code. This useful to keep profiles small and focused on one area, e.g emitting of events, reading of contributions etc.
- Open dev tools
- From the
︙menu select "More tools > JavaScript Profiler" - Have and execute code like below
- The JavaScript Profiler tab will be populated with the profiles
You can start VS Code with a --prof-startup flag and it will automatically capture a profile of the main, renderer, and extension host process. Once it is done it asks you to restart and stores the files in your home directory. This is great to analyse the whole startup, esp of the built product.
console.profile('Hi');
// some code that you want to drill into
console.profileEnd('Hi');We use dependency injection and services for most parts of VS Code. Concrete service are registered via the registerSingleton-function and when a service consumer (actions, workbench- or editor-contribution, etc) is being created our instantiation service ensures that the services it needs are also created. This is often wasteful because most consumers don't need the service right away - e.g their constructors simply store the service-instance for later use. To counter that a concrete service can mark itself as supporting delayed instantiation - in that case the instantiation service gives consumers a proxy of the actual service which becomes "real" when needed or when there is some idle time.
It is highly recommended to register services with support for being instantiated delayed. Services are usually fit for this - a good indication is a more or less empty constructor and not relying on events to build up some state but build up state from other state and use events for updates only.
The instantiation service supports a trace mode. It records all invocations of createInstance and invokeFunction and know the overall cost of such a call and what creations it has caused. To use it, do the following
- Uncomment this line ❗ MUST NOT be committed and written so weirdly that this shouldn't happen by accident
- Run "F1 > Print Service Traces"
- On the dev tools console and you will see a trace for each instantiation and call
You can log all communication that happens between the renderer and its extension hosts. This gives you insight of how chatty and heavy communication is. Do the following
- Change this line ❗ MUST NOT be committed
- On the dev tools console and you will see a traces for each RPC message
Last but not least in the performance machines. We use a Windows laptop, mac mini and Linux mini PC as hardware to test VS Code Insiders and Exploration leveraging the https://github.com/Microsoft/vscode-perf-bot module.
Using wall-clock time we know it can start VS Code in a certain duration and it needs to proof that. We use the best of N runs, a slack message to the performance-channel send with the results.
Note that you DO NOT NEED access to the perf-machine. It's just a normal computer and if it runs slower things will also run slower locally. Likely not as dramatic because it is around 10 years old but still slower and something you can find locally. Rarely it is OS dependent: the perf-machine run windows 10 and macOS 12.x.
We started to log workbench contributions (registerWorkbenchContribution) that block the startup more than 5ms before editors have restored so that we can drill into them. Watch out for console messages in developer tools similar to this one:
WARN Workbench contribution WalkThroughSnippetContentProvider blocked restore phase by 7ms.
In that case, the idea is to either move the contribution out to a later phase or profile what takes long in the contribution.
We maintain a dashboard to show performance metrics for our Windows and macOS perf bots: https://dataexplorer.azure.com/dashboards/2e20491b-d517-40b5-bab4-269607f05221

For numbers across all insiders and stable releases and knobs for drilling into non-standard scenarios you can visit
