Feature tour
This tour will introduce you to the main tasks that can be accomplished with Outspline.
Each action on the interface can be performed in several alternative ways, which can however be grouped into two types: mouse-driven and keyboard-driven.
The mouse-driven usage of the interface should be very familiar to everybody and practically identical to any other graphical application:
- There is a main menu at the top that gives access to almost all the actions that can be done.
- Some elements of the interface have context menus that mirror specific actions from the main menu. These menus can be opened by right-clicking on particular interface elements, such as the tabs in the left and right notebooks, the database tree or various lists like the logs or the schedule.
- Some actions can however only be executed through buttons and other controls that are found in specific areas of the interface.
For an introduction to keyboard-driven interactions, see Keyboard shortcuts.
Throughout this tour, only mouse-driven interactions will be used in the examples, for conciseness, most often simply using an entry in the main menu.
Once Outspline is started for the first time, a blank window will appear. In order to start working on a database, a new one must be created by selecting the "File > New..." menu.

Please take one moment to distinguish the main areas of the interface. In the simplest case, the main window will only show the database tree, and by default the logs right below.

If more than one log is installed, their associated icons will appear in a vertical toolbar on the left. The logs panel can be hidden if needed from the main menu or the associated keyboard shortcut.
If there are item editors or plugin interfaces open, they will appear in a pane tiled next to the database tree.

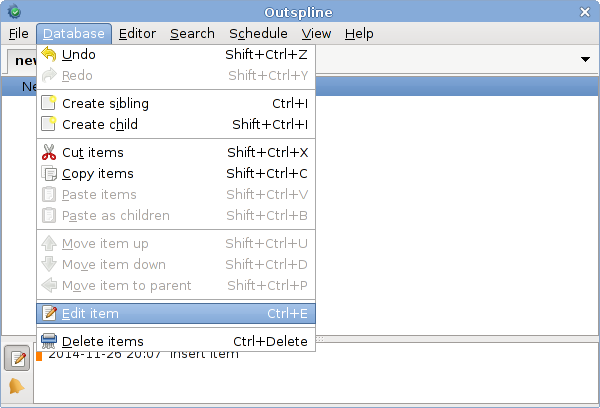
To create an item, select the dedicated action from the "Database" menu.

In order to edit the item, select the dedicated action from the menu.
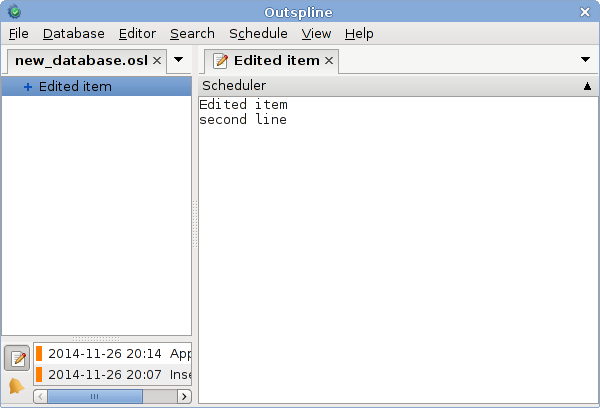
An editor tab will be opened in the right notebook: here it is possible to
change the item's text. If some editor plugins are installed, they will appear
above the text area: to access them, expand the respective bar by clicking on
it or highlighting it with Tab and pressing Enter or Space.
Now edit the item's text, also adding a second line of text, then apply the changes, using the dedicated menu action. You will see that the item label in the database tree is updated, also adding a "+" icon next to it: this icon indicates that the item has multiline text.
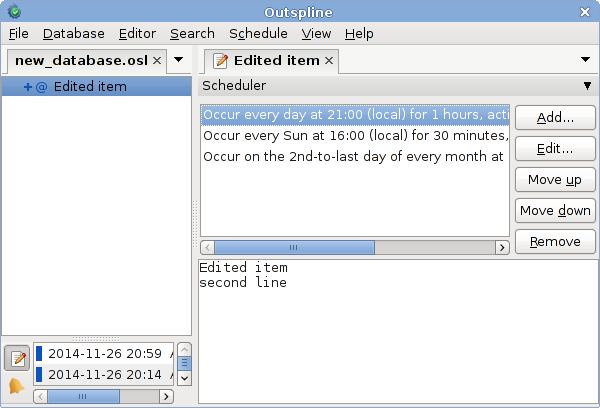
In the item's editor, above the text area, you can find the scheduler plugin, if installed and enabled: this allows associating event rules to an item. Click on its bar to expand its interface.

Multiple event rules can be associated to the same item, allowing to create complex recurrence scenarios. The rules here defined are computed from top to bottom, so that any except rules can be used to filter the rules above, but not those put below.
In order to add a new rule, select the "Add..." button: the rules list panel will be replaced by the rule editor. Here, set a recurrence rule like in the example below.

Several rule types can be selected with the choice widget. Each rule type has various controls to set. Each of them also has a "Time standard" option: "local" means that the selected dates and times will be based on the system local time, i.e. if the same database was opened in different terminals located in different time zones, the various events would always happen at the same local time; "UTC" means that the selected dates and times will be based on the UTC time, and will always happen at the set time wherever the system that opened the database is located.
Clicking on "OK" will close the rule editor and return to the rules list: you can see how the new rule is now displayed. You can add as many rules as you want this way, creating complex recurrence scenarios.
Again, use the dedicated menu action to apply the changes. You will see that the next to the item label in the database tree, a "@" icon has been added: this icon indicates that the item has scheduled events.
Let us now see the newly created events in the schedule view. If the schedule view is not open yet, you can open it from the "View > Schedule > Show panel" menu.
At the top you will see the navigator bar: this lets you set the filters to choose the time interval to be displayed. Try to change the filters so that a number of events are shown in the list. After changing some values in the filter, click on the "Apply" button to see the effect.
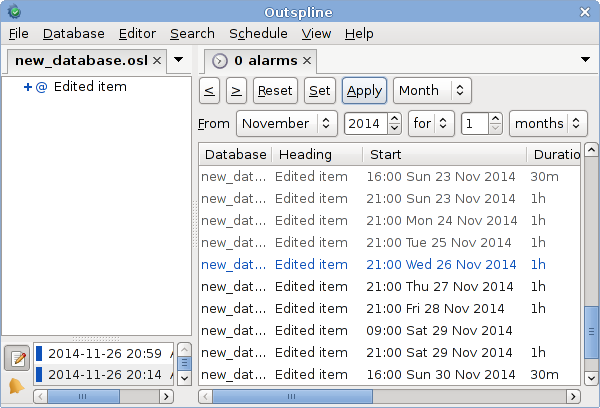
To complete the overview of the navigator, the "<" and ">" buttons respectively go back or forward by the currently set time interval (pagination); the "Reset" button restores the default view; the "Apply" button applies the filter set by the following controls; the "Set" button behaves like "Apply", but also stores the set filter as the new default, which will be used by "Reset" and when opening Outspline.
Next there are the specific filter buttons; the first choice control allows selecting one among "Relative", "Date" and "Month":
- "Relative" allows setting an interval that depends on the current time, and will automatically refresh the list when due. The next controls allow defining the filter in the "From N to N [time unit]" or "From N for N [time unit]" forms, where if N is a negative number, it represents a time distance in the past, while positive numbers are time distances in the future.
- "Date" sets a regular interval between two fixed dates, from midnight to midnight, in the form "From [date] to [date]" or "From [date] for N [time unit]".
- "Month" sets an irregular interval between two fixed month first days (at midnight), in the form "From [month] [year] to [month] [year]" or "From [month] [year] for N [time unit]".
By default, past events in the list are listed with a less contrasting font color; ongoing events are listed in blue; future events are listed with the normal font color.
The list can also be set to show gaps (unallocated time), in green, and overlappings (time intervals that are used by two or more events), in red.

Try now to set an item's event so that an alarm will be activated in the next minute. Once activated, you should have seen a notification appear, and the tray icon should have started blinking (if the correct plugins are installed and enabled). In order to stop the tray icon from blinking, left-click on it once.
In Outspline's window, you will see that the schedule notebook tab's label displays the number of active alarms: this is the total number, regardless of now many alarms actually fall within the time interval set in the navigator.
When an alarm is activated, it will be shown in the list with an amber color.

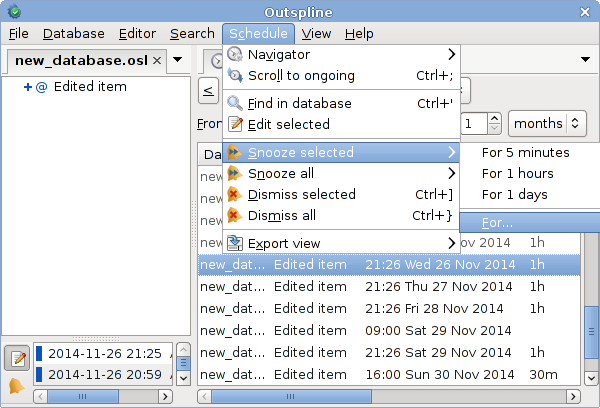
Alarms can be snoozed or dismissed with dedicated menu actions.
Items in the open databases can be searched with the dedicated search interface from the "Search > New search..." menu.

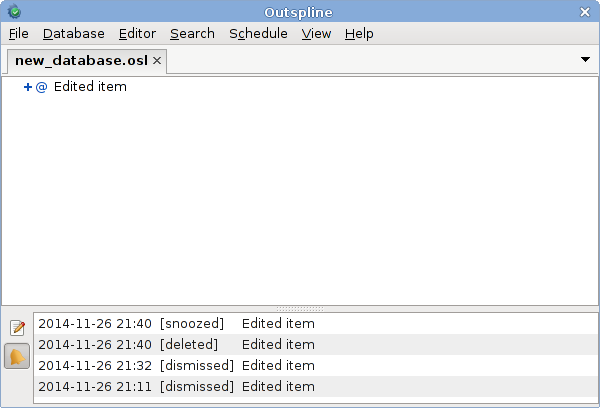
The log that displays the history of the database is associated to a small notebook icon with a pencil.

Entries with a blue rectangle at the left are actions that are done and saved in the database; entries with an amber rectangle are actions that are done but have not been saved yet; entries without a colored rectangle are actions that have been undone.
When active alarms are snoozed, dismissed or their associated items deleted, the action will be added to the alarms log, which is identified by a bell icon.
Note that action on alarms are treated separately from the other database actions, so undoing actions in the normal database history will never restore any closed alarms. Nonetheless, it is easy to find the item associated to an alarm in the log by right-clicking on it or using the keyboard shortcut shown next to the same action under the "View > Logs > Alarms > Find in database" menu.