TMA CD3 analysis
This tutorial goes through all the steps involved in a fast analysis of two tissue microarrays (TMAs) stained for CD3.
The intended output is a measurement of the average number of CD3-positive cells per mm2 tissue for each TMA core, which can then be associated with survival data for each patient.
Most steps are illustrated with videos. To view the full playlist, click here.
TMA dearraying (Watch)
First, identify the TMA cores using TMA → TMA dearrayer.
Pay attention to the core diameter and the row/column labels. The size of the grid will be figured out from the number of labels included, so if too few (or too many) cores are detected, then try adjusting these values.
(Note, it's usually ok to include too many labels, since QuPath will stop adding rows and columns when it can't find any more. Therefore the screenshot below specifies 16 columns, but QuPath only detects and labels the 14 that are actually present.)

Next, check that the TMA dearraying has been successful, and make any amendments that are required.
It is best to select the Move tool
to avoid accidentally drawing anything at this stage (the shortcut key is
m).
To move or resize a core, double-click on the core to select it, then either drag it to a new position or drag one of the little square handles to resize.
Other modifications that can be applied to the TMA grid or individual selected cores can be found by right-clicking on the image and seeing the options in the TMA menu that appears.
For example, cores that are considered unsuitable for analysis, can be marked as 'Missing' this way (as opposed to 'Valid'). By default, 'Missing' cores are shown in light blue and 'valid' cores in dark blue.

The TMA → Add and TMA → Remove submenus can also be used to add or remove rows and columns if needed. Where this is done, it is also necessary to relabel the TMA grid according to its new dimensions.
Estimate stain vectors (Watch)
While not an essential step in all cases, it is generally good practice to refine the stain estimates for each new image.
Doing so requires drawing an annotation around a region containing examples of each stain and background (whitespace).

After this, the Auto button under Analyze → Estimate stain vectors can be used to improve the stain values.

The process of estimating stain vectors is described in more detail here.
Tissue detection (Watch)
The TMA dearrayer generates a circular region for each individual tissue core, which is generally larger than the tissue itself.
Therefore in order to be able to assess the average number of CD3-positive cells per mm2 tissue for each TMA core, we need to detect the tissue within each detected core.
This can be done using Analyze → Preprocessing → Simple tissue detection.
The tissue detection parameters generally need some tweaking. To do this, double-click on one TMA core to select it, and try running the command with different parameters.

The first parameter to adjust is the Threshold. Typically, for a brightfield image this should be a value slightly lower than the average red, green and blue values within the background. Common values are in the range 220-240.
The red, green and blue values for any pixel are shown in the bottom-right pixel information as the cursor moves over the image.
Next, the Requested pixel size parameter determines the resolution at which the detection is run, in µm. High values generally mean a coarser result. Low values lead to a finer result.
For detecting large areas of tissue, e.g. a whole face section, you probably want a large value, e.g. 20 µm. For small regions of tissue, e.g. a TMA core, you probably want a smaller value, e.g. 2-5 µm.

The Minimum tissue area parameter defines the smallest piece of tissue that QuPath will retain. Smaller detected areas are discarded.
The Max fill area defines the largest 'hole' within the tissue that QuPath will automatically fill in. Larger holes will be retained.
You can explore some of the other parameters to see what they do. Dark background is really for fluorescence applications, rather than brightfield.
For this analysis, it is very important to keep the Single annotation option selected. This creates a single (possibly disjointed) annotation representing the tissue inside the core
Single annotation is needed in this case because QuPath will only give cell density measurements if there is one tissue annotation inside a TMA core. If more than one tissue annotation is present, QuPath gives no result, because it can't be sure which area of tissue it should be measuring and it doesn't want to guess.
Once you are happy with your parameters, it is often a good idea to check them across a few TMA cores first to ensure they continue to work well.
After that, simply double-click some background area to make sure no objects are selected. Then when you press Run on the tissue detection command, you have the option to tell QuPath to select all TMA cores for you.
You can also select all TMA cores explicitly with the Objects → Select... → Select TMA cores command. Either way, the appropriate cores need to be selected before the tissue detection is run.


Fast cell detection (Watch)
The Positive cell detection command introduced in the Detecting-objects section could be used here to find positive cells, although it requires a bit more time and effort than is really required.
In this case, we only require the number of cells - but not all the extra information required to measure or classify them.
An alternative command to use is therefore Analyze → Cell analysis → Fast cell counts. This works by only trying to find the center of all the nuclei it can - based on simply identifying peaks in smoothed, stain-separated images.
To help choose parameters, you can try out several combinations after double-clicking on a tissue annotation to select it.
It is important to select a tissue annotation, and not an entire TMA core.
The detection command will result in the contents of the select object being replaced by the detected cells... therefore if you select a core, the tissue identified inside will be removed and replaced with the detected cells only.

The first parameter to consider is the Cell detection channel. This basically makes it possible to switch between using the hematoxylin or DAB information for the cell detection, or a combination of both.
It is generally best to just try out each option and see what works best. You can also get a feeling for how the channels look using the methods described here.
The next important parameter is Gaussian sigma. This controls how much the image is smoothed before the peaks are detected. Small values tend to produce more peaks - but this can result in multiple detections within the same cell. High values can result in too few cells being detected. So you need to aim for a balance in between.
The Cell detection threshold and DAB threshold parameters determine how intensely stained a cell needs to be to be detected or considered positive, respectively.
Finally, the Detection object diameter does not impact on which cells are identified, but rather only the size of the circles used to represent them.

Other parameters can be tested out to see their effects, and resting the cursor over the names of the parameters results in some extra information being shown.
When assessing the results, it can help to display the cells filled in or unfilled, by pressing the
fshortcut key.

Once you are happy with the cell detection parameters, double-click in an area of background to ensure that nothing is selected.
Then press the Run button to run the command, and this time ensure that Process all Annotations is selected. This will then apply the cell detection across all the tissue annotations.


View the results (Watch)
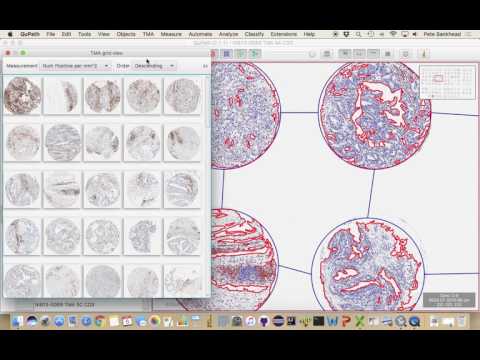
Having completed the tissue and cell detection steps above, QuPath will then automatically (and dynamically) calculate several values for each TMA core - including the percentage of detected cells that are considered positive, and the average number of CD3-positive cells per mm2 tissue.
One way to visualize these is under TMA → TMA grid summary view. You can also use Measure → Show TMA measurements.

Import TMA map & survival data (optional) (Watch)
Having got this far, you may then find that you want to associate the measurements with survival information for individual patients.
This requires two steps:
- Import a TMA map to associate a unique (patient) ID with each TMA core
- Align the survival data for each patient with the core, according to ID
A TMA map is simply a grid that is the same size as the TMA grid, and which contains a 'Unique ID' for each TMA core.
In this case the 'uniqueness' refers to the patient from whom the tissue sample was taken. Consequently, it is possible for multiple cores within a slide to have the same Unique ID, if the tissue belongs to the same patient. But no two patients should have the same Unique ID.
Such a grid can be created in a spreadsheet application such as Microsoft Excel. The Unique IDs can be any combination of letters and numbers, but they should not contain newlines or tab characters.

Once such a grid is created, it can simply be copied to the clipboard. To put it into QuPath, run File → Import TMA map and select Paste TMA grid.
If a grid will be reused often, it helps to save it into a tab-delimited file with the extension
.qpmap. Then it can be imported quickly simply by dragging the.qpmapfile onto QuPath.

Once the Unique IDs have been assigned to each TMA core, further data can be added.
To do this, create a spreadsheet containing one column with the (exact) heading Unique ID.
If you would like to import overall survival data, then two columns are required with the headings:
- Overall survival, which gives the survival/follow-up time (typically in months, although any units may be used)
- OS censored, containing 1 if the event is censored (i.e. the patient is alive at last follow up), or 0 if the event is observed (i.e. the overall survival column gives the time to date of death).
Warning! Be very careful when adding 'censored' information. Other statistical packages require a column to indicate 'observed' rather than 'censored', in which case the ones and zeros are switched.
If you would like to import recurrence-free survival data, then the comparable column titles are Recurrence-free survival and RFS censored.

Any other columns containing corresponding data can be added, with any headings. If the column contains all numeric data, then the values will be imported as numeric measurements - otherwise they will be imported as text.

View survival analysis in the TMA data viewer (Watch)
Having imported the Unique IDs and survival data, File → Launch TMA data viewer will open QuPath's TMA data viewer to explore the results.

This provides a way to look at the distributions of different values and calculate survival curves.

QuPath is not intended to replace a full statistical software application, and it is essential to validate all results generated using QuPath using another method (e.g. R's survival package, or a commercial statistical program).
QuPath's survival analysis tools are really intended to provide a first look at the results.
Finally, if you wish to apply the same analysis across other TMA slides, you could simply repeat all the steps above - made slightly easier by having already determined which parameters to use for the various commands.
There is, however, a better way. This is to generate a script to automate the process.
While the thought of generating a script may be quite unappealing if you have never programmed anything before, the good news is that QuPath has already done most of the hard work for you.
Under the Workflow tab in QuPath, the Command history has been watching your activities until now, logging the most important commands that were run along with their parameters.
Below this sit two buttons: Create workflow and Create script. You can use either, but if you don't like the thought of programming then Create workflow is the best to start with.
Working with workflows (Watch)
The Create workflow button basically creates a version of your command history that you can edit.

At the top of the workflow is a list of commands. Selecting one of these then results in the associated parameters being shown below.
The unfortunate thing is, usually the workflow contains far too many commands. Each time you ran a command, this was logged along with the parameters used. But very often, it's only actually the last time you ran a command that matters. Therefore you should manually remove all the unnecessary entries.
Entries can be removed by selecting them, then right-clicking and choosing Remove selected items.

Choosing which items to remove requires a bit of consideration about what commands you ran, and what you wanted to achieve. But generally, a cleaned-up script for TMA analysis has the following components:
- Set image type at the start, to specify e.g. if you have a brightfield or fluorescence image
- If you have a brightfield image, you usually have Set color deconvolution stains - if you ran the Estimate stain vectors command, make sure to keep the version of Set color deconvolution stains that includes the settings here
- TMA dearrayer to identify cores
- Select objects by class, with the parameter Type: TMA core. This is what selects all your TMA cores for the next command to work.
- Whatever command you wanted to apply to each core, e.g. Positive cell detection or Simple tissue detection
You may also have additional subsequent combinations of Select objects by class and then some other processing command. That is the case in this example, where annotations need to be selected after the tissue detection and before the cell detection.
Creating the script (Watch)
Once your workflow looks ok, and like it should contain everything necessary, you can press the Create script button below the workflow.
This will generate the code to replicate the analysis, and show it inside QuPath's Script editor.

To run the script, simply choose Run → Run from the Script Editor menu.

The final script created in this example is shown below.
setImageType('BRIGHTFIELD_H_DAB');
if (!isTMADearrayed()) {
	runPlugin('qupath.imagej.detect.dearray.TMADearrayerPluginIJ', '{"coreDiameterMM": 1.2,  "labelsHorizontal": "1-16",  "labelsVertical": "A-J",  "labelOrder": "Row first",  "densityThreshold": 5,  "boundsScale": 105}');
	return;
}
setColorDeconvolutionStains('{"Name" : "H-DAB CD3", "Stain 1" : "Hematoxylin", "Values 1" : "0.7216 0.60549 0.33568 ", "Stain 2" : "DAB", "Values 2" : "0.23202 0.51233 0.82685 ", "Background" : " 242 241 241 "}');
selectTMACores();
runPlugin('qupath.imagej.detect.tissue.SimpleTissueDetection2', '{"threshold": 235,  "requestedPixelSizeMicrons": 4.0,  "minAreaMicrons": 10000.0,  "maxHoleAreaMicrons": 1000.0,  "darkBackground": false,  "smoothImage": true,  "medianCleanup": true,  "dilateBoundaries": false,  "smoothCoordinates": true,  "excludeOnBoundary": false,  "singleAnnotation": true}');
selectAnnotations();
runPlugin('qupath.opencv.CellCountsCV', '{"stainChannel": "Hematoxylin",  "gaussianSigmaMicrons": 2.0,  "backgroundRadiusMicrons": 15.0,  "doDoG": true,  "threshold": 0.1,  "thresholdDAB": 0.2,  "detectionDiameter": 25.0}');
You should be able to match the lines in the script to the entries in the workflow.
You might naturally expect that the script would perform the full analysis in one go: detect the TMA cores, detect the tissue, detect the cells.
However, you will likely find that it does not.
The reason for this is that the part of the script generated by the TMA command tries to be a bit smart.
if (!isTMADearrayed()) {
	runPlugin('qupath.imagej.detect.dearray.TMADearrayerPluginIJ', '{"coreDiameterMM": 1.2,  "labelsHorizontal": "1-16",  "labelsVertical": "A-J",  "labelOrder": "Row first",  "densityThreshold": 5,  "boundsScale": 105}');
	return;
}
Basically, what this does is it first checks if the TMA has been dearrayed. If it has, then it carries on without dearraying again.
However, if the slide has not been dearrayed, then the dearrayer is applied with the recorded parameters, and the script immediately stops (i.e. it 'returns').
The reason for this is that it is really essential to check the dearraying each time, and refine it if required. This is much better than waiting until the full analysis is complete, and then discovering that the cores were not detected properly.
For this reason, to perform the full analysis it's necessary to run the script twice... first to dearray, and then second (after checking the dearrayed slide) to perform all the detection.
