Mac
Table of Contents
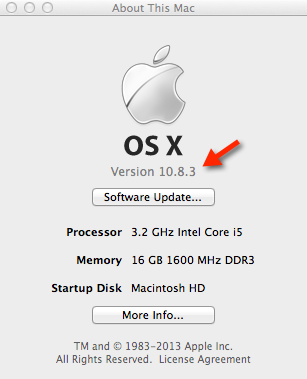
Before you analyze a memory dump with Volatility, figure out what version of OSX you're dealing with. To do this, click the Apple icon in the top left corner of your Mac's screen and choose About This Mac. Look at the Version number, as shown below.
To verify your architecture, use the following command. If you see "RELEASE_X86_64 x86_64" then choose the AMD 64-bit profile. If you see "RELEASE_I386 i386" then choose the Intel 32-bit profile.
$ uname -a | cut -d/ -f2
RELEASE_X86_64 x86_64
Note: Some Macs ship with kernels capable of running in 32-bit or 64-bit mode. Even if you see "RELEASE_I386 i386" it may be possible to boot your system into 64-bit mode. To check, run the file command on your /mach_kernel. As you can see, the machine below can run as i386 (32-bit), x86_64 (64-bit), or ppc.
$ file /mach_kernel
/mach_kernel: Mach-O universal binary with 3 architectures
/mach_kernel (for architecture x86_64): Mach-O 64-bit executable x86_64
/mach_kernel (for architecture i386):   Mach-O executable i386
/mach_kernel (for architecture ppc):    Mach-O executable ppc
Assuming you wanted to switch to a different mode, for testing purposes, you can do the following and then reboot. For more information see Apple Support HT3773.
$ sudo systemsetup -setkernelbootarchitecture x86_64
setting kernel architecture to: x86_64
changes to kernel architecture have been saved.
Pre-built Mac OS X profiles are available from volatilityfoundation/profiles Github repository. Copy the individual profiles that you want to activate into your volatility/plugins/overlays/mac folder.
- Leopard 10.5 (32-bit)
- Leopard 10.5.3 (32-bit)
- Leopard 10.5.4 (32-bit)
- Leopard 10.5.5 (32-bit)
- Leopard 10.5.6 (32-bit)
- Leopard 10.5.7 (32-bit)
- Leopard 10.5.8 (32-bit)
- Snow Leopard 10.6 (32 and 64-bit)
- Snow Leopard 10.6.1 (32 and 64-bit)
- Snow Leopard 10.6.2 (32 and 64-bit)
- Snow Leopard 10.6.4 (32 and 64-bit)
- Snow Leopard 10.6.5 (32 and 64-bit)
- Snow Leopard 10.6.6 (32 and 64-bit)
- Lion 10.7 (32 and 64-bit)
- Lion 10.7.1 (32 and 64-bit)
- Lion 10.7.2 (32 and 64-bit)
- Lion 10.7.3 (32 and 64-bit)
- Lion 10.7.4 (32 and 64-bit)
- Lion 10.7.5 (32 and 64-bit)
- Mountain Lion 10.8.1 (64-bit)
- Mountain Lion 10.8.2 (64-bit)
- Mountain Lion 10.8.3 (64-bit)
- Mavericks 10.9.1 (64-bit)
- Mavericks 10.9.2 (64-bit)
- Mavericks 10.9.3 (64-bit)
- Mavericks 10.9.4 (64-bit)
- For Yosemite, El Capitan, and other releases, see the profile repository listing
If you need to perform memory analysis on a version of Mac OSX that isn't in the list above, you will need to build your own profile.
You will need the Volatility source code (i.e. not the standalone Windows executable) from the Releases page or the GitHub repository.
To create a profile, you first need to download the KernelDebugKit for the kernel you want to analyze. This can be downloaded from the Apple Developer's website (click OS X Kernel Debug Kits on the right). This account is free and only requires a valid Email address.
After the DebugKit is downloaded, mount the dmg file. This will place the contents at "/Volumes/KernelDebugKit".
The first step is to get the dwarf (debug) info from the kernel. The following shows how this can be done for the 32 bit debug information:
$ dwarfdump -arch i386 -i /Volumes/KernelDebugKit/mach_kernel.dSYM > 10.7.2.32bit.dwarfdump
You would use "-arch x86_64" for the 64 bit information.
The next step is to convert the Mac dwarfdump output to the Linux style output supported by Volatility:
$ python tools/mac/convert.py 10.7.2.32bit.dwarfdump converted-10.7.2.32bit.dwarfdump
Create the vtypes file from the converted file. It is required that you give the output file a .vtypes extension.
$ python tools/mac/convert.py converted-10.7.2.32bit.dwarfdump > 10.7.2.32bit.vtypes
Generate symbols in the following manner. It is required that you give the output file a .symbol.dsymutil extension.
$ dsymutil -s -arch i386 /Volumes/KernelDebugKit/mach_kernel > 10.7.2.32bit.symbol.dsymutil
Create a zip archive of the .vtypes and .symbol.dysmutil files that you've created.
$ zip 10.7.2.32bit.zip 10.7.2.32-bit.symbol.dsymutil 10.7.2.32bit.vtypes
The zip file is now what you use as the profile. Copy the profile into the "volatility/plugins/overlays/mac" directory and then run:
$ python vol.py --info | grep Mac
and find the name of your profile. This is what you will use to the --profile option.
Volatility does not provide the ability to acquire memory. We recommend using Mac Memory Reader from ATC-NY, Mac Memoryze, or OSXPmem for this purpose. Remember to check the list of supported OS versions for each tool before using them.
To find all currently available plugins, use the following command. For more information on what these plugins do and how to use them correctly, see the Mac Command Reference page.
$ python vol.py --info | grep mac_
mac_adium                  - Lists Adium messages
mac_apihooks               - Checks for API hooks in processes
mac_apihooks_kernel        - Checks to see if system call and kernel functions are hooked
mac_arp                    - Prints the arp table
mac_bash                   - Recover bash history from bash process memory
mac_bash_env               - Recover bash's environment variables
mac_bash_hash              - Recover bash hash table from bash process memory
mac_calendar               - Gets calendar events from Calendar.app
mac_check_mig_table        - Lists entires in the kernel's MIG table
mac_check_syscall_shadow   - Looks for shadow system call tables
mac_check_syscalls         - Checks to see if system call table entries are hooked
mac_check_sysctl           - Checks for unknown sysctl handlers
mac_check_trap_table       - Checks to see if mach trap table entries are hooked
mac_compressed_swap        - Prints Mac OS X VM compressor stats and dumps all compressed pages
mac_contacts               - Gets contact names from Contacts.app
mac_dead_procs             - Prints terminated/de-allocated processes
mac_dead_sockets           - Prints terminated/de-allocated network sockets
mac_dead_vnodes            - Lists freed vnode structures
mac_dmesg                  - Prints the kernel debug buffer
mac_dump_file              - Dumps a specified file
mac_dump_maps              - Dumps memory ranges of process(es), optionally including pages in compressed swap
mac_dyld_maps              - Gets memory maps of processes from dyld data structures
mac_find_aslr_shift        - Find the ASLR shift value for 10.8+ images
mac_get_profile            - Automatically detect Mac profiles
mac_ifconfig               - Lists network interface information for all devices
mac_ip_filters             - Reports any hooked IP filters
mac_keychaindump           - Recovers possbile keychain keys. Use chainbreaker to open related keychain files
mac_ldrmodules             - Compares the output of proc maps with the list of libraries from libdl
mac_librarydump            - Dumps the executable of a process
mac_list_files             - Lists files in the file cache
mac_list_kauth_listeners   - Lists Kauth Scope listeners
mac_list_kauth_scopes      - Lists Kauth Scopes and their status
mac_list_raw               - List applications with promiscuous sockets
mac_list_sessions          - Enumerates sessions
mac_list_zones             - Prints active zones
mac_lsmod                  - Lists loaded kernel modules
mac_lsmod_iokit            - Lists loaded kernel modules through IOkit
mac_lsmod_kext_map         - Lists loaded kernel modules
mac_lsof                   - Lists per-process opened files
mac_machine_info           - Prints machine information about the sample
mac_malfind                - Looks for suspicious process mappings
mac_memdump                - Dump addressable memory pages to a file
mac_moddump                - Writes the specified kernel extension to disk
mac_mount                  - Prints mounted device information
mac_netstat                - Lists active per-process network connections
mac_network_conns          - Lists network connections from kernel network structures
mac_notesapp               - Finds contents of Notes messages
mac_notifiers              - Detects rootkits that add hooks into I/O Kit (e.g. LogKext)
mac_orphan_threads         - Lists threads that don't map back to known modules/processes
mac_pgrp_hash_table        - Walks the process group hash table
mac_pid_hash_table         - Walks the pid hash table
mac_print_boot_cmdline     - Prints kernel boot arguments
mac_proc_maps              - Gets memory maps of processes
mac_procdump               - Dumps the executable of a process
mac_psaux                  - Prints processes with arguments in user land (**argv)
mac_psenv                  - Prints processes with environment in user land (**envp)
mac_pslist                 - List Running Processes
mac_pstree                 - Show parent/child relationship of processes
mac_psxview                - Find hidden processes with various process listings
mac_recover_filesystem     - Recover the cached filesystem
mac_route                  - Prints the routing table
mac_socket_filters         - Reports socket filters
mac_strings                - Match physical offsets to virtual addresses (may take a while, VERY verbose)
mac_tasks                  - List Active Tasks
mac_threads                - List Process Threads
mac_threads_simple         - Lists threads along with their start time and priority
mac_trustedbsd             - Lists malicious trustedbsd policies
mac_version                - Prints the Mac version
mac_volshell               - Shell in the memory image
mac_yarascan               - Scan memory for yara signatures