Theia trace viewer extension using the tsp-typescript-client (https://github.com/theia-ide/tsp-typescript-client) and Trace Server Protocol (https://github.com/theia-ide/trace-server-protocol).
Prerequisites for running this extension are the same as those for running the theia IDE.
Click the Gitpod button below to access a live demo of the trace viewer. In a couple clicks and around 2 minutes you'll be on your way.
Prerequisites: A GitHub account (for logging into Gitpod)
- Click here to open Gitpod.
- After logging in, it takes around a minute for Gitpod to set up the in-browser IDE used to build the project.
- When the workspace has loaded, the project builds automatically in about a minute. Then, the workspace pops a notification saying a service (i.e. the tool) is now available.

- After opening the tool via the notification, the interface loads in a few seconds.
- Now you're ready to try the trace viewer!
- Head to the trace explorer tab in the left side menu to get started.
- The tool is already loaded with example traces from a set of Trace Visualisation Labs, so no need to hunt for your own.

We plan to distribute this extension on npm.
Availability: TBD
Here is the step in order to build the trace viewer
- Clone this theia-trace-extension repository
cd theia-trace-extension- Now you are ready to build the application:
yarn
Note for some debian-based machines: On some distros, there are 2 yarn commands. If you get an error message saying ERROR: There are no scenarios; must have at least one., you are using the wrong yarn. See yarnpkg/yarn#2821.
This repository contains an example trace-viewer application that includes the trace extension. It has two versions:
- browser: a "browser" application, accessed with a web browser
- electron: a native desktop application
In order to open traces you need a trace server running on the same machine as the trace extension. You can download the Eclipse Trace Compass server or let yarn download and run it:
  $ yarn download:server
  $ yarn start:server
You can also build the trace-server yourself using Trace Compass and the Incubator, take a look at the instructions here.
From the repo root, run either
$ yarn start:browserAnd go to http://localhost:3000.
or
$ yarn start:electronAnd use the Electron application.
By default, the trace server is expected to be on responding at http://localhost:8080/tsp/api. If it is not the case, the URL can be changed using the TRACE_SERVER_URL environment variable when running the app.
For example, to start the browser example app with a specific URL, one can run
$ TRACE_SERVER_URL=https://my.trace.server:port/tsp/api yarn start:browserIt's possible to package the repo's example application with electron-builder. After running yarn in the repo root, do:
  $ cd electron-app
  $ yarn package
The configured Linux packaging(s) will be generated folder electron-app/dist
This section describes how to operate the Theia trace extension to view and analyze traces. The UI, view interactions, and UX are prelimiary and subject to revisions in the future.

To open a trace in the Theia Trace Extension, use the File Explorer in Theia to navigate to the trace directory. Then right-mouse click on the trace and select menu Open With->Open Trace.
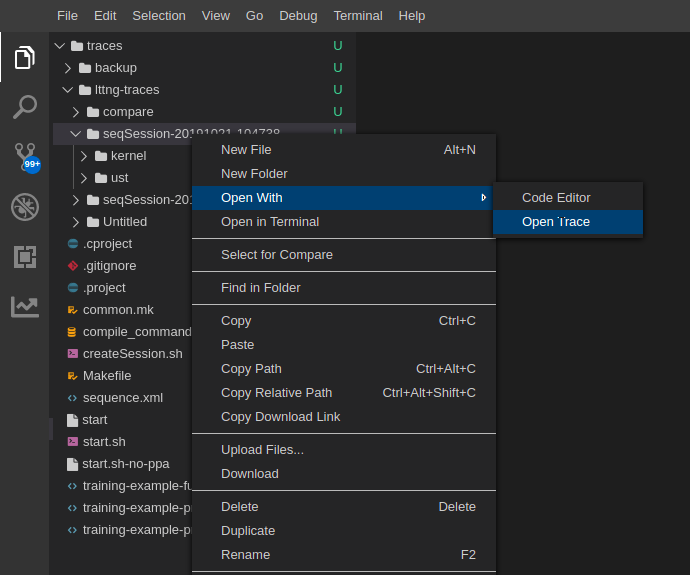
If the selection is a single file, then the tool will open the file directly as a trace.
If the selection is a directory, then the tool will look for traces in Common Trace Format (CTF) format, such as Linux Tracing Toolkit traces (LTTng) Kernel and UST (Userspace) traces, and open all found CTF traces together under the same timeline. The trace events of each CTF trace will be analyzed in chronological order. With this you're able to open e.g. LTTng Kernel and UST Traces at the same time.
The example Trace Compass trace server above supports LTTng Kernel and UST traces. Example LTTng traces can be retrieved from the Trace Compass Tutorials. Just download the archive TraceCompassTutorialTraces, extract them into a local directory on your computer. They can also be automatically downloaded by running yarn download:sample-traces from the repository's root.
To open the Trace Explorer, select menu View from the top-level menu and then select Trace Explorer in the list of views. Then the Trace Explorer icon will be added on the right side below the File Explorer Icon.
Select the Trace Explorer icon to switch to the trace explorer.

Now, you will see 3 sections: Opened Traces, Available Analyses and Time Graph Tooltip. Select the trace that you opened and the available analyses will be populated. Now you can select different analysis and the graphs will be added into a single container view for that trace.
There is only a limited number of such operations and they are only implemented in the Time Graph views (the ones looking like Gantt charts). For Zoom-in/out use CTRL+mouse wheel. Or use left mouse drag on time axis on top. Navigating the trace you can use the scrollbar at the bottom of the trace timeline container.
Currently, the Time Graph Tooltip is populated when selecting a state in a Time Graph view.