Theia trace viewer extension using the tsp-typescript-client and Trace Server Protocol.
Prerequisites for running this extension are the same as those for running the Theia IDE.
👋 Want to help? Read our contributor guide and follow the instructions to contribute code.
Tracing is another tool in the developer or sysadmin's toolbox. It is best used to understand very complex systems, or even simple ones, but the real added value comes when trying to understand complexity when all other approaches fail.
- Read more about when tracing is required for understanding a problem.
Tracing consists in recording specific information during a program's or operating system's execution to better understand what is happening on the system. Every location in the code that we want to trace is called a tracepoint and every time a tracepoint is hit is called an event.
The tracing we're discussing here is high speed, low overhead tracing. With such tracing, the tracepoints can be present in the code at all times (linux has tons of tracepoints in its code, ready to be hooked to), they have a near-zero overhead when not tracing and a very low one one with a tracer enabled. Tracers can handle hundreds of thousands events/second.
- Learn more about tracing here.
Source: Text adapted from tracevizlab 001-what-is-tracing
Prerequisite: A GitHub account (for logging into the demo)
You can access a live demo of the trace viewer here. The following video also shows how try the live demo.
Click the Gitpod button below to access a live demo of the trace viewer. In a couple of clicks and around 2 minutes, you'll be on your way!
Prerequisite: A GitHub account (for logging into Gitpod)
- Click here to open Gitpod.
- After logging in, it takes around a minute for Gitpod to set up the in-browser IDE used to build the project.
- When the workspace has loaded, the project builds automatically in about a minute. Then, the workspace pops a notification saying a service (i.e. the tool) is now available. Open the application in the browser.
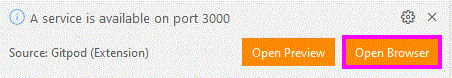
- If you don't see a notification, follow this alternative way to open the application.
- After opening the tool, the interface loads in a few seconds.
- Now you're ready to try the trace viewer!
- Head to the trace viewer tab in the left side menu to get started.
- Click the "Open Trace" button, and then select a directory containing traces, e.g. “103compare-package-managers → apt”
- The tool is loaded with the example traces from a set of Trace Visualization Labs. To analyze your own traces, download the application for Linux.
If you'd like to explore your own traces, you can download a Theia IDE build with this trace viewer extension here
- Prerequisite: Java 17 (required since this tool uses the Eclipse Trace Compass server which runs on Java)
- If you get a confusing error "Error opening serial port ${this.port}. (Port busy)" when you try to run the app, it's likely that Java is missing.
- No compilation or additional downloads necessary! Just change the AppImage file's permissions to make it executable (command:
chmod +x <filename>) and run it.
The theia-trace-extension project publishes the following packages to npm:
- theia-traceviewer: The Theia trace viewer extension. Add this package to the package.json of your Theia application.
- traceviewer-base: This package contains trace management utilities for managing traces using Trace Server applications that implement the TSP.
- traceviewer-react-components: This package contains views and utilities for visualizing traces and logs via the TSP connected to a Trace Server application.
While being initially used within the theia-traceviewer, the code base of traceviewer-base and traceviewer-react-components is independent of any Theia APIs and can be integrated into other web applications.
First, you need Node.js and yarn:
It's suggested to install nvm to manage node on your machine. Once that's done, install the required version:
   nvm install 18
   # optional: make it the default version
   nvm alias default
   # or set it every time like so
   nvm use 18
Then install yarn:
npm i -g yarn # the default version should be okHere is the step in order to build the trace viewer
- Clone this theia-trace-extension repository
cd theia-trace-extension- Now you are ready to build the application:
yarn
You can also run two scripts to watch for changes and rebuild automatically:
-
From the root, run:
yarn tswatch # to compile TypeScript files -
In parallel, run:
cd examples/<browser or electron>
yarn watch # to update the frontend bundles (loaded by the browser)
This repository contains an example trace-viewer application that includes the trace extension. It has three versions:
- browser: a "browser" application, accessed with a web browser
- electron: a native desktop application
- docker: a Docker-izable "browser" application, accessed with a web browser
You can find those example applications under examples/.
In order to open traces, you need a trace server running on the same machine as the trace extension. You can download the Eclipse Trace Compass server or let yarn download and run it:
yarn download:server
yarn start:server
You can also build the trace-server yourself using Trace Compass and the Incubator. Take a look at the instructions here.
From the repo root, run either
yarn start:browserand go to http://localhost:3000.
Or, run
yarn start:electronand use the Electron application.
If there are errors that occurred while starting the app, see Troubleshooting for known issues.
By default, the application expects the trace server to be responding at http://localhost:8080/tsp/api. If a different trace server location is being used, the URL can be changed using the TRACE_SERVER_URL environment variable when running the app.
For example, to start the browser example app with a specific URL, one can run
TRACE_SERVER_URL=https://my.trace.server:port/tsp/api yarn start:browserIt is possible to package the repository's example application with electron-builder. After running yarn in the repo root, run:
cd examples/electron
yarn package
The configured Linux package(s) will be generated in the examples/electron/dist folder:
cd dist
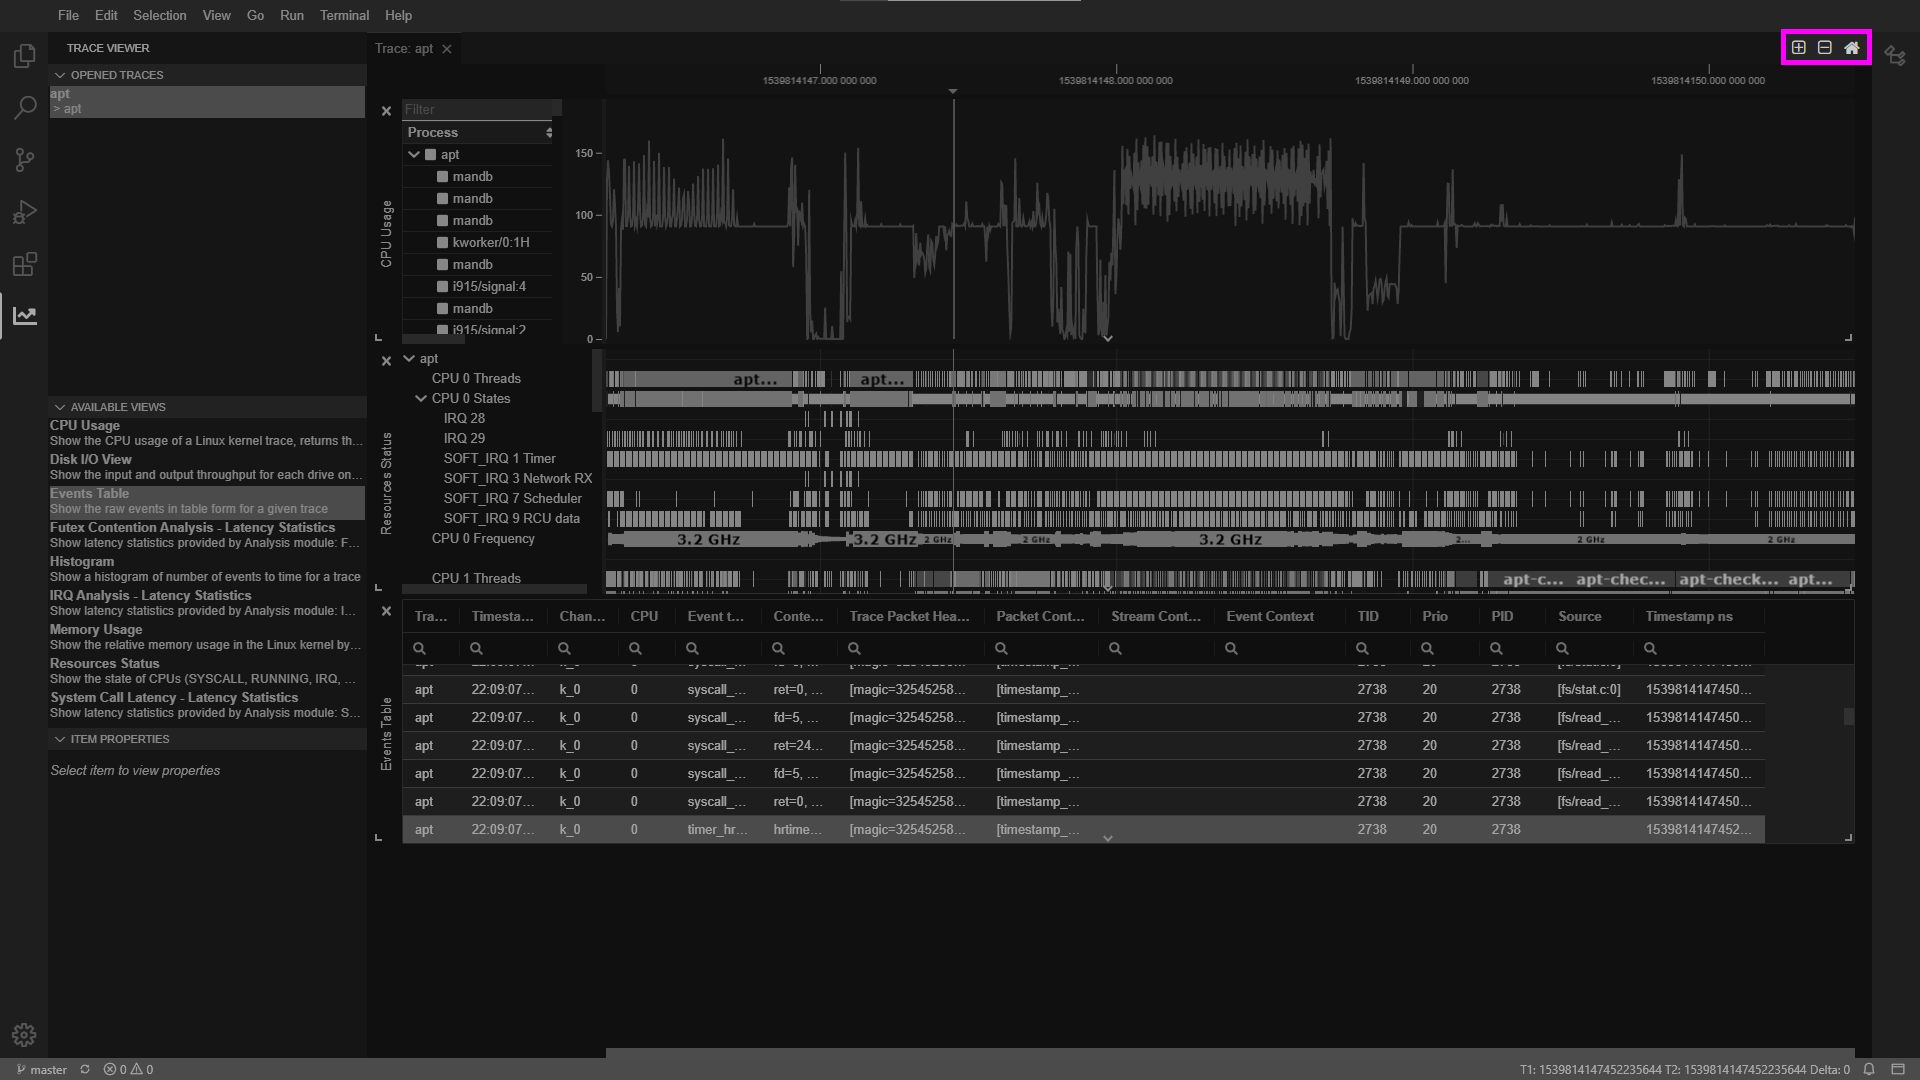
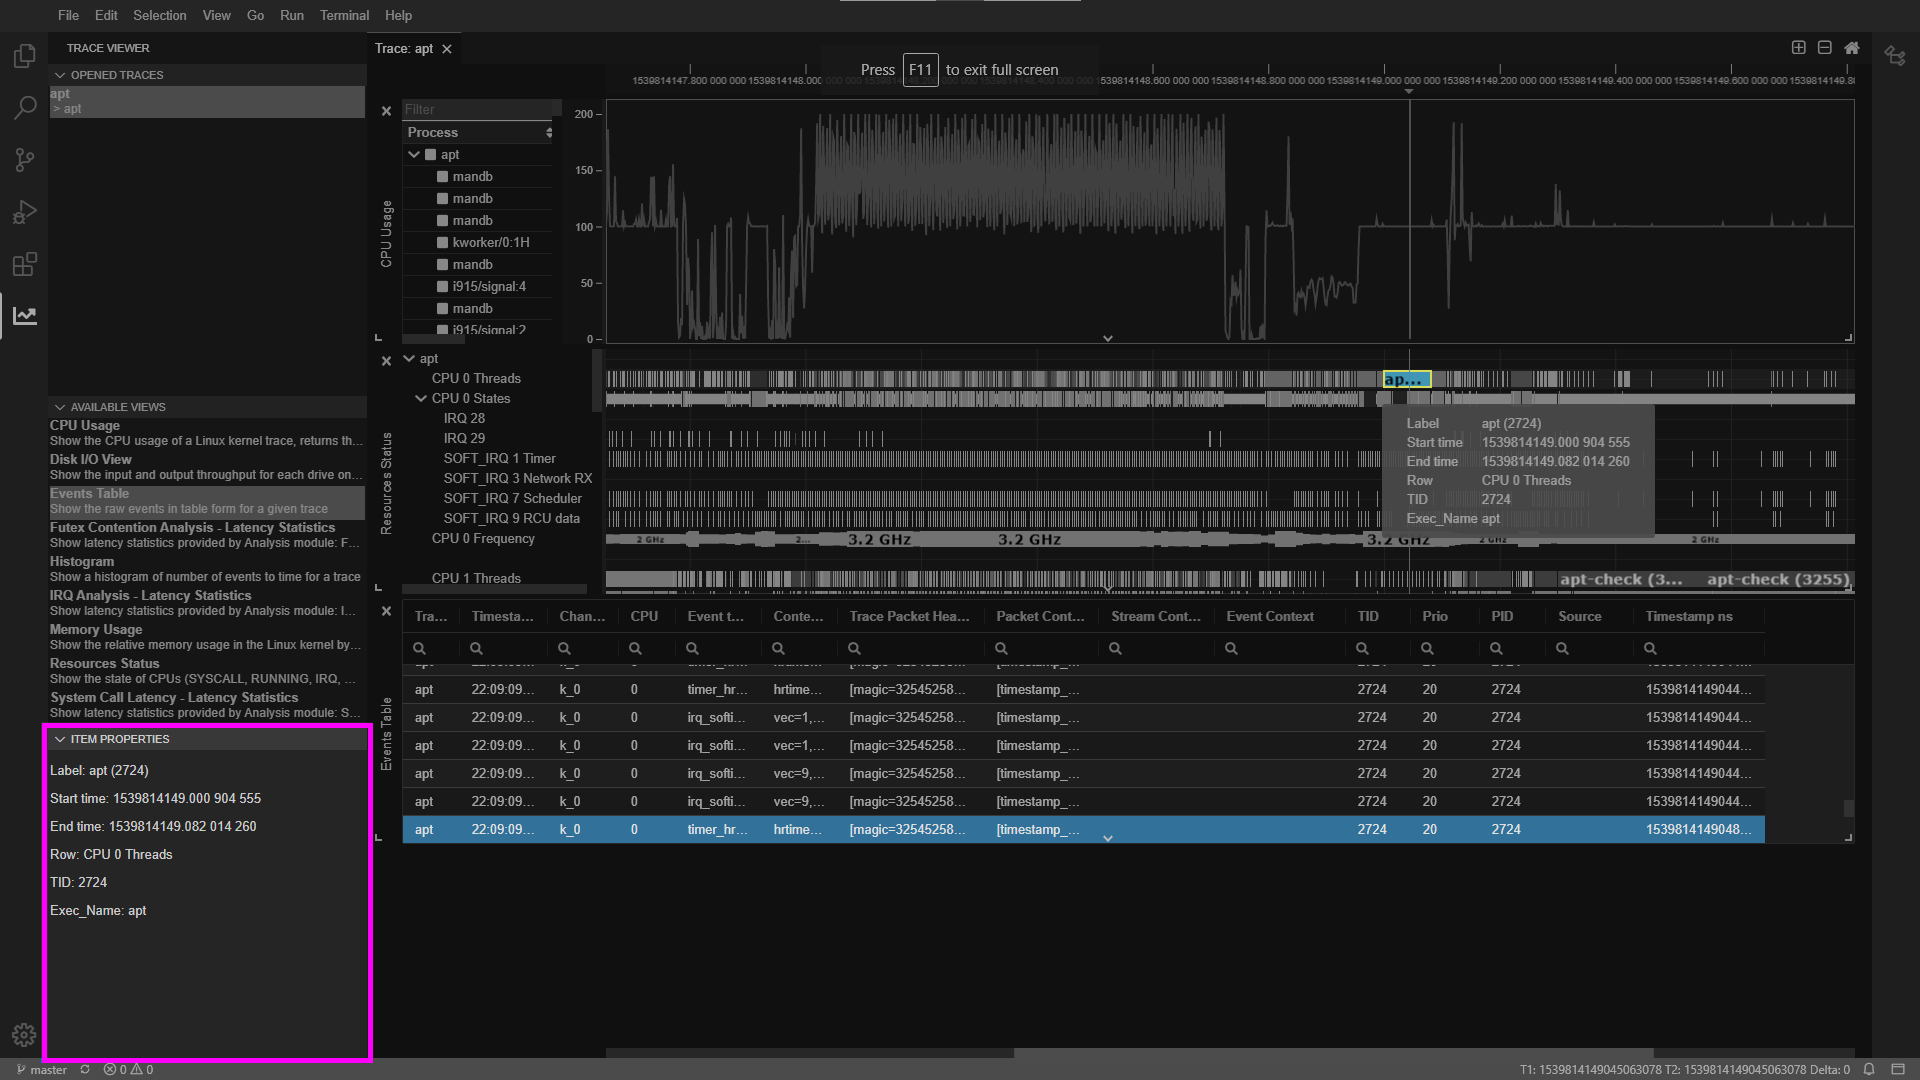
./Theia\ Trace\ Example\ Application-0.1.0.AppImageThis section describes how to operate the Theia trace extension to view and analyze traces. The UI and view interactions are preliminary and subject to revisions in the future.
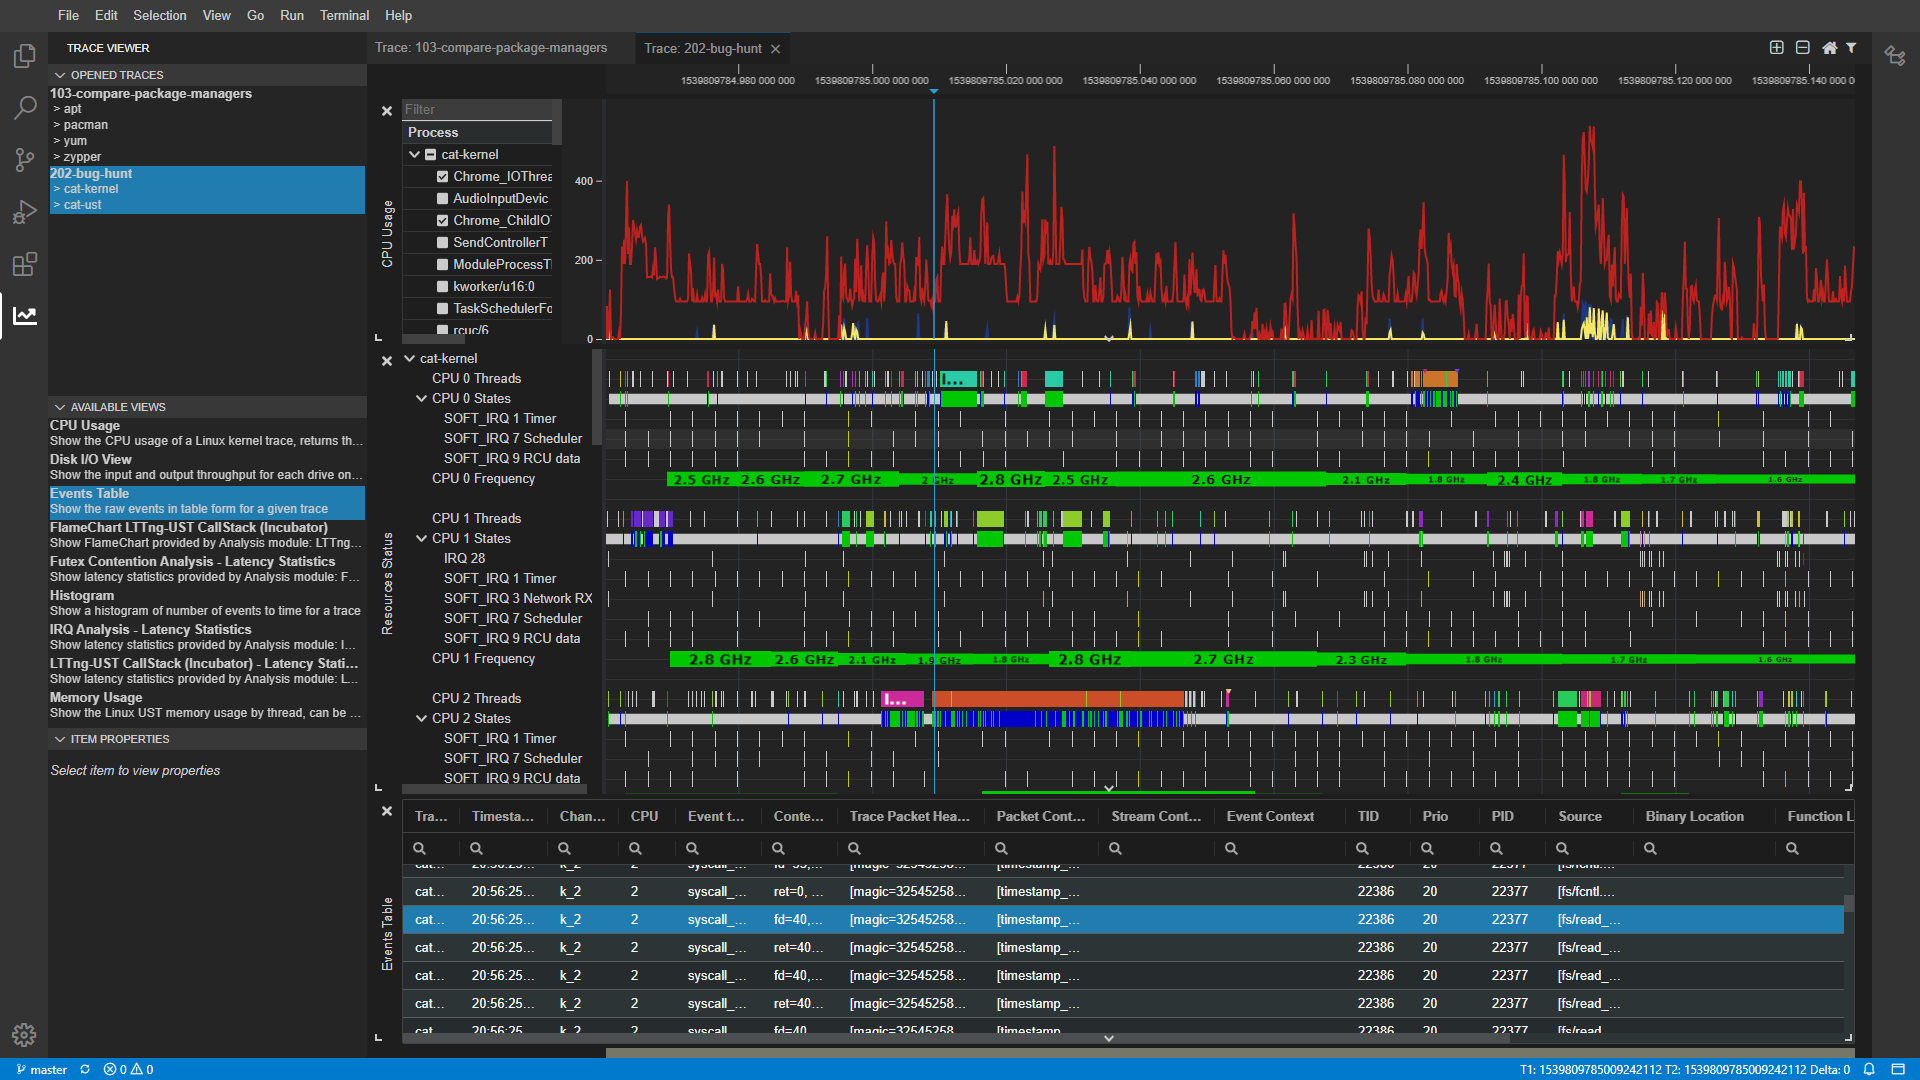
To open the Trace Viewer, select the Trace Viewer icon in the left sidebar:
![]()
If the Trace Viewer icon is not in the left sidebar, select menu View from the top-level menu and then select Trace Viewer in the list of views. The Trace Viewer icon will appear on the left, below the File Explorer Icon.
There are a few ways to open traces. The main ones are using the Open Trace Dialog or the File Explorer. There are still some inconsistencies between them.
| Desired action | via Open Trace Dialog | via File Explorer |
|---|---|---|
| Open single CTF trace (folder) | ✓ | ✓ |
| Open folder of CTF traces (create trace group) | ✓ | ✓ |
| Open single file trace (ex. JSON Chrome trace) | ✓ |
Regardless of the opening method used, if the selection is a folder, the tool will look for traces in Common Trace Format (CTF) format, such as Linux Tracing Toolkit traces (LTTng) Kernel and UST (Userspace) traces, and open all found CTF traces together under the same timeline. The trace events of each CTF trace will be analyzed in chronological order. With this, several traces can be opened as a group (e.g. LTTng Kernel and UST Traces).
The example Trace Compass trace server above supports LTTng Kernel and UST traces. Example LTTng traces can be retrieved from the Trace Compass Tutorials. Just download the archive TraceCompassTutorialTraces, extract them into a local directory on your computer. They can also be automatically downloaded by running yarn download:sample-traces from the repository's root.
This is the most intuitive way to open traces and trace groups, but it can only works with folders. So this dialog works for opening:
- Single Common Trace Format (CTF) traces
- Folders containing several CTF traces
You can open any supported trace format via the file explorer context menu. For a single trace, right-click on the trace file, or folder (for a CTF trace), then select Open With → Open Trace. To open several CTF trace files as a group, right-click on the parent folder instead.
To open a view, in the Trace Viewer select an opened trace in the Opened Traces widget, then click on a view in the Available Views list to open it.
- A bad reason: Some events required for the analysis were not enabled in the trace. #322
- A neutral reason: All required events are enabled in the trace, but there are no instances of these events in the trace.
- Zoom to a specific range: Click and hold the right mouse button on the chart, drag to select zoom range
- Ctrl + Mouse scroll
- WASD keys: 'W' zooms in, 'S' zooms out
- Toolbar: Zoom in, Zoom out, Reset zoom (see screenshot)
- Arrow keys
- WASD keys: 'A' pans left, 'D' pans right
During updating of a view, a progress wheel is shown in the view's title bar until data is available. Depending on the size of trace, window range, or complexity of the analysis this can take several seconds after the chart is opened or after navigation.
This section shows detailed information about a selected:
- Time Graph State (Bar section in a Gantt chart), or
- Event in the Events Table
This trace viewer depends on code from several other repos. Sometimes resolving issues in the trace viewer repo requires making changes in these code bases:
| Project | Description | Related issues | Links |
|---|---|---|---|
| Theia | Theia is a framework for making custom IDEs. It provides reusable components (e.g. text editor, terminal) and is extensible. For example, this trace viewer is an extension for Theia-based IDEs. | Code, Ecosystem | |
| Trace Compass | Trace analysis tool and precursor to this trace viewer. | label:"Trace Compass" | Dev info, Dev setup |
| Trace Compass Server | A reference implementation of a Trace Server. Manages and analyzes trace files and provides this data to the trace viewer over the Trace Server Protocol (TSP). This Trace Server implementation was originally part of Trace Compass, so it requires the same dev setup. Because a protocol is used for communication (TSP), it is possible to develop alternative Trace Servers that are independent of Trace Compass. | label:"Trace Server" | Dev setup (same as Trace Compass), Code (same repo as Trace Compass incubator) |
| Trace Server Protocol (TSP) | Protocol used by the trace viewer to communicate with the trace server. | label:"trace server protocol" | |
| Client-side Trace Server Protocol implementation | A client-side implementation of the Trace Server Protocol. Allows the trace viewer to communicate with the server. | ||
| Timeline Chart | Implements the Gantt charts used in this trace viewer. | label:timeline-chart |
This section discusses known issues on Windows.
When starting the Trace Extension using yarn start:browser on Windows, you might get the following error:
$ TRACE_SERVER_PATH=../../trace-compass-server/tracecompass-server theia start --plugins=local-dir:../plugins
'TRACE_SERVER_PATH' is not recognized as an internal or external command,
operable program or batch file.
error Command failed with exit code 1.
The expression TRACE_SERVER_PATH=../../trace-compass-server/tracecompass-server is not a valid Windows expression. For now, if you want to start the Trace Extension in the browser, remove the expression from theia-trace-extension/examples/browser/package.json at scripts.start and the extension should start normally.
When adding new packages on Windows using yarn (e.g yarn add @vscode/codicons) you might encounter the following error:
An unexpected error occurred: "expected workspace package to exist for {some package name}"A simple solution would be restoring the project to a clean state prior to the installation of the package, then restarting Powershell in administrator mode and re-run the command to add the new package.
The diagram below shows the main parts of the Trace Viewer's front end (left side) and back end (right side), as well as how they exchange information.
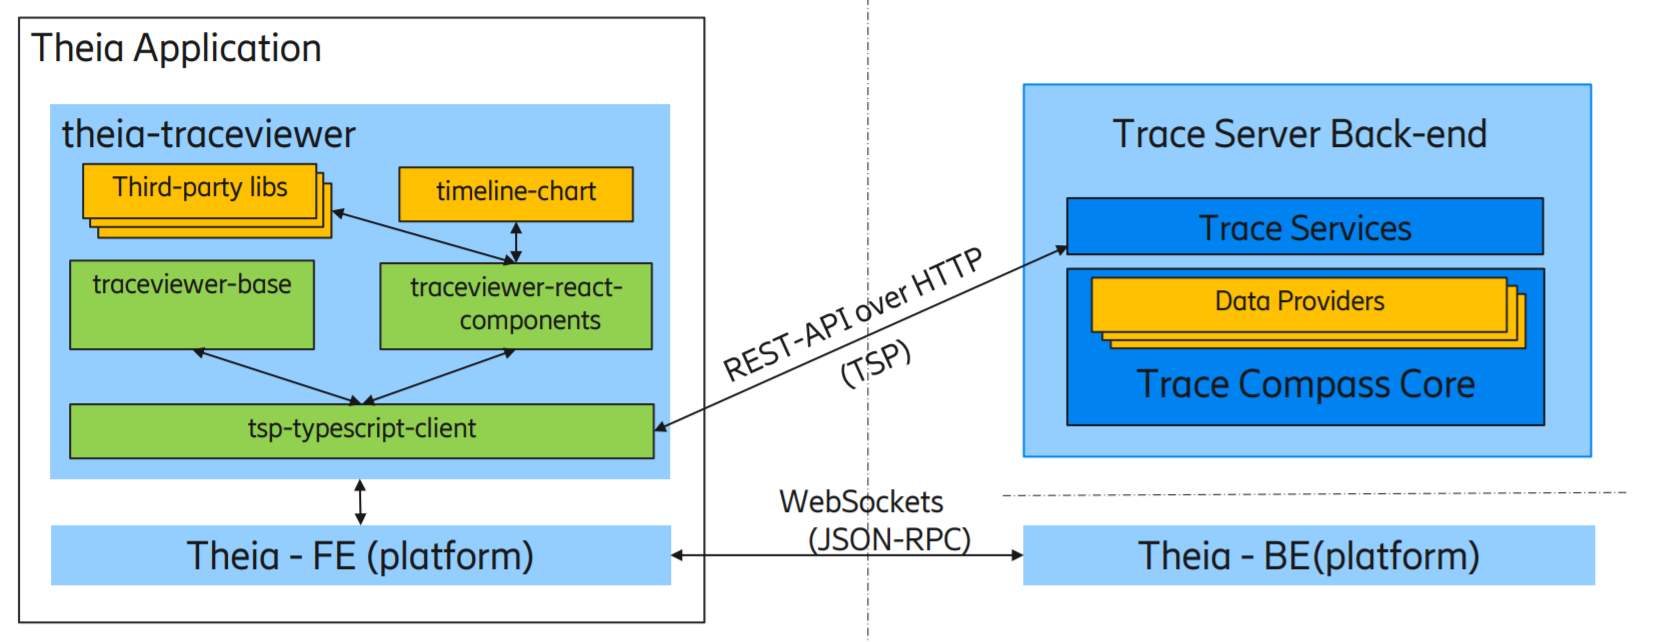 Source: EclipseCon 2021 Presentation (slide 18), Bernd Hufmann
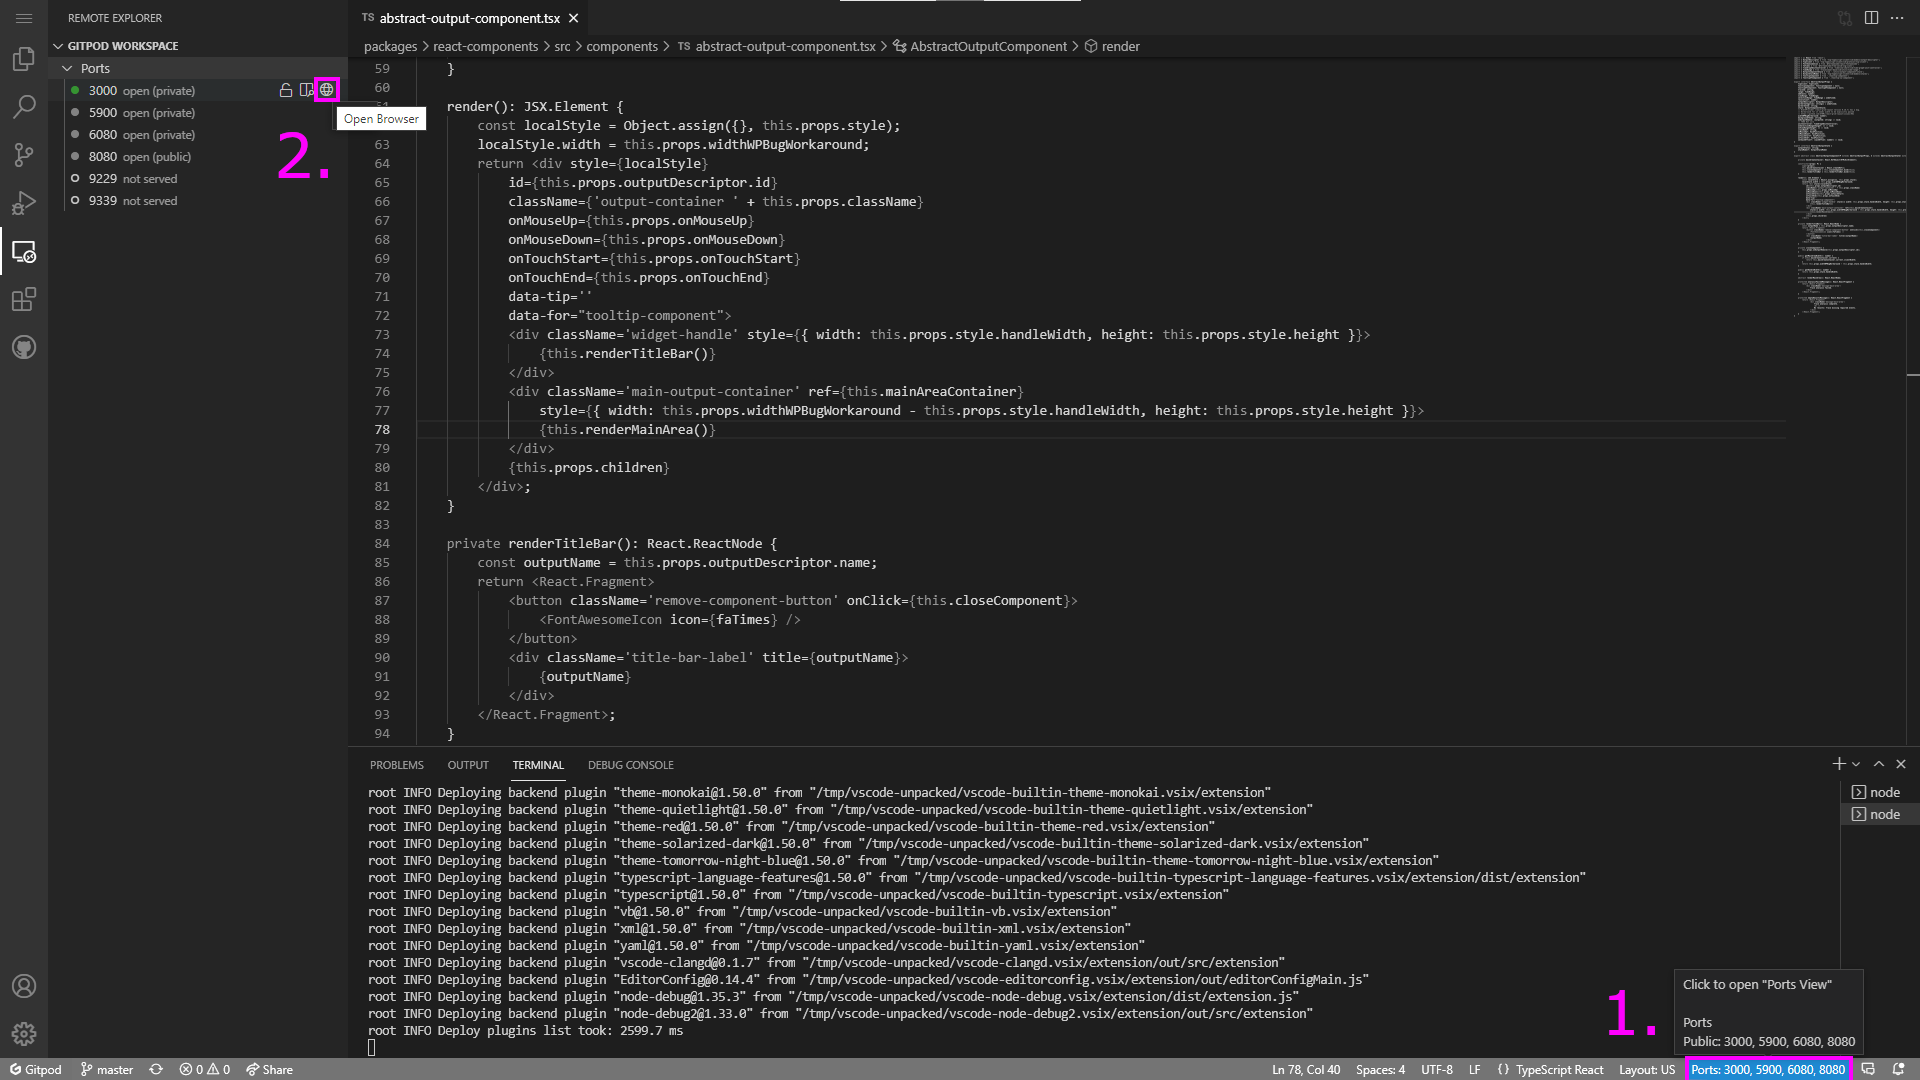
When the project is opened in Gitpod, it should build automatically and then pop a notification saying a service (i.e. the example application) is now available.
If there is no notification, you can open the application directly in the Remote Explorer view.
- The Remote Explorer view can be opened:
- Via the Ports section in the bottom bar (see screenshot below), or
- Via the Command palette or Open View menu (type "view remote explorer")
- Once in the Remote Explorer, select "Open Browser" for the port 3000. By default, the application is hosted on port 3000.
To run tests once, at the root of the project, run:
yarn test --verboseTo keep tests running, use:
yarn test --verbose --watchThe following command computes the test coverage for the unit tests and prints a coverage report to the terminal. To access a more detailed coverage report, open this file in a browser after running the command below: ./packages/react-components/coverage/lcov-report/index.html As of now, the reported coverage covers all typescript files of the project, including those that are not supposed to have tests.
yarn test --coverageTo run the UI test suite, first start the browser example application or optionally the Docker example application using external port 3000:
yarn browser start
# or
docker run --init -d -p 0.0.0.0:3000:4000 tte
Then run the UI test suite like so:
yarn test:browser-appADRs are Architectural Decision Records.
- The
./doc/adrdirectory was initialized usingadr-initbased on adr-tools-python. - The
adr-newcommand (from adr-tools-python) is used to add new ADRs further. - That tool can be installed locally (only once) using the instructions below.
- The latter also shows how to activate a Python virtual environment to locally run commands.
- These aforementioned
adr-commands are meant to be executed from this root directory. - ADRs should be preferred to design documents for their structure and reviewability.
- ADRs should be owned or led in terms of authoring and review; a companion prototype helps.
This script is used to generate ADR's Mermaid diagram images for GitHub rendering.
- One may need to disable its use of the
in-containerargument for that script to work locally. - It is otherwise possible to render such diagrams when in VS Code using this extension.
- As for GitHub, it is now capable of automatically rendering these diagrams natively.
To initialize a local virtual environment, type the following commands in the root directory:
python3 -m venv .venv
source .venv/bin/activate
pip install -r requirements.txt- The virtual environment can be replaced with another setup locally.
- Above, the
./requirements.txtfile has the ADR tool to install.
Publishing this repository's npm packages and creating a corresponding GitHub release with git tag (latest only), all happen on GitHub CI.
A set of next package is automatically published to npm every time a PR is merged.
Whenever a new release is desired, including publishing a corresponding set of latest package to npm, it can be triggered through a PR. The following has to be done:
Create a new branch for your PR. e.g.
git branch new-release && git checkout new-releaseThen decide if the release shall be a Major, Minor or Patch release and use the corresponding command below to step packages versions, according to the release type. A new release commit will be created:
yarn version:major
# or
yarn version:minor
# or
yarn version:patch
Modify the version tag in file ./RELEASE, to match the new release. Then amend the release commit to include this change:
<edit ./RELEASES to update tag>
git add RELEASE && git commit --amend
Finally, push the branch and use it to create a PR. When the PR is merged, a GitHub release should be created with auto-generated release notes, as well as a git tag. Then the publish-latest CI job should trigger and if everything goes well, publish the new version of the repo's packages to npm.
The code in this repository is licensed under MIT (see root LICENSE), except for the content of folder playwright-tests that's licensed under EPL-2.0 (see playwright-tests/LICENSE). This content is used for testing the components of this repository and is not distributed as part of the various packages that get published to npm.