Project Posture is a project for COSC 490 Senior Capstone from Pepperdine University taught by Professor Fabien Scalzo and co-advised by Professor Adam Pennell based on Python language development. Its purpose is to investigate for linear and/or non-linear associations between various posturography and self-reported physical activity metrics using data analytics, machine learning, and/or related techniques/processes.

Reference
The data for this project is from
- Santos, D. & Duarte, M. (2016). A public data set of human balance evaluations. PeerJ, 4, e2648. doi: 10.7717/peerj.2648.
The calculation for variables is based on
- Duarte M, Freitas SM. Revision of posturography based on force plate for balance evaluation. Rev Bras Fisioter. 2010;14(3):183-192.
- Duarte M. Comments on "Ellipse area calculations and their applicability in posturography" (Schubert and Kirchner, vol.39, pages 518-522, 2014). Gait Posture. 2015;41(1):44-45. doi:10.1016/j.gaitpost.2014.08.008
- Yamamoto T, Smith CE, Suzuki Y, Kiyono K, Tanahashi T, Sakoda S, Morasso P, Nomura T. Universal and individual characteristics of postural sway during quiet standing in healthy young adults. Physiol Rep. 2015 Mar;3(3):e12329. doi: 10.14814/phy2.12329. PMID: 25780094; PMCID: PMC4393163.
Discrete Variable Calculations (accomplished by Dr. Watanabe)
- Calculate the variables using numpy, pandas, matplotlib.pyplot, zipfile, and welch from scipy.signal in Python.
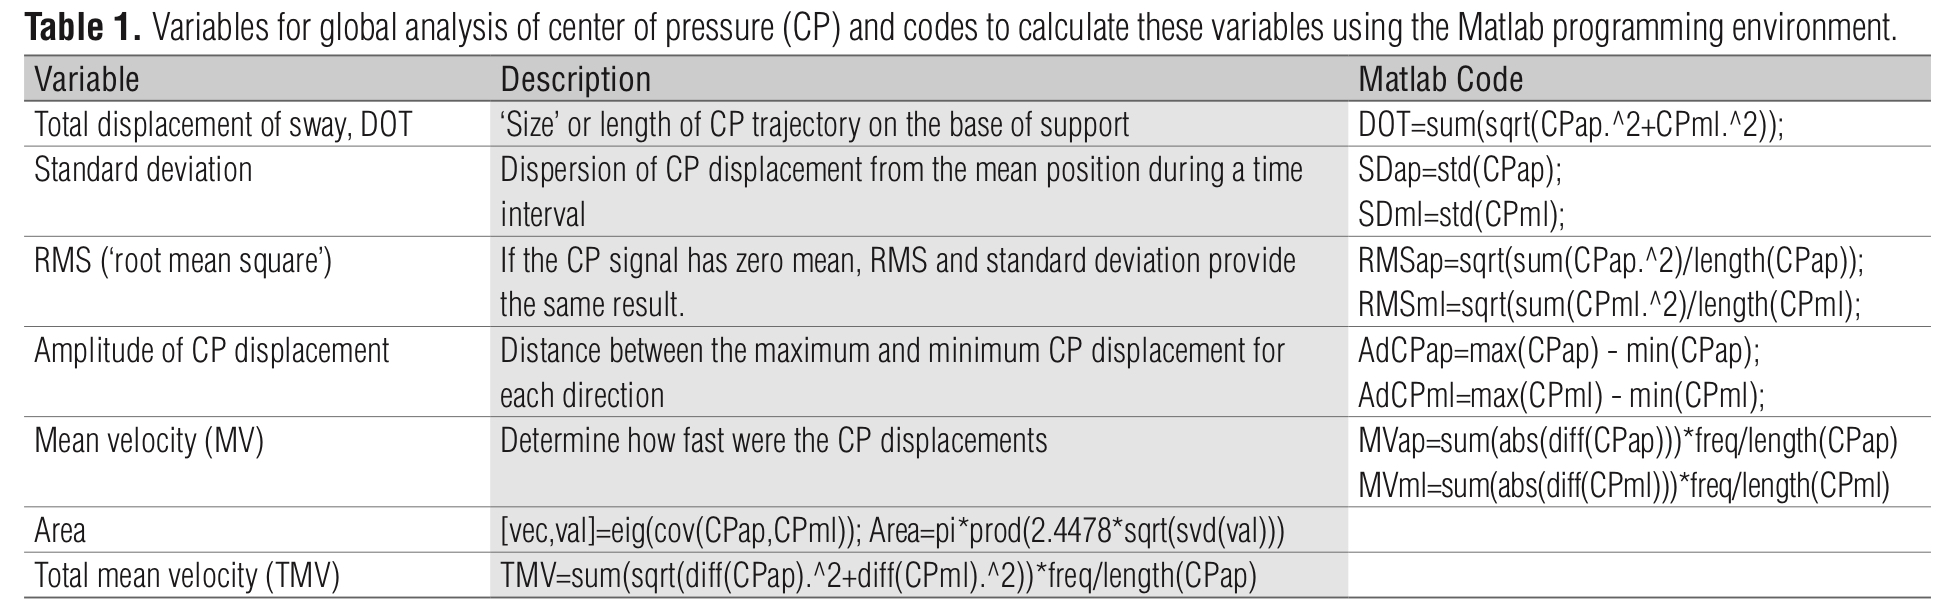
copMeasures.ipynb, a Jupyter Notebook file in Python using Google Colab for the variables calculation.
Exploratory Analysis/Machine Learning
- 【Overall Goal】
- Predict MVPA_minutes.week and IPAQ_Category from any of the four Total Area (cm²) average scores (i.e., EO/firm; EO/foam; EC/firm; EC/foam) as well as AP RMS (cm), ML RMS (cm), Total Displacement (cm), and Total Velocity.
- Predict Total Area (cm²) from MVPA_minutes.week and IPAQ_Category as well as AP RMS (cm), ML RMS (cm), Total Displacement (cm), and Total Velocity.
- 【Used Algorithms】Reference
Pre-work (accomplished by Sunny)
- Average the 3 trials for each condition to get an overall average score for MVPA_minutes.week, IPAQ_Category, Total Area (cm²), AP RMS (cm), ML RMS (cm), Total Displacement (cm), and Total Velocity (cm/s), i.e., we will have 4 average Total Area (cm²) scores.
-
variables.py, a Python file to average the 3 trials for each condition to get an overall average score.
-
variables.xlsx, an excel file contains an overall average score for Total Area (cm²), AP RMS (cm), ML RMS (cm), Total Displacement (cm), Total Velocity (cm/s), MVPA_minutes.week, IPAQ_Category, Subject, Vision, and Surface for each condition.
- Decide X and Y.
- We set Y as MVPA_minutes.week and X as the other five variables first, and
- do it again with Y as Total Area (cm²) and X as the other five variables.
- Then we set Y as IPAQ_Category and X as the other five variables first, and
- do it again with Y as Total Area (cm²) and X as the other five variables.
Data Preprocessing (accomplished by Sunny)
- Apply pre-processing to the data (Standardization)
Reference
- We implemented both StandardScaler and MinMaxScaler.
-
preprocessing_standard.py, a Python file to preprocess data using StandardScaler.
-
preprocessing_minMax.py, a Python file to preprocess data using MinMaxScaler.
-
standardScaler.xlsx, an excel file contains the preprocessed data using StandardScaler for MVPA_minutes.week, Total Area (cm²), AP RMS (cm), ML RMS (cm), Total Displacement (cm), and Total Velocity (cm/s)).
-
minMaxScaler.xlsx, an excel file contains the preprocessed data using MinMaxScaler for MVPA_minutes.week, Total Area (cm²), AP RMS (cm), ML RMS (cm), Total Displacement (cm), and Total Velocity (cm/s)).
Learning (accomplished by Cheng)
-
Machine learning algorithms to evaluate.
- Pick one column as the test data and rest columns as the training data, then use the training data to create one model in【Used Algorithms】and put the result into an excel
-
Use cross-validation: 10-Fold.
-
For each machine learning algorithms, perform an optimization of the parameters.
- We implemented GridSearchCV with KFold (specifically 10-Fold).
Example for Kernel ridge regression using gridsearch to optimize the parameters alpha and gamma:
   kr = GridSearchCV(KernelRidge(kernel='rbf', gamma=0.1),
                     param_grid={"alpha": [1e0, 0.1, 1e-2, 1e-3],
                                "gamma": np.logspace(-2, 2, 5)})
Evaluation (accomplished by Cheng & Sunny)
- Perform the evaluation using a metric for regression
- We used our model to find y_true and y_pred to draw the graph for a more visualized result, comparing the result from the predicted y value using our six models with the original data.
- We also implemented the scoring methods (built in GridSearchCV for regression) below to interpret our models:
      metrics.mean_absolute_error (i.e. scoring='neg_mean_absolute_error')
      metrics.mean_squared_error (i.e. scoring='neg_mean_squared_error')
metrics.r2_score (i.e. scoring=‘r2’)- learning.ipynb, a Jupyter Notebook file in Python to do the learning and evaluation part.
- original, a folder for storing the scatterplots of original data to compare X and y.
- standardScaler, a folder for storing the scatterplots when preprocessing uses StandardScaler.
- minMaxScaler, a folder for storing the scatterplots when preprocessing uses MinMaxScaler.
- For both folders, the explanation of folders inside them is:
      x_MVPA_y_totalArea: a folder for storing the scatterplots when y is Total Area and X is MVPA.
      x_totalArea_y_MVPA: a folder for storing the scatterplots when y is MVPA and X is Total Area.
      y_MVPA: a folder for storing the scatterplots when y is MVPA and X is the other five variables.
y_totalArea: a folder for storing the scatterplots when y is totalArea and X is the other five variables.- Additional Documents:
- COSC 490 Final Presentation Video, the video for Capstone Project presentation in google drive.
- COSC 490_Project Posture Document, a google doc of things related to our project in full version.
- COSC 490_Project Posture, a google slide for Capstone Project presentation.
- project_document, a google doc (some in Chinese) contains our temporary schedule, links when we share w/ each other for new information, steps, etc.
- Posturography project, a google doc w/ instructions from Professor Scalzo.
- learning_1st_ver, a folder contains six Jupyter Notebook files in Python which are our first version to do the learning and evaluation part, because we wrote the code at first for each algorithm and combined them later to the learning.ipynb when we found there're lots of similar codes.
- Other folders are mostly for storing the original data files or the article we read, and extra folder is to store pictures for the ReadMe.
Download or clone this repository.
Make sure Python 3 is installed on your machine.
The following packages are used/imported in the scripts, please install them:
- matplotlib
- numpy
- openpyxl
- os (source code)
- pandas
- scikit-learn OR sklearn
- scipy
- zipfile (source code)
This project uses the Jupyter Notebook partially. Go check it out if you don't have them locally installed.
sh
$ npm install --global project-posture-[placeholder]
This project is supervised by Dr. Fabien Scalzo from Pepperdine University, co-advised by Dr. Adam Pennell from Pepperdine University, and assisted by Dr. Renato Naville Watanabe.
GNU GPLv3 © Cheng Zheng and Sunny (Mengchen) Qu