BEST WITH LIGHT-MODEFORK & STAR THIS PROJECT. USE IT AS YOUR BEGINNERS DATA SCIENCE PROJECT
- Created a tool that estimates Data Science salaries {Mean Absolute Error(MAE) ~ $ 11K} to help rookie Data Scientists negotiate their income with correct stats when they get a job.
- Using Python & Selenium, created an automated scraper which scraped over 1000+ job descriptions from GlassDoor
- Introspected features from the text inputs provided in each job description to quantify what values/skills MNCs put on Python, MS-Excel, AWS, & Spark.
- Optimized Linear, Lasso, & Random Forest Regressors using GridsearchCV & Scikit-Learn to reach the best model.
- Built a client facing Representational State Transfer API using Flask.
Desgined an automated Web scraper with selenium to scrape 1000+ job postings from GlassDoor. With each job; attributes to be focused were:
Job title
Salary Estimate
Job Description
Rating
Company
Location
Company Headquarters
Company Size
Company Founded Date
Type of Ownership
Industry
Sector
Revenue
Competitors

--------------------------
Pre-requisites at this stage are:
Selenium WebDriver for FireFox (or Chrome)
Selenium Automation Documentation
For other resources scroll at last

After scraping the data, I cleaned the cluttering data for it to be usable/readable for the model. Changes I made and what all variables & scripts I wrote:
* Parsed numeric data out of salary
* Made seperate columns for employer for given dataset of salary and hourly wages
* Removed rows without salary
* Parsed rating out of company_text
* Made a new column for company_state
* Added a column for if: job was at the company’s headquarters
* Calculated age of the company by transforming Company founded/established year data
* Made columns for if different skills were listed in the job description:
    -> Python
    -> R
    -> Excel
    -> AWS
    -> Spark
* Column for simplified job title and Seniority
* Column for description length

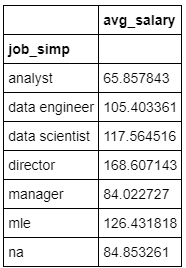
- All the imported distributions from data cleaning data-set, I looked at the distributions of the data and the value counts for the various categorical variables.
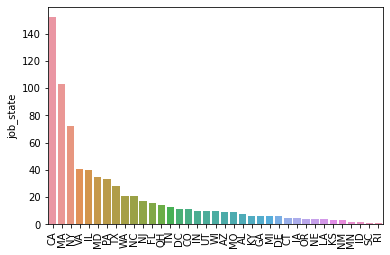
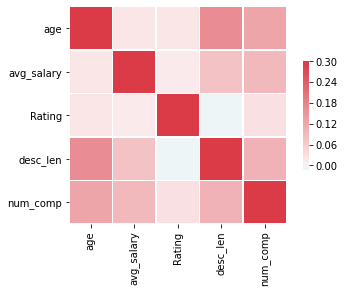
- Using Matplotlib & Seaborn, categorised and crafted a beautiful data visualisation charts & plots
- Below are a few highlights from the Pivot tables, Barplots & HeatMaps.


- First, I transformed the categorical variables into dummy variables. I also split the data into train and tests sets with a test size of 20%.
- I tried three different models and evaluated them using Mean Absolute Error.
- Chose MAE because it is relatively easy to interpret and outliers aren’t particularly bad in for this type of model.
Using Matplotlib, Pandas, Numpy, Sklearn-Models, GridSearchCV Designed three different Models for this Data-Set:
- Multiple Linear Regression –> Baseline for the model
- Lasso Regression –> Because of the sparse data from the many categorical variables, I thought a normalized regression like lasso would be effective.
- Random Forest –> Again, with the sparsity associated with the data, I thought that this would be a good fit.

The Random Forest model far outperformed the other approaches on the test and validation sets.
- Random Forest : MAE = 11.06711409395973
- Linear Regression: MAE = 18.855189990211073
- Ridge Regression: MAE = 19.665303712749914

- The last step in this Project was to build a Flask API endpoint that was hosted on a local webserver.
- Several Articles helped in Deployment of the Model on a local server (all resources linked at last)
- The API endpoint takes in a request with a list of values from a job listing and returns an estimated salary.

Python Ver: 3.9.0
Packages Used: Pandas, Numpy, Sklearn, Matplotlib, Seaborn, Selenium, Flask, Json, Pickle
For Web Framework Requirements type in console >> pip install -r requirements.txt
- Selenium WebDrivers:
- Scikit-learn Documentation: Click here
- Matplotlib Documentation: Click here
- Seaborn Documentation: Click here
- Scraper Github: Click Here
- Flask Model-Productionization: Click Here
- Ken Jee Data Science Tutorials: Ken Jee YouTube Channel