6 Tools
Tools are embedded in TRMG2 and no further installation required. The user can run these tools after one or two model runs are complete. These tools are located under the “TRMG2” menu that appears after the model is opened in TransCAD. Click “TRMG2” on the menu bar and select, “Tools”. All tools can be called from there. Make sure the dropdown menu has the appropriate scenario selected before running the tools (user may need to re-select the appropriate scenario).
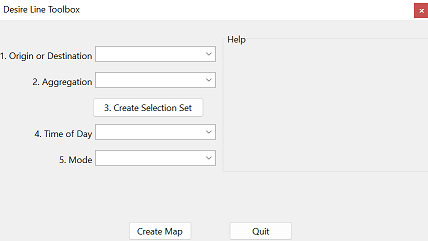
This tool facilitates the creation of desire line maps that are easy to interpret. Desire line maps that show all trips between all zones are difficult to find meaningful patterns. This tool helps isolate flows to/from specific zones or districts and uses aggregation to improve map readability.
-
Using the Tool
- Find it in the TRMG2 drop down menu: TRMG2 -> Tools -> Highway Analysis -> Desire Lines
-
Input
- Origin or Destination (flows to or from selected zones)
- Aggregation (selected zones aggregated to a district or remain separate)
- Create Selection Set (opens a map to select the zone(s) of interest)
- Time of Day (select which time period to view)
- Mode (select which mode of travel to view)
As options are selected, the tool generates help text in the right window. This ensures that the options selected will produce the desired results.
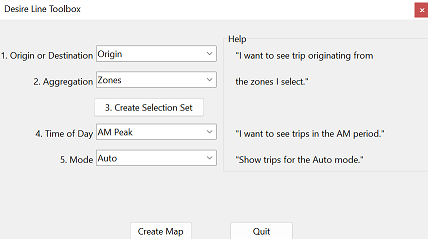
- Output
- A map with trip flows represented by desire lines.
A common use of the model is to measure a small change to the roadway transportation network. In these cases, a full model run is often not required. Instead, TRMG2 lets you point to an already completed scenario as the source of converged travel demand and use the Fixed OD assignment utility.
-
When not to use this tool
- Changes in land use that add the demand for new persons.
- Changes in the transit that require an update modal choices.
- Large changes in the roadway network that might affect destination choice decisions. For example, a new alternative with many new projects included.
-
Create a new scenario following the create scenario guide. When created, this scenario will look the same as an already run scenario. A common change is to add an extra project or make small changes in the roadway network file (input\networks\scenario_links.dbd) after the automated scenario creation.
-
Using the tool
-
Find it in the TRMG2 drop down menu: TRMG2 -> Tools -> Fixed OD Assignment

-
Use the browse button and select a scenario that has been run through the full model.
-
Use the flowchart's dropdown menu to activate the newly-created scenario.
-
Press 'Run'.
-
-
What the tool does
- Initial Processing (including calculation of capacities and .net creation)
- Copies the assignment matrices from your completed scenario
- Runs roadway assignment
- Runs relevant summaries
New roadway map summaries are created along with summary tables. These can be used to measure and observe the impact of the project.

This is an extension of the Fixed OD tool that allows the user to run many single-project scenarios. For example, you might have 10 projects and you want to run 10 scenarios (one for each project).
The tool requires two things:
- A fully-run scenario used as the reference.
- A list of projects to be analyzed.

The reference scenario could be the base year, a future existing+committed scenario, or a full MTP scenario. The project list contains the project IDs to be analyzed individually. The radio button specifies whether projects in the list should be added to the reference scenario or removed. The tool will check that projects to add don't exist in the reference scenario and that projects to remove do exist.
The result of the run will be many different scenarios folders based on the reference scenario. In the image below, the base_2020 scenario was the reference.

In each folder, you'll have the same outputs and summaries produced by the fixed OD tool.
This tool estimates the number and percentage of regional population and employment that can be reached from each TAZ via auto and transit within a user-specified time threshold. The tool uses the highway and transit skim matrices to calculate travel time in the selected time period between TAZs. Auto travel time uses the highway skim matrix. Transit travel time uses the “TotalTime” core in the transit skim matrix, which includes time for access/egress, waiting, transfer and in-vehicle.
- Using the tool
- Find it in the TRMG2 drop down menu: TRMG2 -> Tools -> Population and Employment Accessibility
- Use the dropdown menus to select time threshold in minutes and the time of day period.

-
Input
- The tool takes user customized inputs like time threshold and time of day.
-
Output
- The outputs of the tool are saved in the scenario directory: \Output_summaries\ Pop_EmpReachedByHighwayTransit
- This tool generates one CSV report which includes the number and percentage of regional population and employment that can be reached from each TAZ via auto and transit within the user-specified time threshold.
This tool estimates the number and percent of poverty households within a user-defined radius of a transit stop or a transit route (e.g., 0.25 miles). A buffer is created and the number of poverty households within the buffer is estimated based on the buffer area. The tool calculates the coverage of poverty households for all transit modes for selected time of day and daily. The 2020 poverty definition comes from American Community Survey 5-Year estimates (2016-2020).
- Using the tool
- Find it in the TRMG2 drop down menu: TRMG2 -> Tools -> Transit Poverty Coverage
- The tool requires two inputs outside of TRMG2; navigate to the block group and census poverty data files which are located under model root folder: other_reportingtool.
- Use the dropdown menus to select a stop or route radius and the time of day period.
![]()
- Output
- The outputs are saved in the scenario directory: \output_summaries \Transit_Poverty_HH_Coverage
- The tool creates CSV reports for the specified time period and buffer radius for each transit mode and also all modes combined. It also generates aggregated results by MPO and county.
This tool estimates the number of households by household strata within a user-defined radius around transit stops and/or transit routes based on selected time of day. A buffer is created around the transit stop or route using the radius. The number of households within the buffer is estimated based on the buffer area. Household strata categorizes are based on income and vehicle availability: income high vehicle insufficient (ihvi) ; income high vehicle sufficient (ihvs) ; income low vehicle insufficient (ilvi) ; income low vehicle sufficient (ilvs) ; zero car households (v0).
- Using the tool
- Find it in the TRMG2 drop down menu: TRMG2 -> Tools -> Transit HH Strata Coverage
- Use the dropdown menus to select a stop or route radius and the time of day period.
![]()
- Output
- The outputs are saved in the scenario directory: \output_summaries \Transit_HH_Strata_Coverage
- The tool creates CSV reports for the specified time period and buffer radius, for each transit mode and also all modes combined. It also generates aggregated results by MPO and county.
TRMG2 generates disaggregate results and users may want to combine outputs for analysis. This tool mimics a traditional trip based model by restructuring motorized production-attraction person trip matrices (resident, university, and non-home based) into 5 trip purposes: HBW, HBSch, HBO, HBU, and NHB.
- Using the tool
-
Find it in the TRMG2 drop down menu: TRMG2 -> Tools -> Matrix Aggregation –> Motorized Trip Matrix Aggregation

-
Output
-
The outputs are saved in the scenario directory: \output_summaries\PersonTrip_aggregation\pa_mototrip_matrix_daily.mtx
-
PA motorized person trip tables for each time period and daily are created. The trip tables include HBW, HBSch, HBO and HBU.
-
TRMG2 generates disaggregate results and users may want to combine outputs for analysis. This tool mimics a traditional trip based model by restructuring nonmotorized production-attraction person trip matrices (resident, university, and non-home based) into 5 trip purposes: HBW, HBSch, HBO, HBU, and NHB.
- Using the tool
- Find it in the TRMG2 drop down menu: TRMG2 -> Tools -> Matrix Aggregation –> NM Trip Matrix Aggregation

-
Outputs from the scenario selected in the G2 interface will be aggregated.
-
Output
- The outputs are saved in the new scenario directory: \output_summaries\PersonTrip_aggregation
- PA nonmotorized trip tables for each time period and daily are created
This tool is used to combine AM, MD, PM, NT time of day matrices into Daily for three markets: auto OD, transit OD, and university OD.
-
Using the tool
- Find the tool in the TRMG2 drop down menu: TRMG2 -> Tools -> Matrix Aggregation and Deletion -> Daily Matrix Creation
-
Input
- Time of day auto OD matrices under “/output/assignment/roadway”
- Time of day transit OD matrices under “/output/assignment/transit”
- Time of day university OD matrices under “/output/university”
-
Output
- Daily auto OD matrices under “/output/assignment/roadway”
- Daily transit OD matrices under “/output/assignment/transit”
- Daily university OD matrices under “/output/university”
This tool creates a “slim model run” by deleting logsums and probability matrices that typical model users do not use. This reduces the output folder by ~50 GB.
-
Using the tool
- First, using the Model dropdown menu in the TRMG2 interface, select the scenario to apply this tool on.
- Find the tool in the TRMG2 drop down menu: TRMG2 -> Tools -> Matrix Aggregation and Deletion -> Delete Matrix Files
-
After running this tool, matrix files under the following folders will be deleted:
- "/output/resident/mode/logsums"
- "/output/resident/mode/probabilities"
- "/output/resident/dc/logsums"
- "/output/resident/dc/probabilities"
- "/output/university/dc/logsums"
- "/output/university/dc/probabilities"
- "/output/ resident/nhb/dc/probabilities"
This tool compares the transit performance in a selected time period between any two scenarios. It calculates the difference in transit trip making and transit travel time aggregated from an origin zone. It also captures the change transit access for an origin zone.
- Using the tool
- Find it in the TRMG2 drop down menu: TRMG2 -> Tools -> Transit Scenario Comparison Tool
- Use the tool interface to select the old/base scenario. The new scenario is the one selected in the G2 interface.
- The base/old scenario is optional. If you leave it blank, the tool will only generate results for the new scenario instead of doing comparison.
![]()
- Output
- The outputs are saved in the new scenario directory: \output_summaries\Transit_Scenario_Comparison
- The tool creates maps and CSV reports for the specified time period.
To evaluate a project’s impact on VMT, the metric - Zonal VMT Ratio - is used. VMT ratio is calculated using zonal and regional VMT as described below:
Zonal VMT = ∑_(Zone 1)^(Zone n)〖auto trips to zone*auto skim distance to zone〗 (n = number of TAZs)
Zonal VMT per capita = zonal VMT / zonal population
Regional VMT per capita = regional VMT / regional population
- Using the tool
- Find it in the TRMG2 drop down menu: TRMG2 -> Tools -> Zonal VMT comparison
- Use the tool interface to select the old/base scenario. The new scenario is the one selected in the G2 interface.

- Output
- The outputs are saved in the new scenario directory: \output_summaries\Zonal_VMT_Comparison
- The tool creates maps, matrices and CSV reports.
The scenario comparison tool allows you to quickly generate maps and reports that show differences between two previously-run scenarios. With the model flowchart open, find the tool in the TRMG2 --> Tools dropdown menu.
In the dialog box, select the two scenario folders to compare. The subarea polygon layer is optional, but if included, it will be added to maps and several reports will be calculated for the subarea as well as the entire model region.
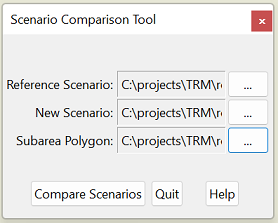
- Output
- All outputs are stored in the "New Scenario" folder, in a new subfolder called "comparison_outputs" which is created automatically. In that folder are two subfolders.
- The subfolder "maps" contains a number of maps showing the differences of various metrics like input SE data and output link-level metrics.
- The subfolder "output" is designed to mimic the scenario output folder. For example, the SE Data table is in output/sedata. There is the raw difference table as well as summary tables for the region (and optionally the subarea).
- This organizational structure was adopted to allow for additional difference metrics/tables to be built over time. Any model output file could be added to the comparison tool in the future, and this way, it will always have an exact location in the "comparison_outputs" folder.
This tool is used to track spatial and attribute changes between two link layers. After selecting the base and new link layers, two maps will be created highlighting these differences.
Note: fields are added to the new link layer to track attribute changes
-
Using the Tool
- Find it in the TRMG2 drop down menu: TRMG2 -> Tools -> Diff Tool

-
Input
- Old/base DBD: The original/unmodified layer. This will be displayed in the left map and any links deleted in the 'New DBD' will be highlighted.
- New DBD: The modified layer. This will be displayed in the right map, and any attribute or spatial changes will be highlighted.
-
Output
- Two maps with selection sets are created to identify where changes have taken place.
- Note that the 'New DBD' is modified by having additional fields added. Existing fields are not modified.
The master line layer is managed jointly by DCHC and CAMPO. This often requires them to make edits at the same time. This tool makes it easier to merge those disparate edits back together.
-
Using the Tool Find it in the TRMG2 drop down menu: TRMG2 -> Tools -> Merge Tool

-
Input
- Original Layer: the link layer to update.
- New Layer: the layer that contains updated links.
- Polygon layer: defines a subarea of the link layer to update. DCHC and CAMPO layers are provided for convenience, but any custom polygon can be used, as well.
- Create Map: optional button that creates a map of all three layers to assist in review before performing the merge.
If the extent of the changes between two layers are unclear, use the diff tool to highlight differences (TRMG2 -> Tools -> Diff Tool).
-
Output
- Input files are not modified. Instead, a new geographic file is created in a "merge_tool" folder in the same directory as the original layer. Review the results before replacing the original link layer.
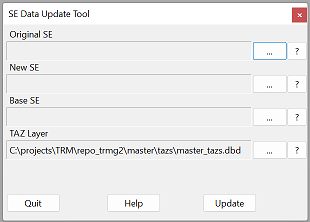
For some applications, a modeler may want to increase the employment or housing in several zones while maintaining the county-level totals. This tool facilitates that by adjusting all non-modified zones to maintain the original totals.
-
Using the Tool Find it in the TRMG2 drop down menu: TRMG2 -> Tools -> Update SE Data
-
Input
- Original SE: the original SE data file which is used to calculate county control totals. It is not modified by the tool.
- New SE: new SE data where some zones have been modified. This file is modified by the user and the tool. When changing HH or HH_Pop in a TAZ, it is important to keep the HH / HH_Pop ratio consistent within that TAZ. For example, in a TAZ if you initially have 366 HHs and 1277 HH_Pop and want to reduce HH_Pop by 1000, then HHs should be reduced by a similar margin; the new HHs would be 80.
- Base SE: Optional argument that if provided, only the growth since the base year is modified (no zone will have less than base year se data). This file is NOT modified, but is only used to determine the growth between the base and original SE data to determine which TAZs should be changed in the New SE file.
- TAZ Layer: Defaults to the master TAZ layer. The TAZ layer is not modified, and is only used to lookup the county for each zone.
The following fields will be identified and adjusted by the tool:
- HH
- HH_POP
- Employment fields
-
Output
- The 'New SE' file is modified by the tool to preserve county-level totals.
-
Notes
- Make sure there are no negative values after running this tool. If negative values are found, manually change these to zeros. This will be fixed in the next model version.
This tool uses TRMG2 output data to develop MOVES4 air quality analysis input files. MPOs will run MOVES4 to obtain emissions values that are included in their Metropolitan Transportation Plans.
- Using the Tool
- First, using the Model dropdown menu in the TRMG2 interface, select the scenario to apply this tool on.
- Find the tool in the TRMG2 drop down menu: TRMG2 -> Tools -> Performance Measures -> MOVES Input Preparation

-
A user can run this tool for each MPO area, county, or the entire region. The tool uses outputs from the scenario selected in the G2 interface. The user manually selects the scenario year using the dropdown list.
-
Five MOVES4 input files are generated:
-
- Road Type: This file describes the allocation of total VMT to the four MOVES4 road types. It is calculated as 𝑟𝑜𝑎𝑑𝑇𝑦𝑝𝑒𝑉𝑀𝑇𝐹𝑟𝑎𝑐𝑡𝑖𝑜𝑛 =VMT for road type/∑All VMT
-
- Speed: This file describes the average speed distribution including a fraction in each of 16 speed bins. Collectively, these sums to one for each hour of the day. These vary by hour, weekday or weekend, road type, and source type. The fractions are based on time (vehicle hours traveled) spent in each speed bin. All source types within the same speed bin and hour will have the same distribution. Hours in the same time-of-day will have the same distribution. 𝑎𝑣𝑔𝑆𝑝𝑒𝑒𝑑𝐹𝑟𝑎𝑐𝑡𝑖𝑜𝑛 = 𝑆𝑒𝑔𝑚𝑒𝑛𝑡𝑇𝑖𝑚𝑒/∑𝐵in1-16(𝑆𝑒𝑔𝑚𝑒𝑛𝑡𝑇𝑖𝑚𝑒)
-
- Source type VMT: VMT for each source type is proportional to the source type population based on total VMT from the model and monthly adjustment factor. Weekend VMT is factored using a file containing weekend to weekday VMT ratios.
-
- Hour VMT: Hourly VMT distributions describe how models allocate daily total VMT to 24 hours since the model uses time-of-day periods and not individual hours. The hours in the same time-of-day period will be considered equal. Weekend data will be left as is.
-
- Vehicles: The number of vehicles by county or region is provided. This file is used as a check to the vehicle population developed from DAQ data.
-
Output
- Outputs are saved here: \output_summaries\MOVES
- Five csv files are generated: Road type fraction, Source type VMT, Speed, Vehicle, Hourly VMT fraction
This tool copies data from each of a model run's .csv files into the \output_summaries folder. This allows for ease of processing and reviewing the data since it is consolidated into one output file.
-
Using the Tool
- First, using the Model dropdown menu in the TRMG2 interface, select the scenario to apply this tool on.
- Find the tool in the TRMG2 drop down menu: TRMG2 -> Tools -> Performance Measures -> Concatenate CSV Files
- To edit the csv files that will export to the combined file, update the table names file located here: other_reportingtool\concatenate_tablenames.csv
-
Output
- Outputs are saved here: \output_summaries\concatenate_summary.csv
- The data will be copied to a sheet in the .csv file (.csv export does not allow multiple sheets) starting with the records in the first file name. You can remove file names from the list and they will not be exported or you can also rearrange the file names if you’d like the output in a different order.
- Note that if the tool cannot locate a file listed in this table -- concatenate_tablenames.csv -- it will create a warning note, but will continue running. If this happens, just click through the warnings.
- Each time the tool is run, the concatenate_summary.csv output file will be overwritten with new data. Rename the file or save as an .xlsx file in order to keep the previous results.
NOTE: This tool is not intended for systems planning analysis or MTP development. It is only intended for use in calculating the change in vehicle miles traveled (VMT) that will result from a change to land use entitlement for a specific location. Running the select link analysis as a part of this tool will overwrite the existing link assignment data fields, as intended, yielding slightly different results.
This tool was developed to support the use of VMT as a metric for project evaluation during a Traffic Impact Analysis (TIA) using the TRMG2. Depending on the project’s land use characteristics, a TIA site analysis using VMT as reporting measure may require different forms of VMT metrics. As identified during the VMT study for City of Raleigh, there are 4 VMT metrics under 2 categories supported in this suite of tools:
- Zone VMT Metrics
- Total VMT/capita (useful to evaluate large area land use plans)
- Home-based VMT per resident (useful to evaluate residential projects)
- Home-based work VMT per employee (useful to evaluate commercial projects)
- Link VMT Metric
- Total VMT: link VMT of the market area served by the project (useful to evaluate retail projects over 50,000 sqft).
A detailed definition of each metric can be found in the attached report. If your project has only one land use type or has a dominant use, then only one appropriate metric needs to be calculated. However, if the project is mixed use, the recommended approach is to distribute each land use type into separate TAZs in order to isolate the impact.
This tool calculates the three zone VMT metrics as mentioned above.
- Using the Tool
- First, using the Model dropdown menu in the TRMG2 interface, select the scenario of interest.
- Find the tool in the TRMG2 drop down menu: TRMG2 -> Tools -> TIA Site Analysis -> Zone VMT Metrics
- The default boundary used to generate a baseline threshold is for the City of Raleigh. NOTE: If the user would like to customize the geographic boundary used to generate the baseline threshold, this can be done by editing the boundary file located under the installation folder and path TRMG2\other_reportingtool\TIA_boundary.bin. Open the bin file and modify field name “is_in_boundary” to include a “1” only for the boundary zones of interest.

- Output
- Outputs are saved here: \output_summaries\VMT_TIA
- The following files are generated:
- Zone_VMT.csv: this spreadsheet contains the three zone VMT metrics by TAZ.
- TransCAD maps showing whether TAZ performs better or worse than the threshold determined by the input boundary.
Calculating link VMT metric is more complicated than zone VMT. It consisted of three steps – two of them are automated using this tool while the other one requires some manual work. These steps are described below:
This tool calculates traffic flow going into the study zone(s) of the TIA project. Before running this tool, you will need to build the link query - using the incoming direction of the centroid connectors of the study zone(s) and name the query “Query1”.
- Using the Tool
- First, using the Model dropdown menu in the TRMG2 interface, select the scenario of interest.
- Find the tool in the TRMG2 drop down menu: TRMG2 -> Tools -> TIA Site Analysis -> Link VMT Metric -> Select Link Analysis

- Output
- Outputs are saved here: \output\networks
- The following file is updated:
- Scenario_links.dbd: it will include critical query directional flow fields for each time of day.
In this step, you will need to identify the cutoff threshold for the local and extended markets served by the project. This step is done manually outside of the tool by following the steps below:
- Create the “Total_Flow_Query1” field in the scenario_links.dbd file of the project scenario using the formula “AB_Flow_Query1_AM + BA_Flow_Query1_AM + AB_Flow_Query1_MD + BA_Flow_Query1_MD + AB_Flow_Query1_PM + BA_Flow_Query1_PM + AB_Flow_Query1_NT + BA_Flow_Query1_NT”
- Create a selection set of links named “highway” that exclude non-highway links using query “HCMType <> 'TransitOnly' and HCMType <> null and HCMType <> 'CC'”
- Calculate the sum of “Total_Flow_Query1” for “highway” selection set – this serves as the regional select link flow total.
- Calculate 96% and 90% of the regional select link flow total, which will become the target value for the extended market flow total and the local market flow total, respectively.
- Starting with a general default value of 5 trips, create a subset of “highway” using query “Total_Flow_Query1 >= 5” and see if the sum of “Total_Flow_Query1” for the new subset matches the targeted local market flow as calculated in Step 4 (or within 1% difference).
- If yes, then “5” becomes the minimum number of trips for local market.
- If not, repeat step #5 with a new cutoff number.
- Repeat step #5 to define the minimum number of trips for the extended market, such that you match the targeted extended market flow. The starting point for this minimum number of trips will be lower than that identified for the local market.
This tool calculates total daily VMT of the markets specified in the earlier step (local, extended, and regional) served by the project. Before running this tool, make sure have two completed scenarios: a scenario with the project and a base scenario without the project.
- Using the Tool
- First, using the Model dropdown menu in the TRMG2 interface, select the scenario with the project.
- Find the tool in the TRMG2 drop down menu: TRMG2 -> Tools -> TIA Site Analysis -> Link VMT Metric -> Calculate Link VMT
- Fill the minimum number of trips for each market based on the cutoff threshold defined in earlier step.
- Select the scenario directory without the project as the base scenario.

- Output
- Outputs are saved here: \output_summaries\VMT_TIA
- The following file is generated:
- Link_vmt.csv: it will include total daily link VMT for each markets and scenario.