The app allows the user to visually analyze the electricity and gas consumption behavior of his customers in order to highlight trends and anomalies. As an energy consultant the goal of the project was to enhance my energy consulting services and to gain experience using tools such as React, D3, JSON web tokens, GraphQL and Strapi (headless CMS).
User should be able to:
- upload a 3-year time series for each of his clients to a content management system (CMS)
- log into account
- display the list of all his clients in a sidebar
- search for a specific client
- print the report with charts and comments in PDF
Type of charts requested:
- Line plot with three groups
- Grouped barplot
- Scatterplot
Dummy data can be found here:
Run the backend (instructions)
To clone and run the frontend, you'll need Git and Node.js (which comes with npm) installed on your computer. From your command line:
# Clone the following repository - frontend
$ git clone https://github.com/StefanoFrontini/energy-dashboard.git

# Go into the repository
$ cd energy-dashboard

# Install dependencies
$ npm install

# Run the frontend
$ npm start- HTML
- Javascript
- CSS Flexbox and Grid
- React
- React router v6
- React Markdown
- React-to-print
- React icons
- Js-cookie
- D3
- GraphQL
- Deployed on Netlify
- Strapi v4 (Headless CMS)
- Deployed on Heroku
As Amelia Wattenberger stated in this article:
These two technologies (React and D3) are notoriously tricky to combine. The crux of the issue is that they both want to handle the DOM.
What are the benefits of using standard JSX instead of running d3 code on mount? Following Amalia:
- Declarative instead of imperative. The code describes what is being drawn, instead of how to draw it.
- Less code.
- Less hacky. React is, chiefly, a rendering library, and has many optimizations to keep our web apps performant. When adding elements using d3, we're hacking around React, and essentially have to fight against those optimizations. Hacking around your JS framework is a recipe for future frustration, especially if the framework's API changes.
So I decided to let React handle the DOM and use the powerful D3 primitives.
For example to render a line chart that displays 3 groups:
I used the d3.line primitive that creates a SVG path string, that can be used inside a path d attribute.
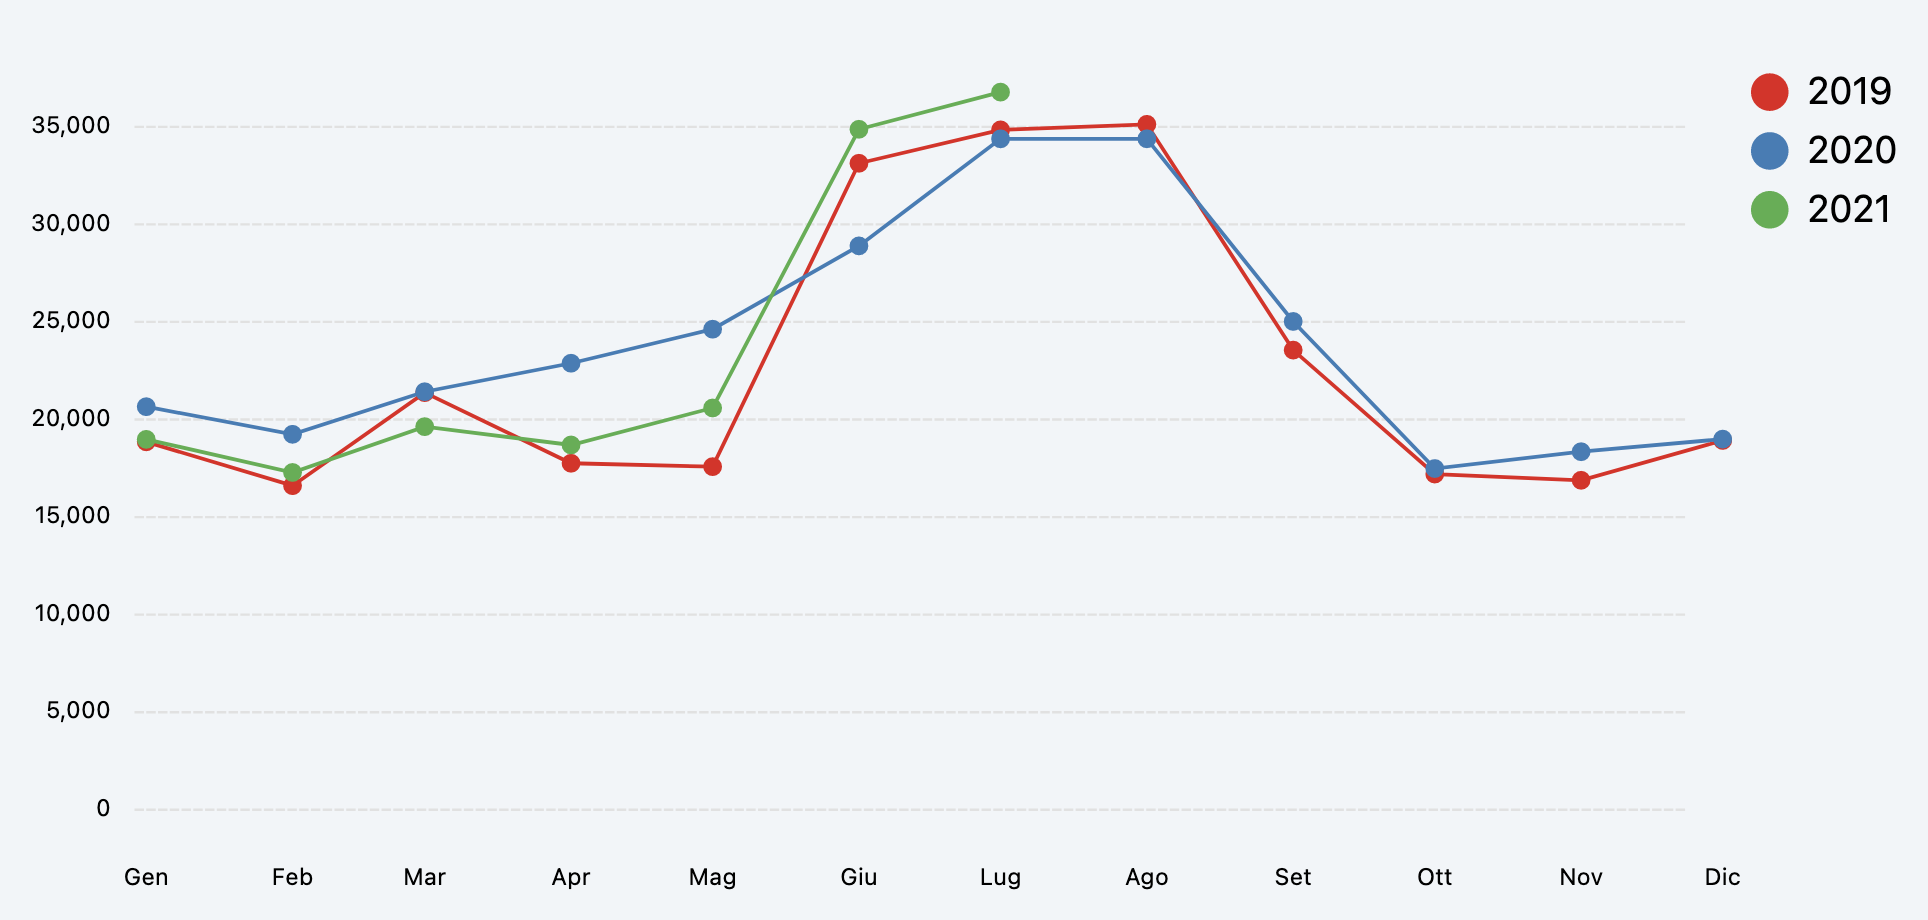
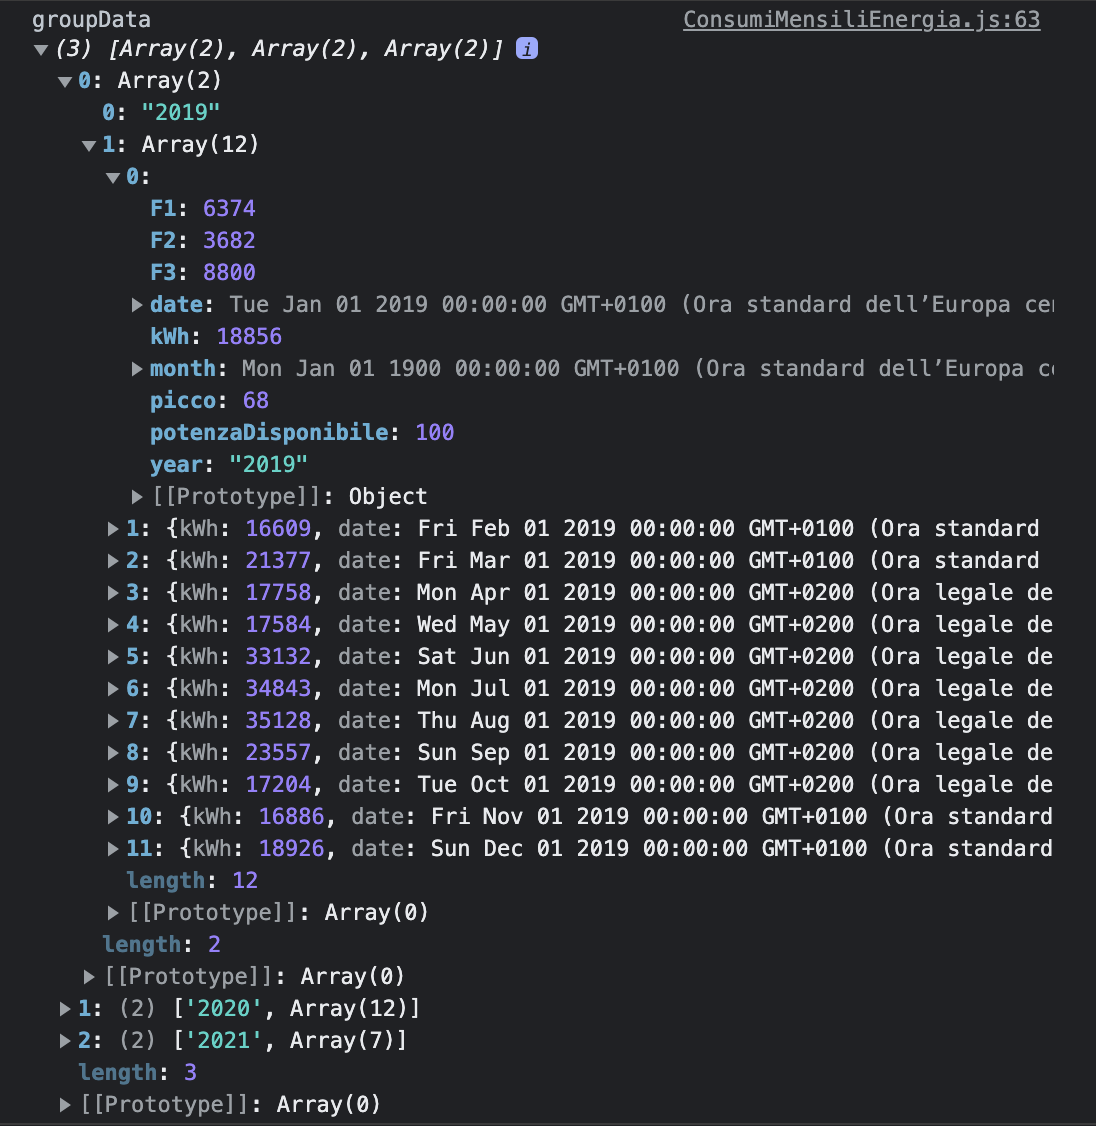
Let the dataset (groupData) be:
import { line, scaleTime, scaleLinear, max, extent } from "d3";

// x and y accessors
const xValue = (d) => d.month;
const yValue = (d) => d.kWh;

// x and y scales. These two functions map data points to pixel points
const xScale = scaleTime()
  .domain(extent(groupData, xValue))
  .range([0, innerWidth]);

const yScale = scaleLinear()
  .domain([0, max(groupData, yValue)])
  .range([innerHeight, 0]);

//lineGenerator is a function built on top of d3.line. line.x() sets or reads the x accessor for the line, and line.y the y accessor.
const lineGenerator = line()
  .x((d) => xScale(xValue(d)))
  .y((d) => yScale(yValue(d)));
If we feed the lineGenerator with the data of the first line we want to draw we get the SVG path string:
console.log(lineGenerator(groupData[0][1]));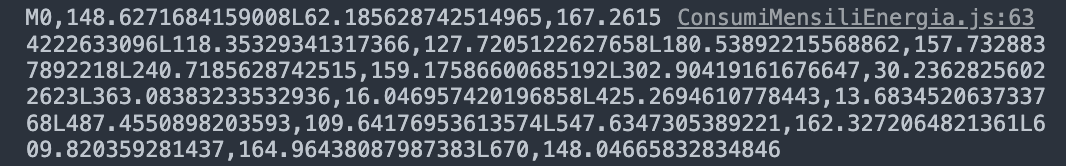
Finally we can let React render the SVG path string in our component:
return (
  <svg>
    <g>
      {groupData.map((item) => {
        return (
          <g key={item[0]}>
            <path d={lineGenerator(item[1])} />
          </g>
        );
      })}
    </g>
    ;
  </svg>
);Once I figured it out how React would render the data to generate the line chart with multiple groups and so the shape of the dataset it expects - basically a nested array, see the chart above (groupData) - I faced the problem of how to generate the nested array starting from the dataset I got from the API (d3Data):
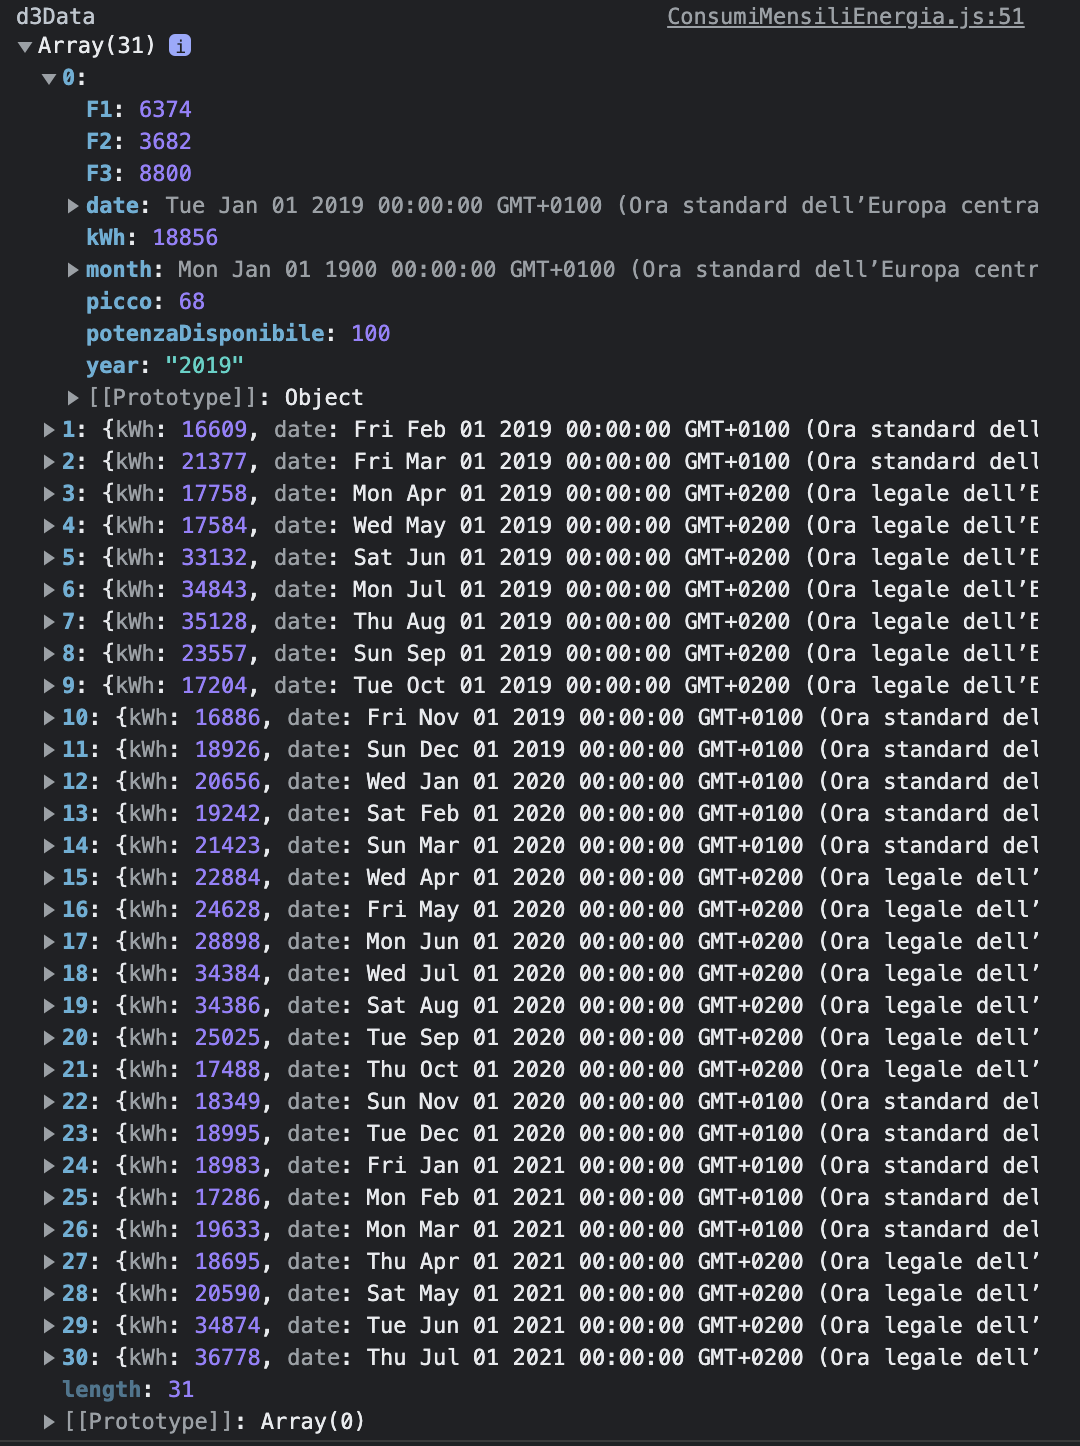
Luckily D3 has a function called d3.groups that does just that:
import { groups } from "d3";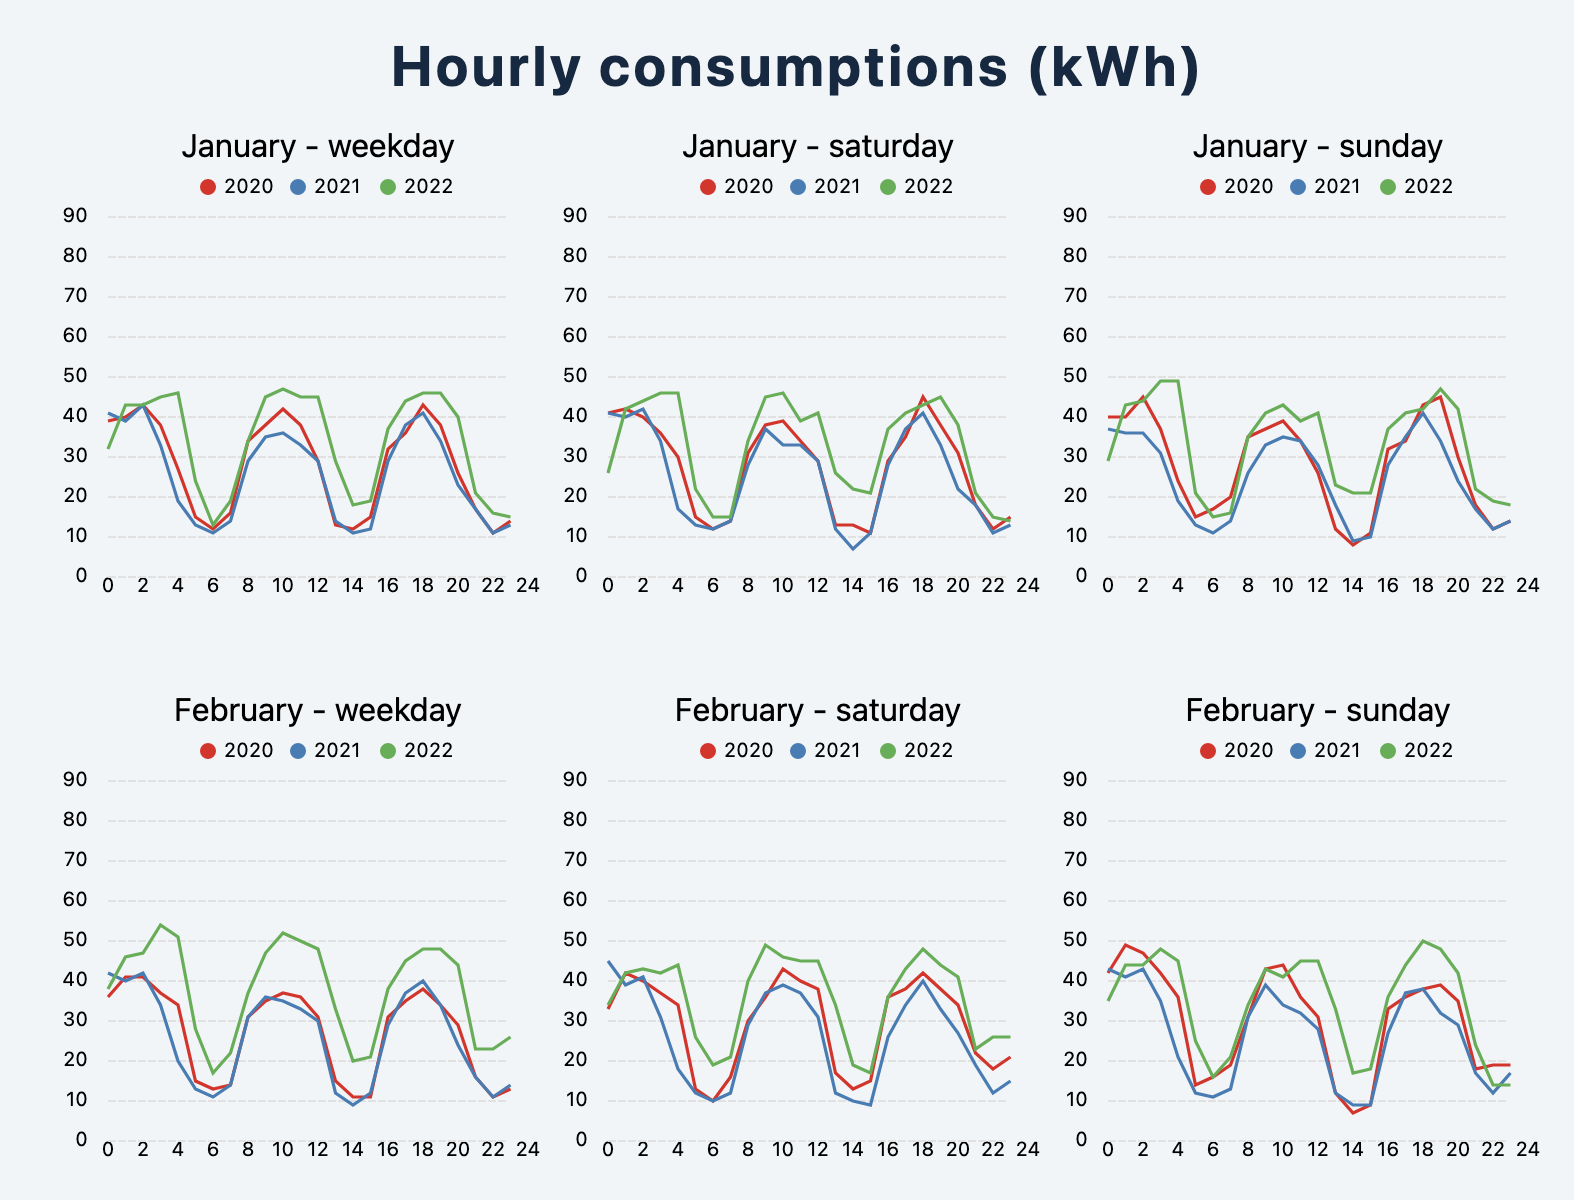
const groupData = groups(d3Data, (d) => d.year);The challenge level has risen a lot when I wanted to draw the hourly consumptions charts. I wanted to compare hourly consumption from year to year, month to month, working day to working day, Saturday to Saturday and Sunday to Sunday
The first chart (January - weekday) shows the average consumption in a working day of January of 2019, 2020 and 2021. How to generate a deep nested array and at the same time calculating the average consumption starting from the dataset I get from the API (D3DataOrari)?
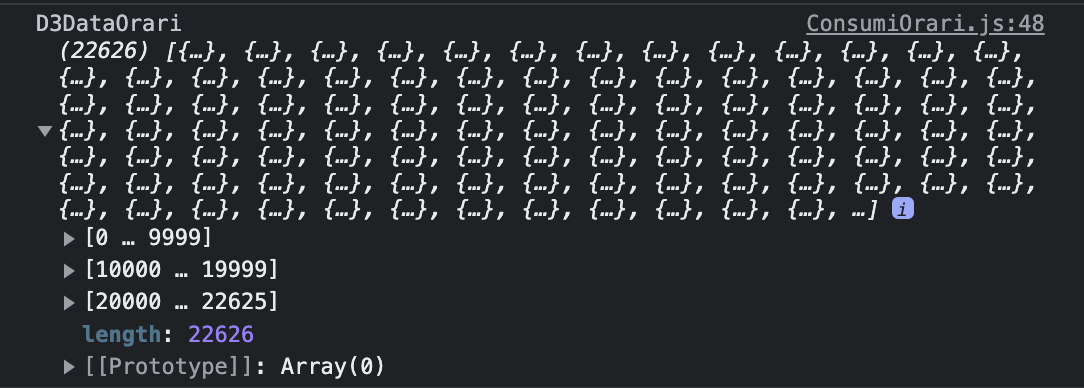
The key here was to discover the d3.rollups function:
d3.rollups lets you “reduce” each group by computing a corresponding summary value, such as a mean.
import { rollups, mean } from "d3";

const yearValue = (d) => d.year;
const monthValue = (d) => d.month;
const giornoTipoValue = (d) => d.giornoTipo;
const hourValue = (d) => d.ora;
const kWhValue = (d) => d.kWh;

const rollupData = rollups(
  d3DataOrari,
  // reducer
  (v) => Math.round(mean(v, kWhValue)),
  yearValue,
  monthValue,
  giornoTipoValue,
  hourValue
);
console.log(rollupData);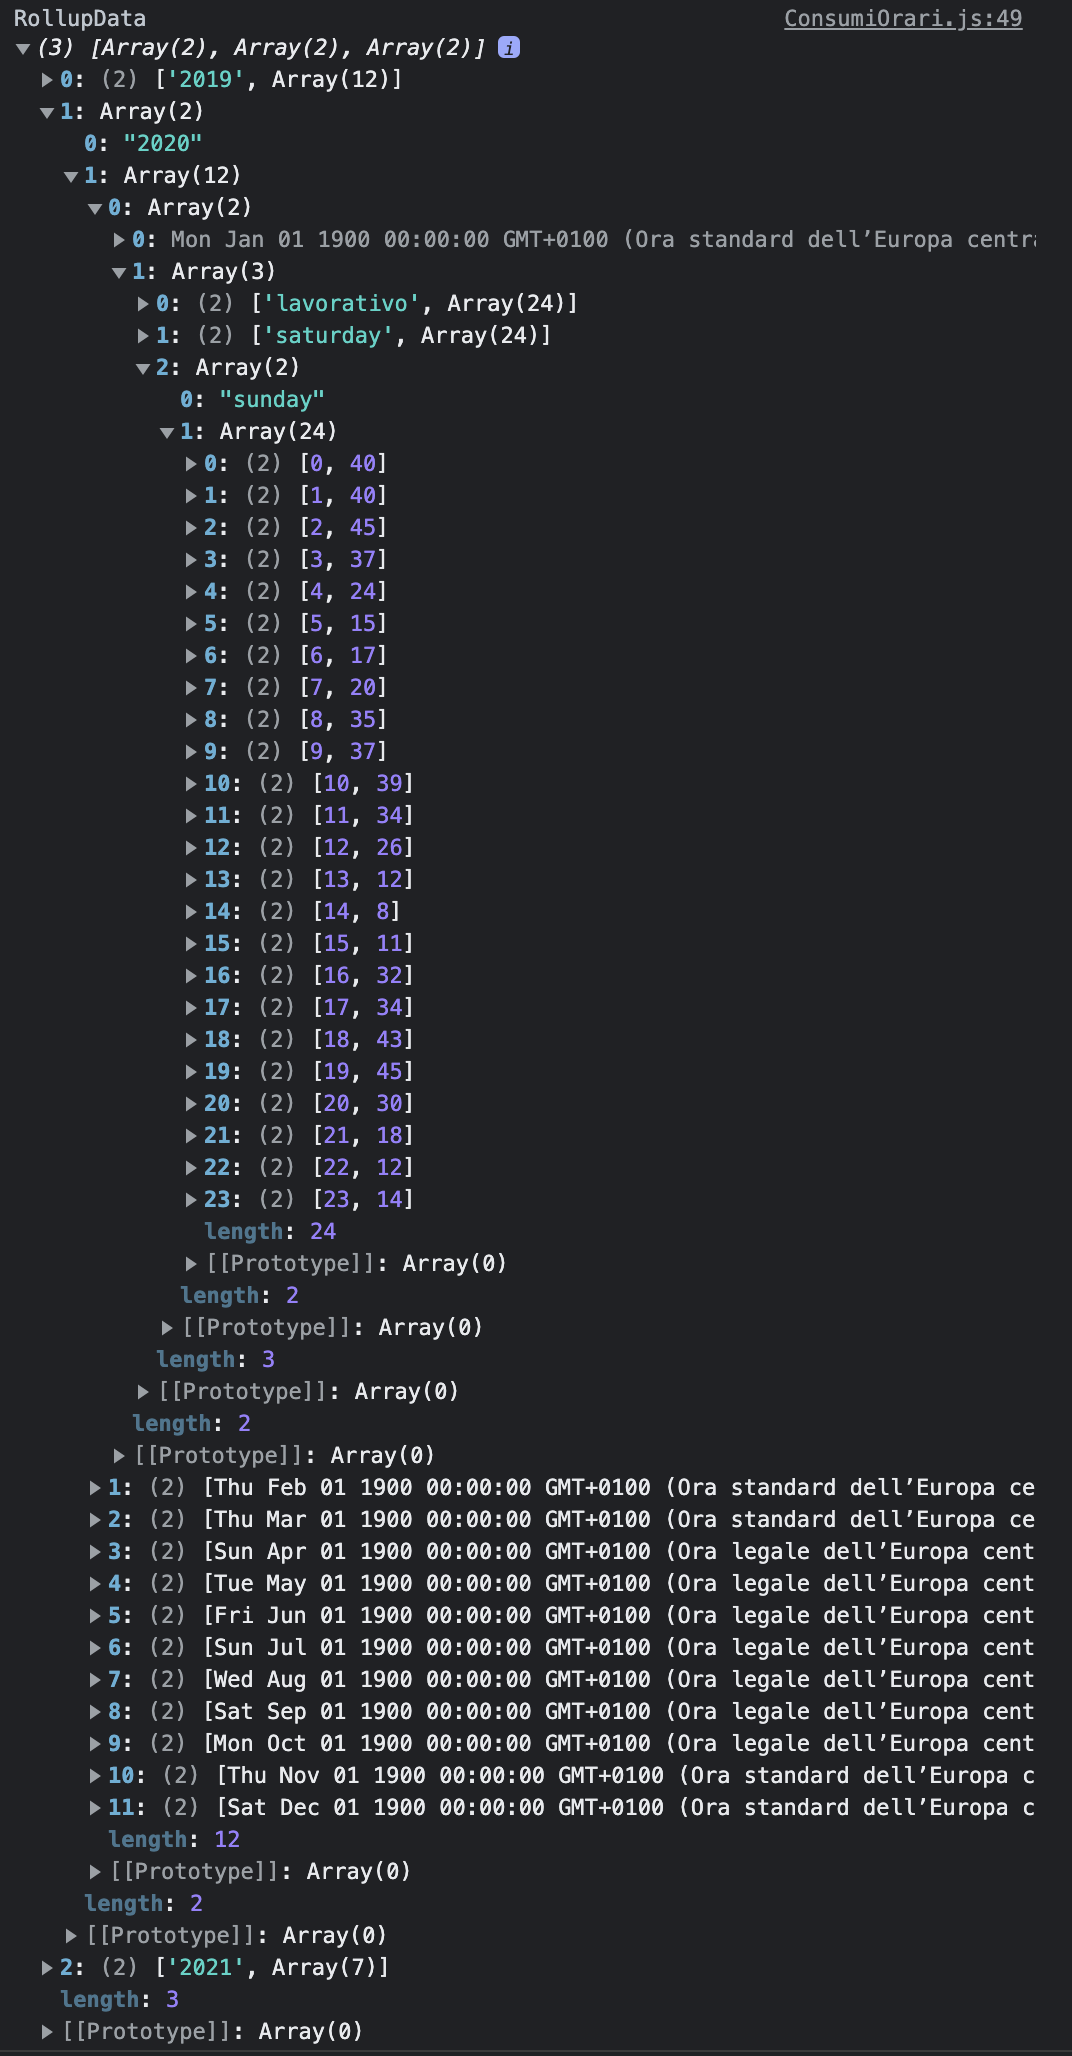
To authenticate the user I combined these technologies:
- JWT tokens
- Cookies
- Context API
- useReducer Hook
To store the JWT tokens I get from STRAPI I used the library js-cookie.
When a user authenticates the useReducer Hook dispatches a LOGIN action which updated the state. Now the user can do authenticated requests to get the private data of his clients.
Context API provides a way to pass data through the component tree without having to pass props down manually at every level (props drilling).
Strapi v4 made some breaking changes to the GraphQL layer with respect to Strapi v3.
To get the data from the API I basically needed two types of queries:
- Get the list of all the Clients to populate the sidebar:
import axios from "axios";
import { useState, useEffect } from "react";

const { REACT_APP_URL } = process.env;

const GET_TEST_AZIENDAS = `query {
  testAziendas(pagination: { limit: -1 }, sort:"ragioneSociale:asc"){
    data{
      id
      attributes{
        ragioneSociale
        partitaIva
        pods{
          data{
            id
            attributes{
              indirizzo
              podId
            }
          }
        }
        pdrs{
          data{
            id
            attributes{
              indirizzo
              pdrId
            }
          }
        }
      }
    }
  }
}`;

const useTestAziendaData = (auth) => {
  const [data, setData] = useState([]);
  const [loadingAziendaData, setLoadingAziendaData] = useState(false);

  const fetchAziendas = async () => {
    setLoadingAziendaData(true);

    try {
      const {
        data: {
          data: {
            testAziendas: { data },
          },
        },
      } = await axios({
        url: REACT_APP_URL,
        method: "POST",
        data: {
          query: GET_TEST_AZIENDAS,
        },
      });
      if (data) {
        setData(data);
        setLoadingAziendaData(false);
      } else {
        setData([]);
      }
      setLoadingAziendaData(false);
    } catch (error) {
      console.log(error);
      setLoadingAziendaData(false);
    }
  };
  useEffect(() => {
    if (!auth) {
      fetchAziendas();
    }
  }, [auth]);
  return { data, loadingAziendaData };
};

export default useTestAziendaData;- Get the data from a specific meter:
const GET_TEST_POD_DATA = `query ($id: ID!){
  testPod(id: $id){
    data{
      id
      attributes{
        podId
        indirizzo
        consumiMensili
        consumiOrari
        fasceCommento
        mensiliCommento
        piccoCommento
        piccoConsumiCommento
        orariCommento
        azienda {
          data{
            id
            attributes{
              ragioneSociale
            }
          }
        }

      }
    }
  }
}`;

const useTestPodData = (auth) => {
  const [loadingPodData, setLoadingPodData] = useState(false);
  const [data, setData] = useState({});
  const [podId, setPodId] = useState("1");
  const fetchPod = useCallback(async () => {
    let variables = {};
    variables.id = podId;
    setLoadingPodData(true);
    try {
      const {
        data: {
          data: {
            testPod: { data },
          },
        },
      } = await axios({
        url: REACT_APP_URL,
        method: "POST",

        data: {
          query: GET_TEST_POD_DATA,
          variables,
        },
      });

      if (data) {
        const dataset = transform(data.attributes.consumiMensili.data);
        const domain = extent(dataset, (d) => d.date);
        const start = formatTime(domain[0]);
        const end = formatTime(domain[1]);

        const rawData = {
          ragioneSociale:
            data.attributes.azienda.data.attributes.ragioneSociale,
          pod: data.attributes.podId,
          indirizzo: data.attributes.indirizzo,
          mensiliCommento: data.attributes.mensiliCommento,
          fasceCommento: data.attributes.fasceCommento,
          piccoCommento: data.attributes.piccoCommento,
          piccoConsumiCommento: data.attributes.piccoConsumiCommento,
          orariCommento: data.attributes.orariCommento,
          d3Data: transform(data.attributes.consumiMensili.data),
          d3DataOrari:
            data.attributes.consumiOrari &&
            transformOrari(data.attributes.consumiOrari.data),
          inizioPeriodo: start,
          finePeriodo: end,
        };

        setData(rawData);
        setLoadingPodData(false);
      } else {
        setData([]);
        setLoadingPodData(false);
      }
      setLoadingPodData(false);
    } catch (error) {
      console.log(error);
      setLoadingPodData(false);
    }
  }, [podId]);
  useEffect(() => {
    if (!auth) {
      fetchPod();
    }
  }, [podId, fetchPod, auth]);
  return { data, podId, setPodId, loadingPodData };
};

export default useTestPodData;
Testing involves the login functionality and the updating of the dashboard when the user clicks on his clients.
Unit tests made with:
- React Testing Library
- Jest
End-to-End tests made with:
- Cypress
- Cypress Testing Library
While unit testing the component LoginForm.js I ecountered an issue related to d3. Solved by adding this line to package.json:
"jest": {
    "transformIgnorePatterns": [
      "/node_modules/(?!d3|d3-array|internmap|delaunator|robust-predicates)"
    ]
  }
When the app make use of the Context API and React Router the unit tests must take this into account by wrapping the component to test with the AppProvider and the Router component:
import { render, screen } from "@testing-library/react";
import userEvent from "@testing-library/user-event";
import LoginForm from "./LoginForm";
import { AppProvider } from "../context";
import { BrowserRouter as Router } from "react-router-dom";

test("on initial render, the submit button is disabled", () => {
  const state = {
    user: {},
    isAuthenticated: false,
    isModalOpen: false,
    modalContent: "",
  };
  render(
    <AppProvider value={state}>
      <Router>
        <LoginForm />
      </Router>
    </AppProvider>
  );
  expect(screen.getByRole("button", { name: /submit/i })).toBeDisabled();
});
The login functionality has also been tested with Cypress (/cypress/login_spec.js):
describe("login", () => {
  it("user can login", () => {
    // visit home page
    cy.visit("/");

    // login button should be visible
    cy.findByRole("link", {
      name: /login/i,
    }).should("be.visible");

    // click login button
    cy.findByRole("link", {
      name: /login/i,
    }).click();

    // email input should be visible
    cy.findByRole("textbox", {
      name: /email\/username/i,
    }).should("be.visible");
    cy.findByRole("textbox", {
      name: /password/i,
    }).should("be.visible");

    // fill in email and password
    cy.findByRole("textbox", {
      name: /email\/username/i,
    }).type("xxx");
    cy.findByRole("textbox", {
      name: /password/i,
    }).type("xxx");

    // click submit
    cy.findByRole("button", { name: /submit/i }).click();

    // expect to see welcome message
    cy.findByText(/welcome/i).should("be.visible");

    // expect to be redirected to dashboard
    cy.findByRole("button", {
      name: /show clients/i,
    }).should("be.visible");

    // expect to click on show clients button
    cy.findByRole("button", {
      name: /show clients/i,
    }).click();

    // expect to see search bar
    cy.findByRole("heading", {
      name: /antama di tacchella angelo & c\./i,
    }).should("be.visible");

    // expect to click on a + button
    cy.get('[data-id="46"] > .sidebar-circle').click();

    // expect to see the address
    cy.findByRole("heading", {
      name: /cascina coronate snc \- 20081 morimondo \(mi\)/i,
    }).should("be.visible");

    // expect to click on a pod button
    cy.findByRole("heading", {
      name: /cascina coronate snc \- 20081 morimondo \(mi\)/i,
    }).click();

    // expect to update dashboard
    cy.findByText(/pod: it001e14906490/i);
  });
});I deployed the frontend to Netlify.
When I push a new commit on Github, Netlify triggers a new build.