

A self-taught web developer based in Milan, Italy.


My passion for programming and my desire for learning has grown enormously in recent years and this has prompted me to change my career! 🏃♂️✨
I've always been interested in technology. I was really happy that day when my parents gave me the Commodore 64 as a gift. In addition to having fun with the games, I remember the emotion while writing the first few lines of code in Basic taken from a book I had ordered by mail.
In 2016 I asked a web developer to help me create myguitarsongs.com. A simple change to the CSS of the site made without the help of the developer has rekindled my old passion for programming.
After studying the basics of programming thanks to Zed A. Shaw's book "Learn Python The Hard Way" I started building my first projects:
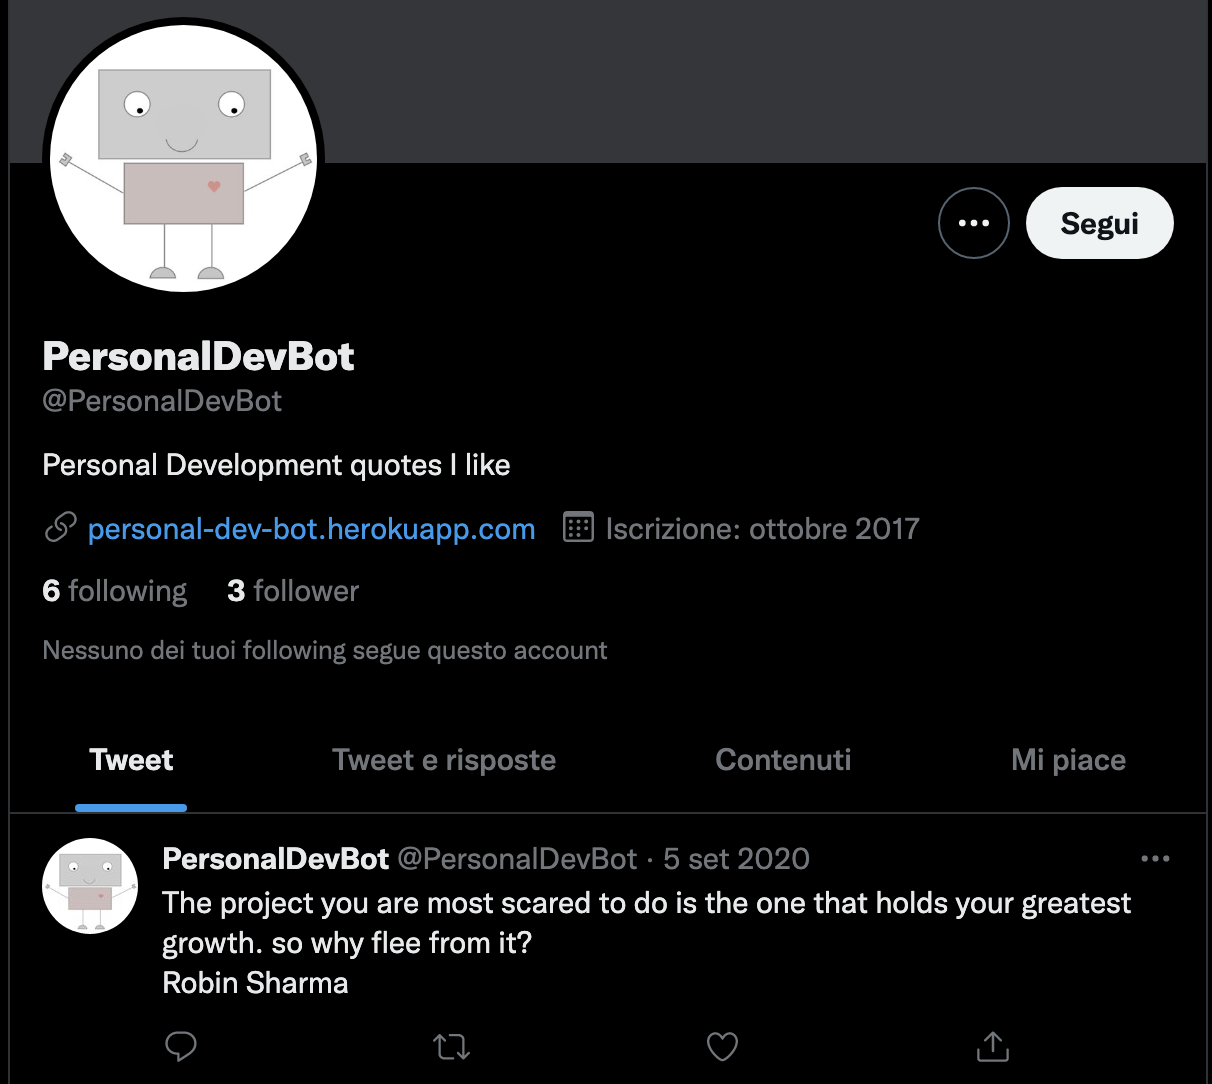
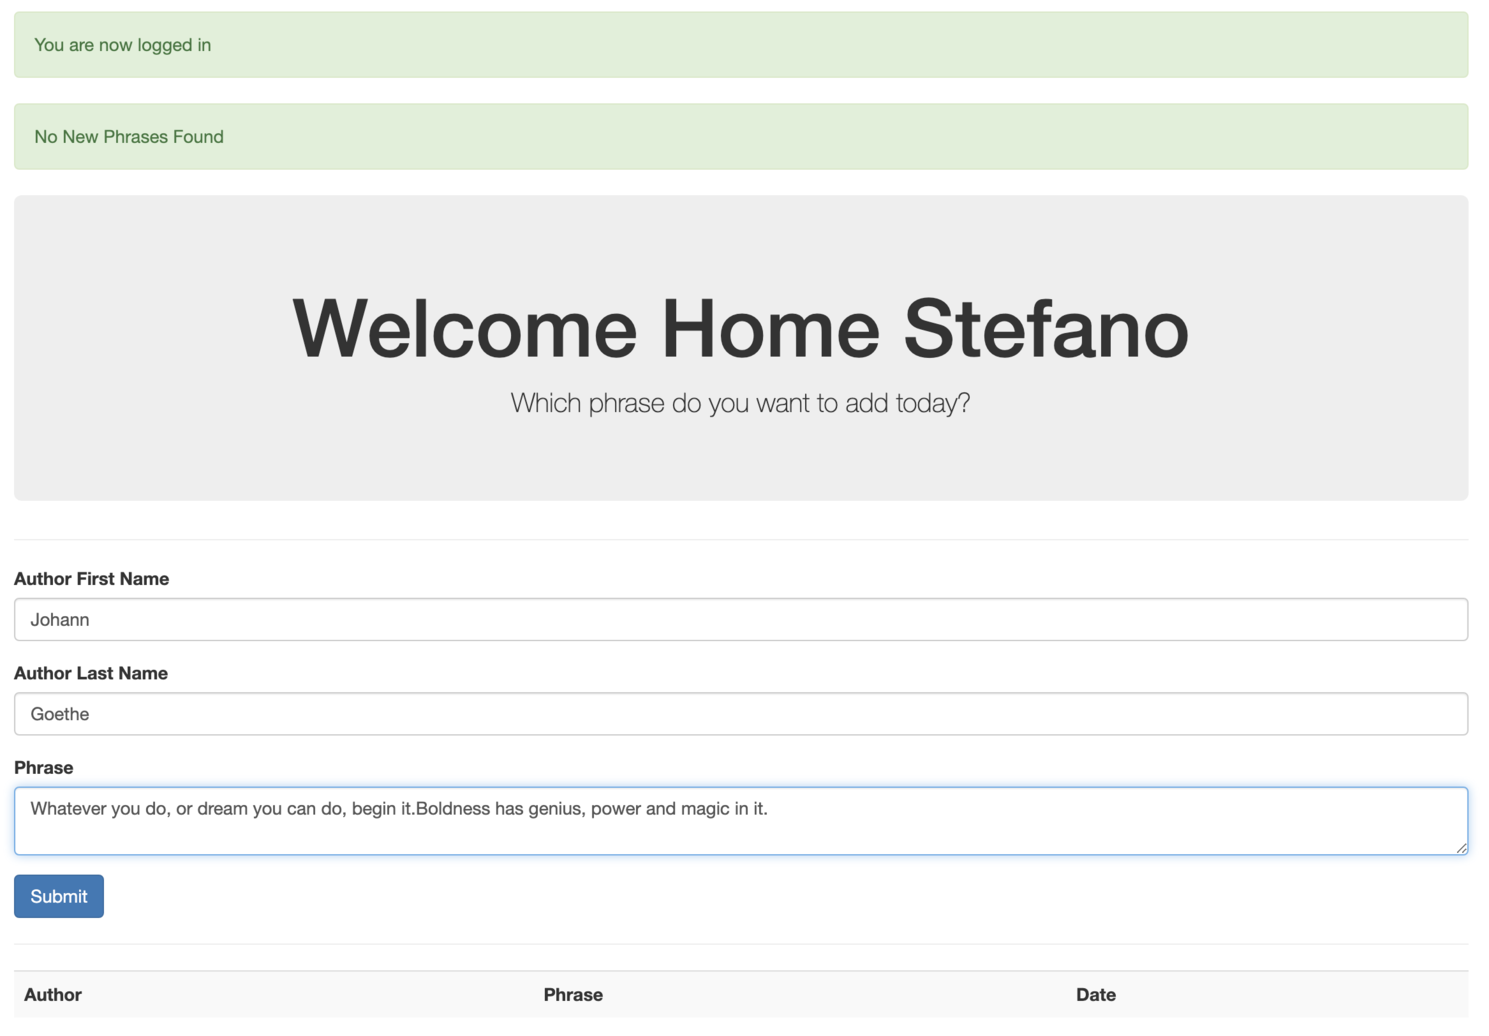
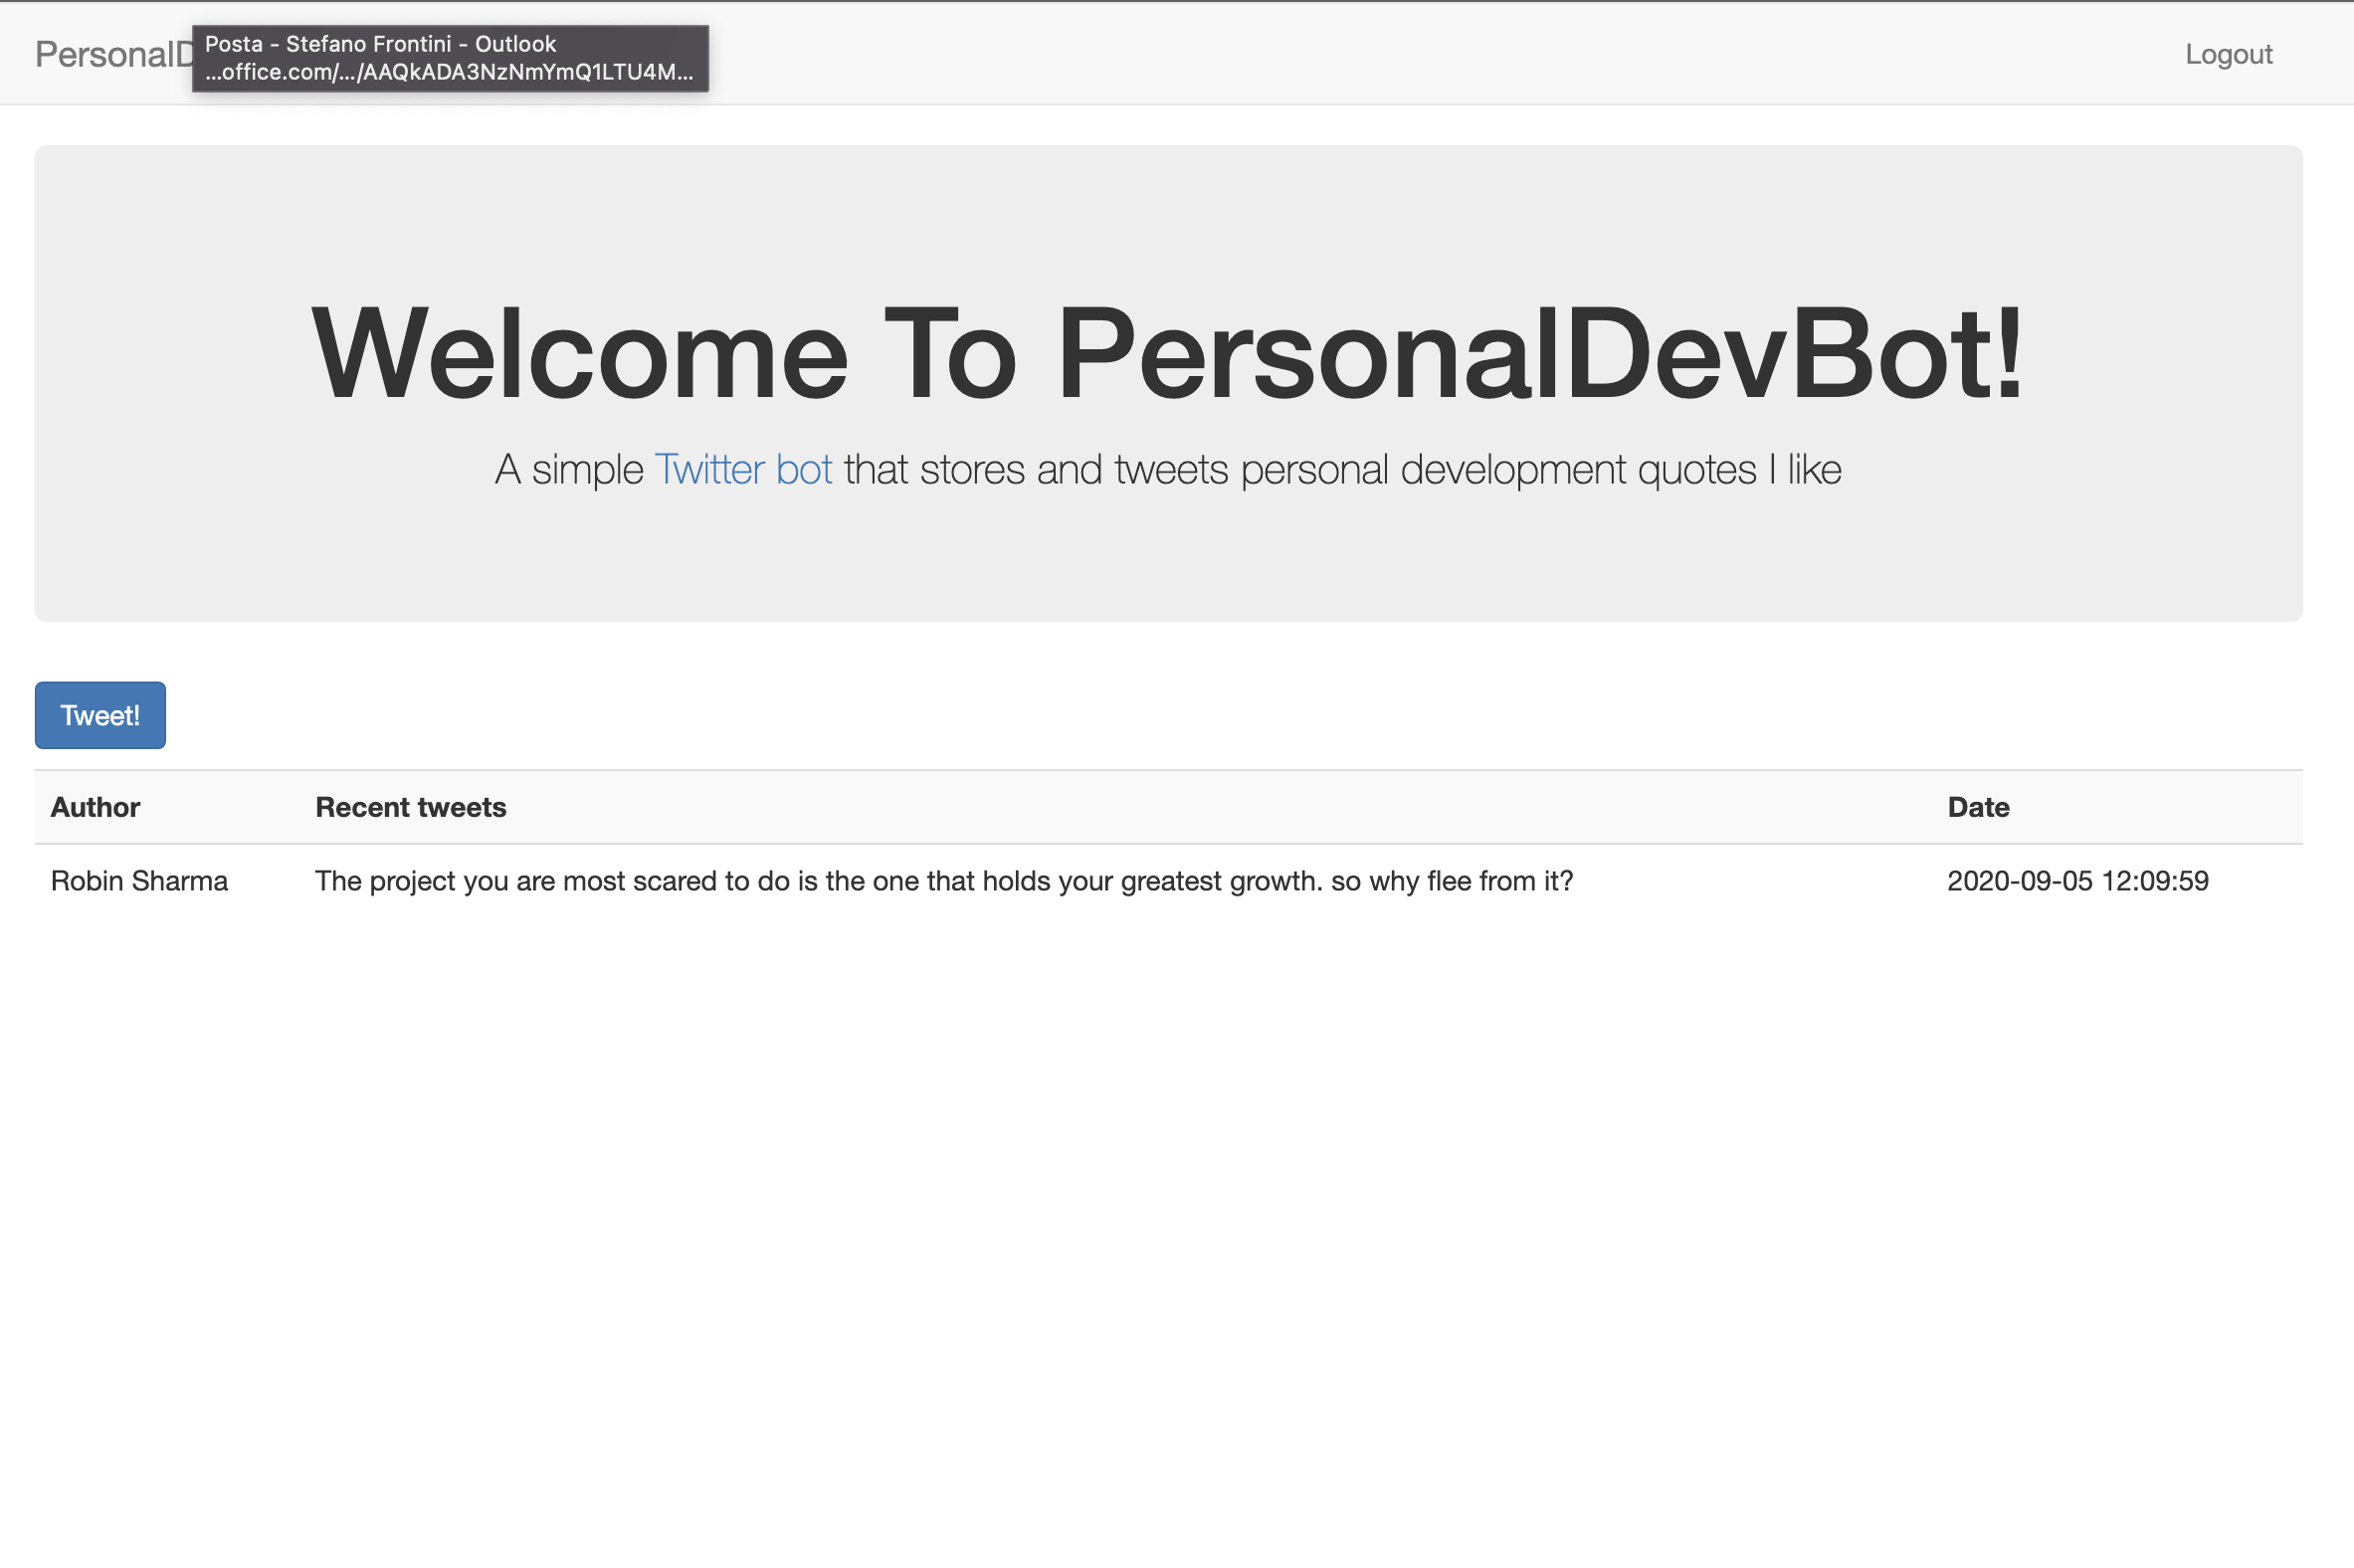
In 2017 I built PersonalDevBot a web application connected to a Twitter bot that allowed me to save personal development quotes I liked on a database and then with a simple click on a button of the UI to publish them on Twitter. I built it with Python, Flask, mySQL. Building this application helped me learn about backend development: SQL queries and CRUD operations on a database, Schema, create and delete tables. I also learned the Flask web framework and how to implement user authentication.
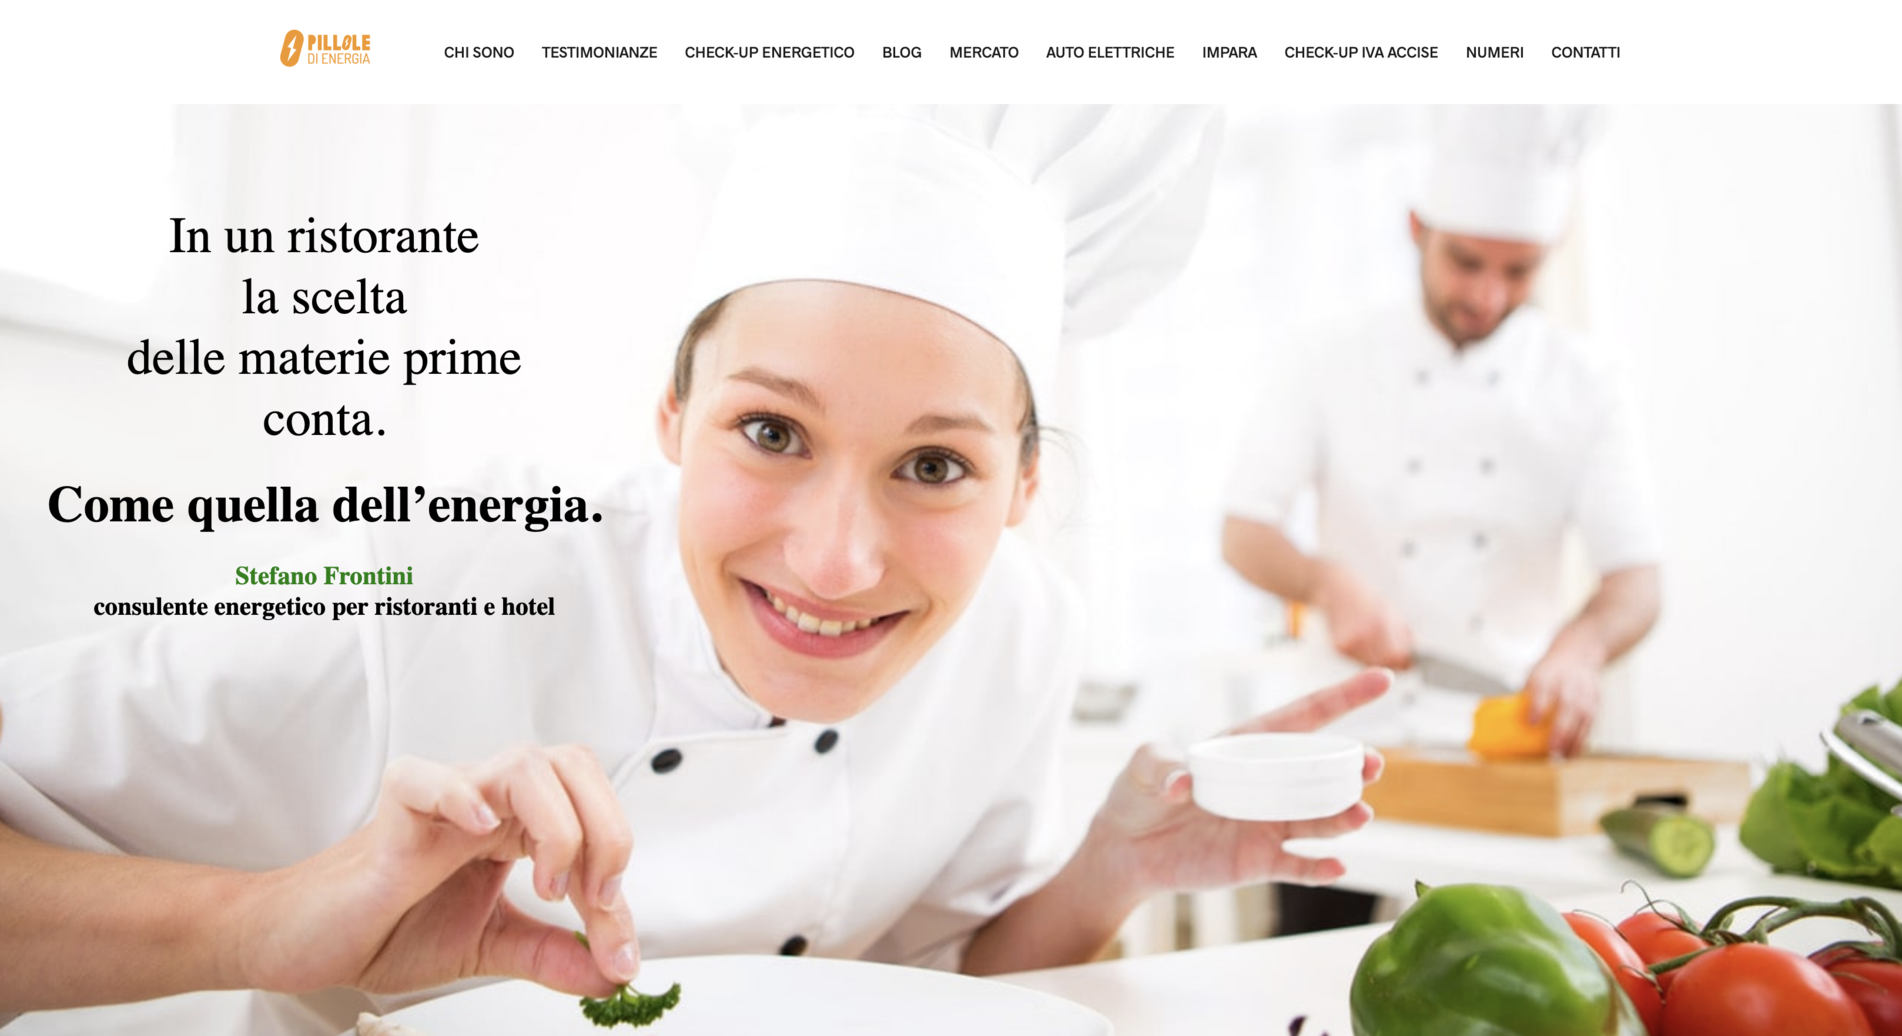
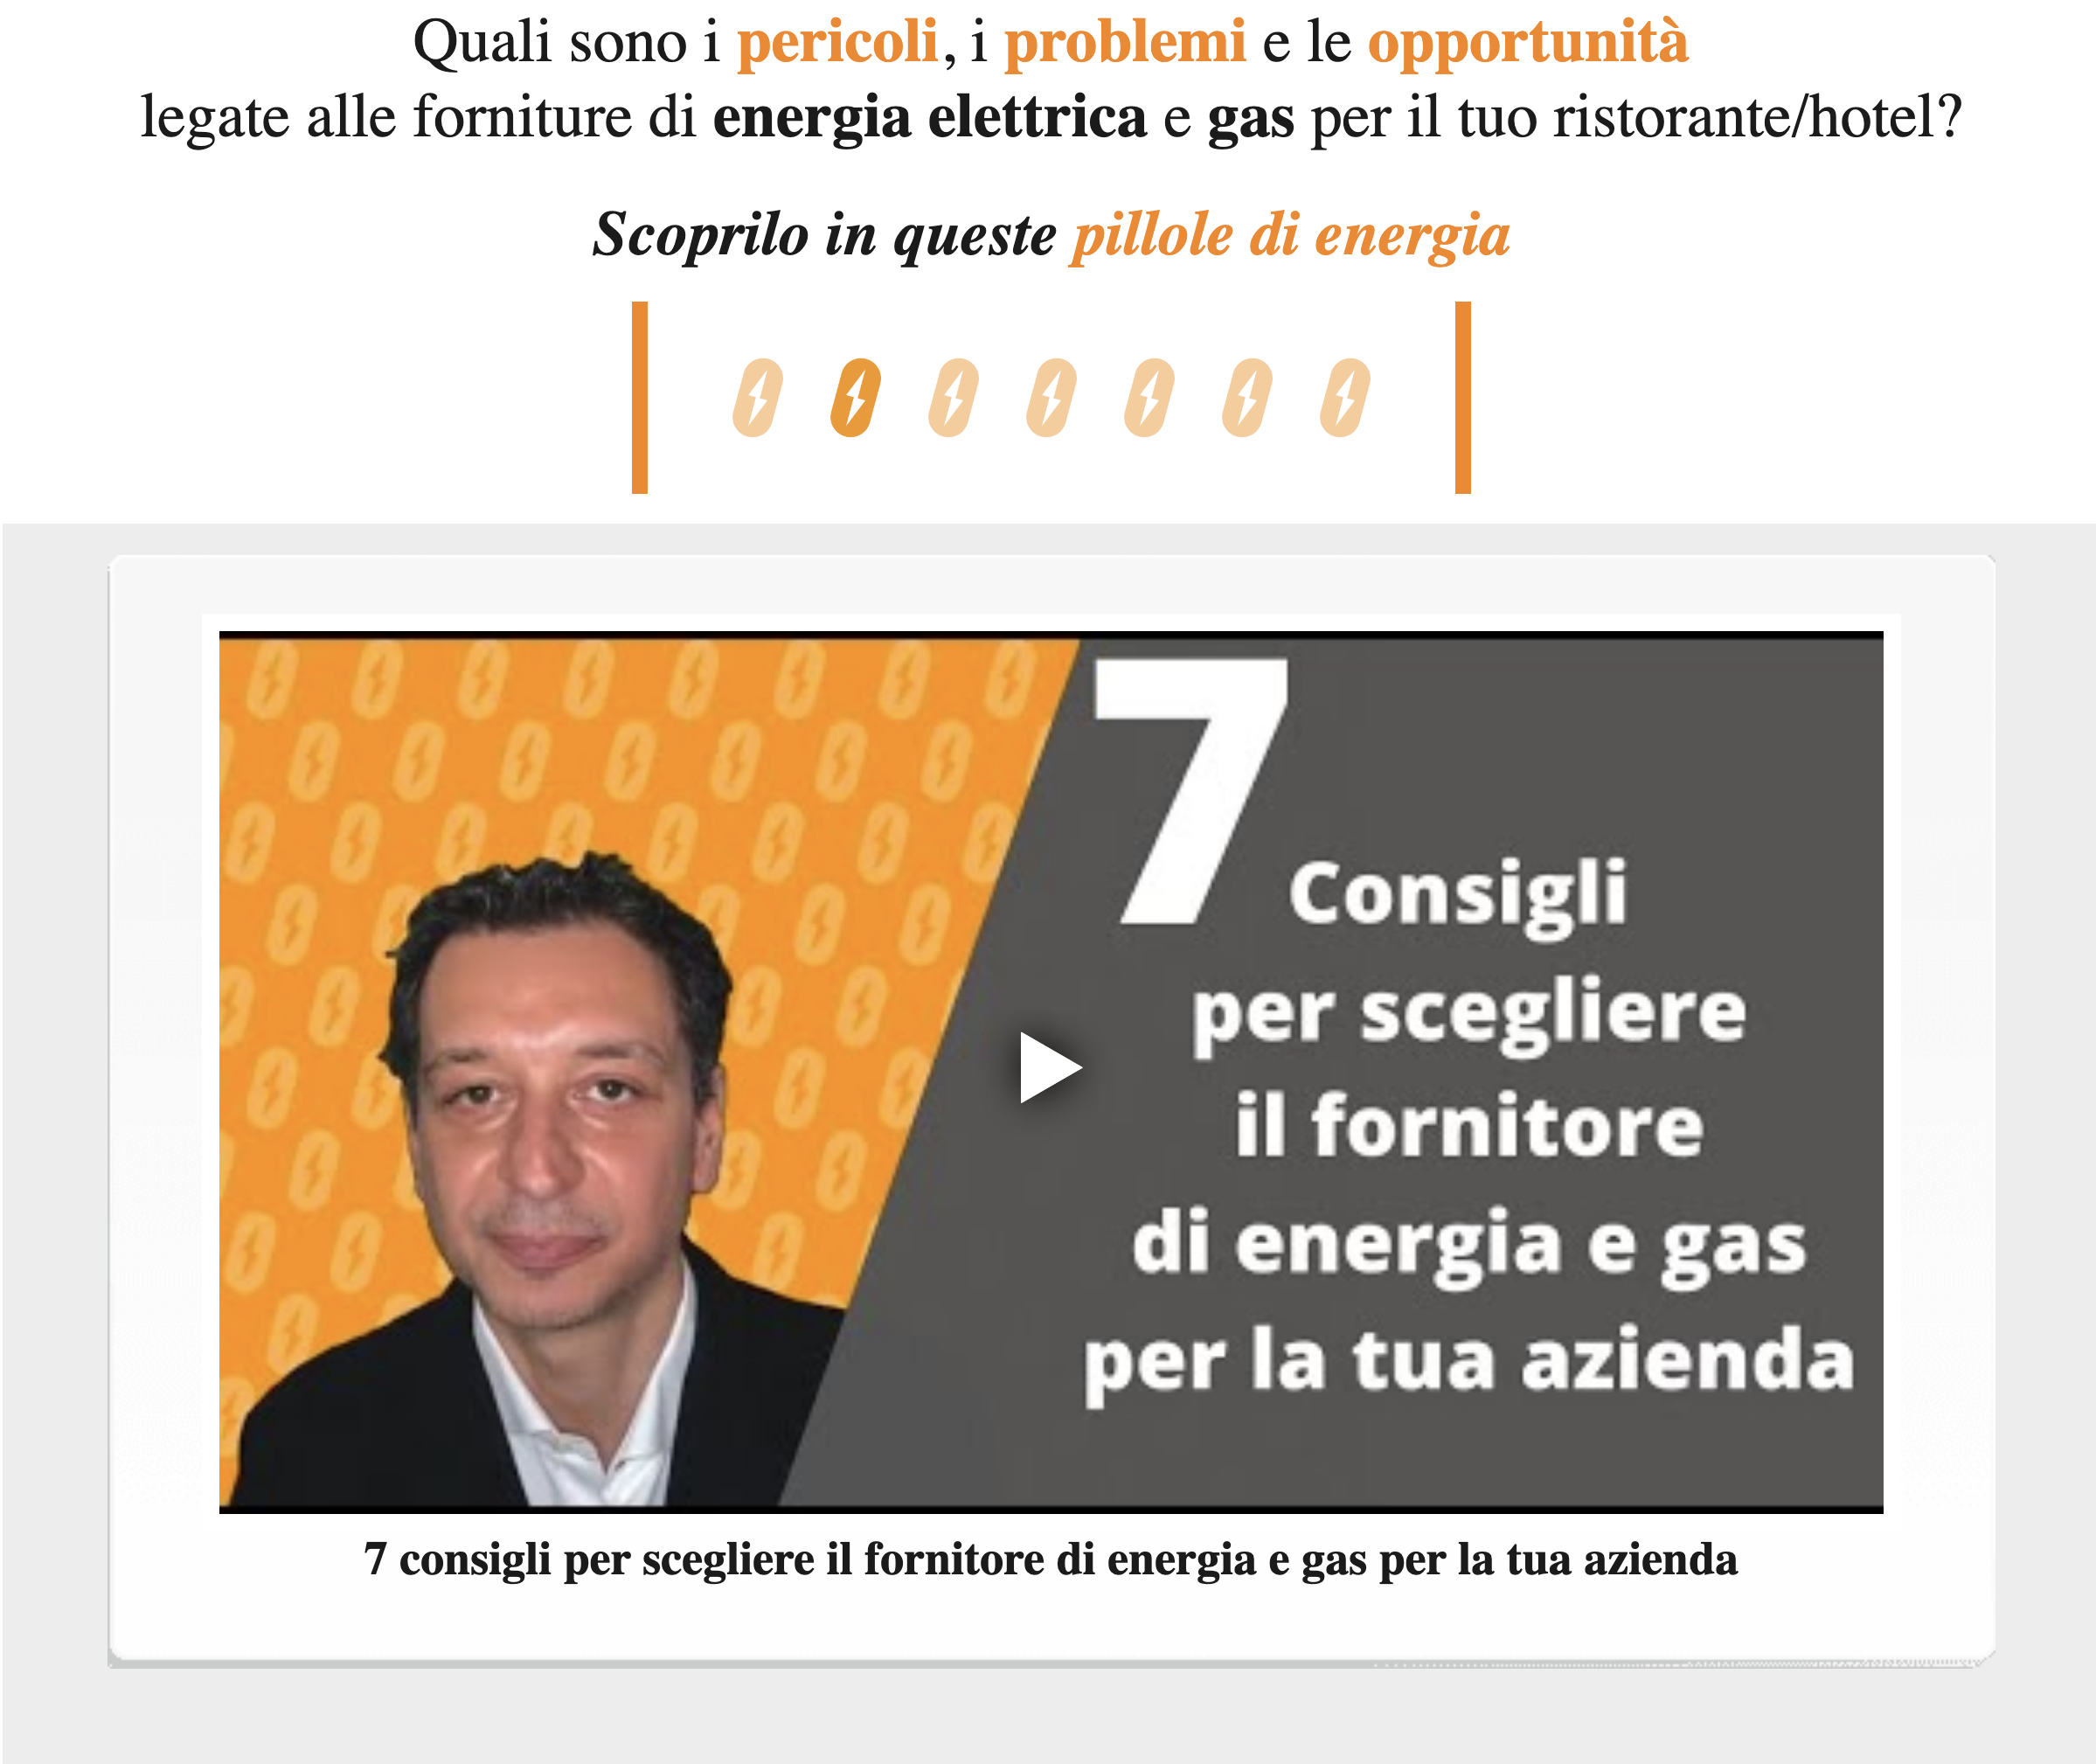
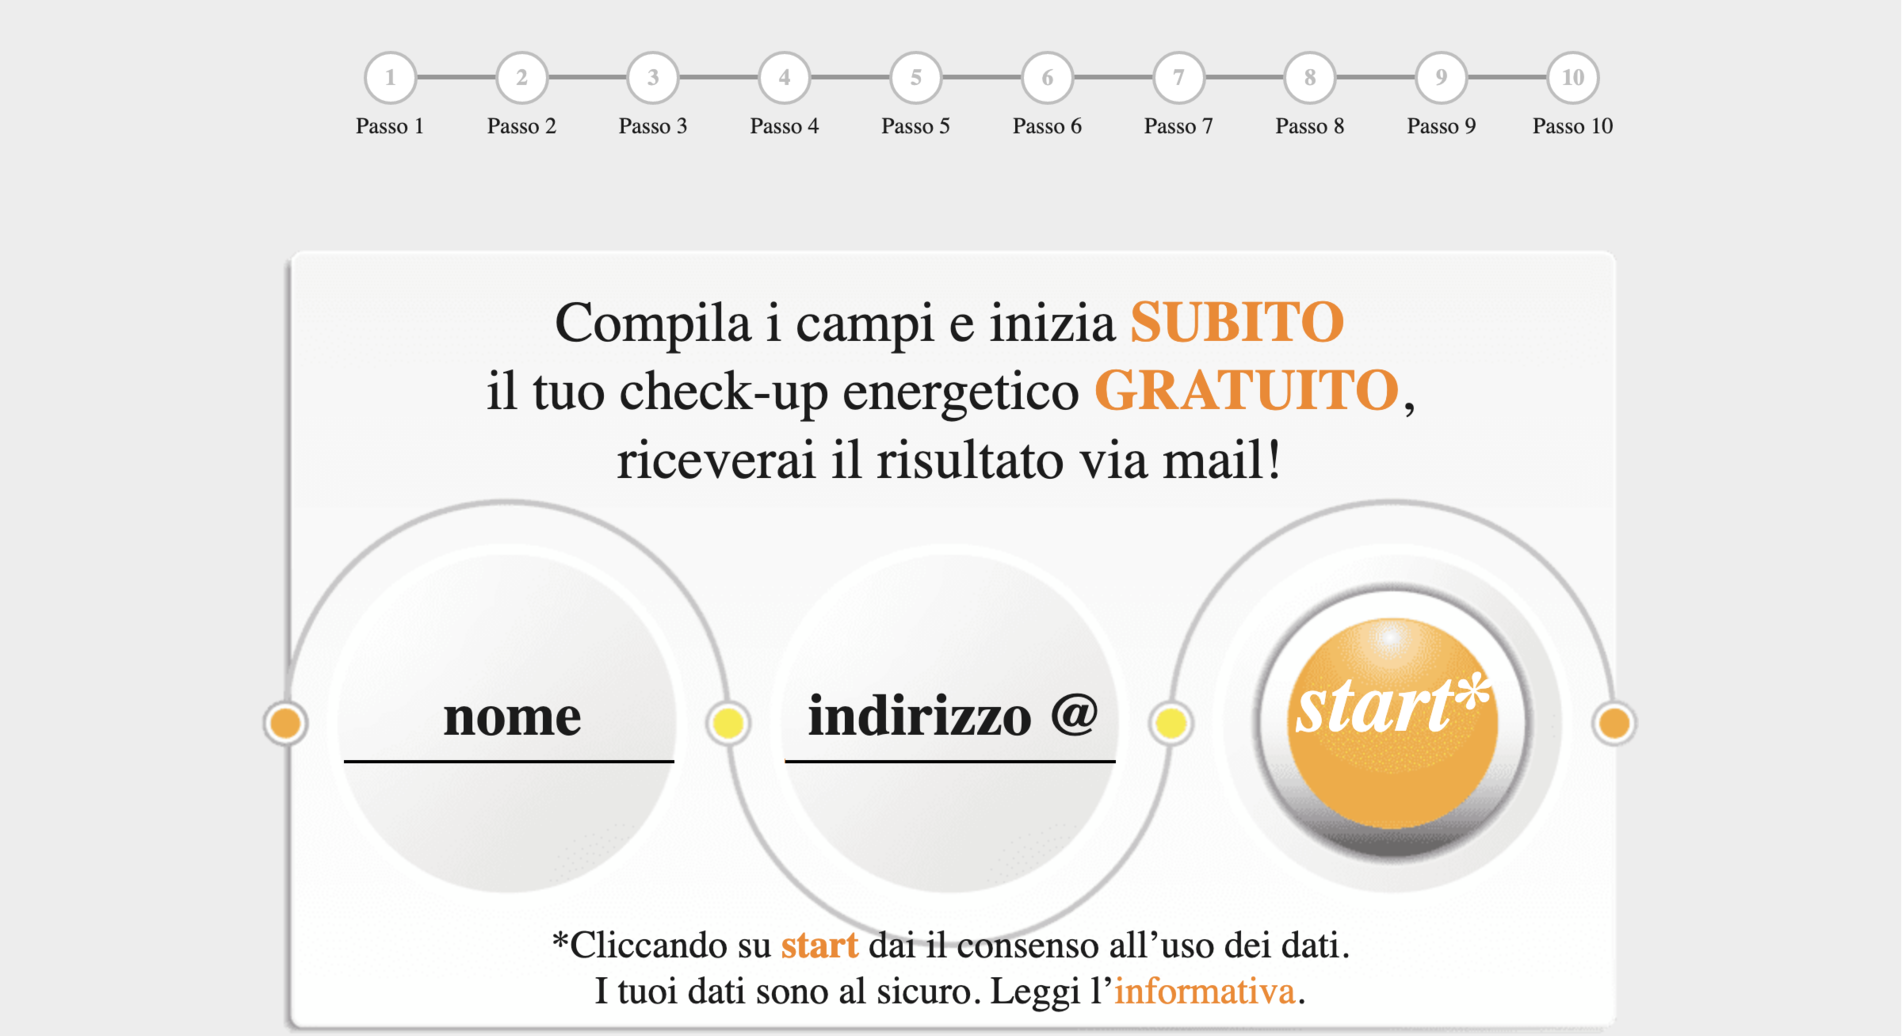
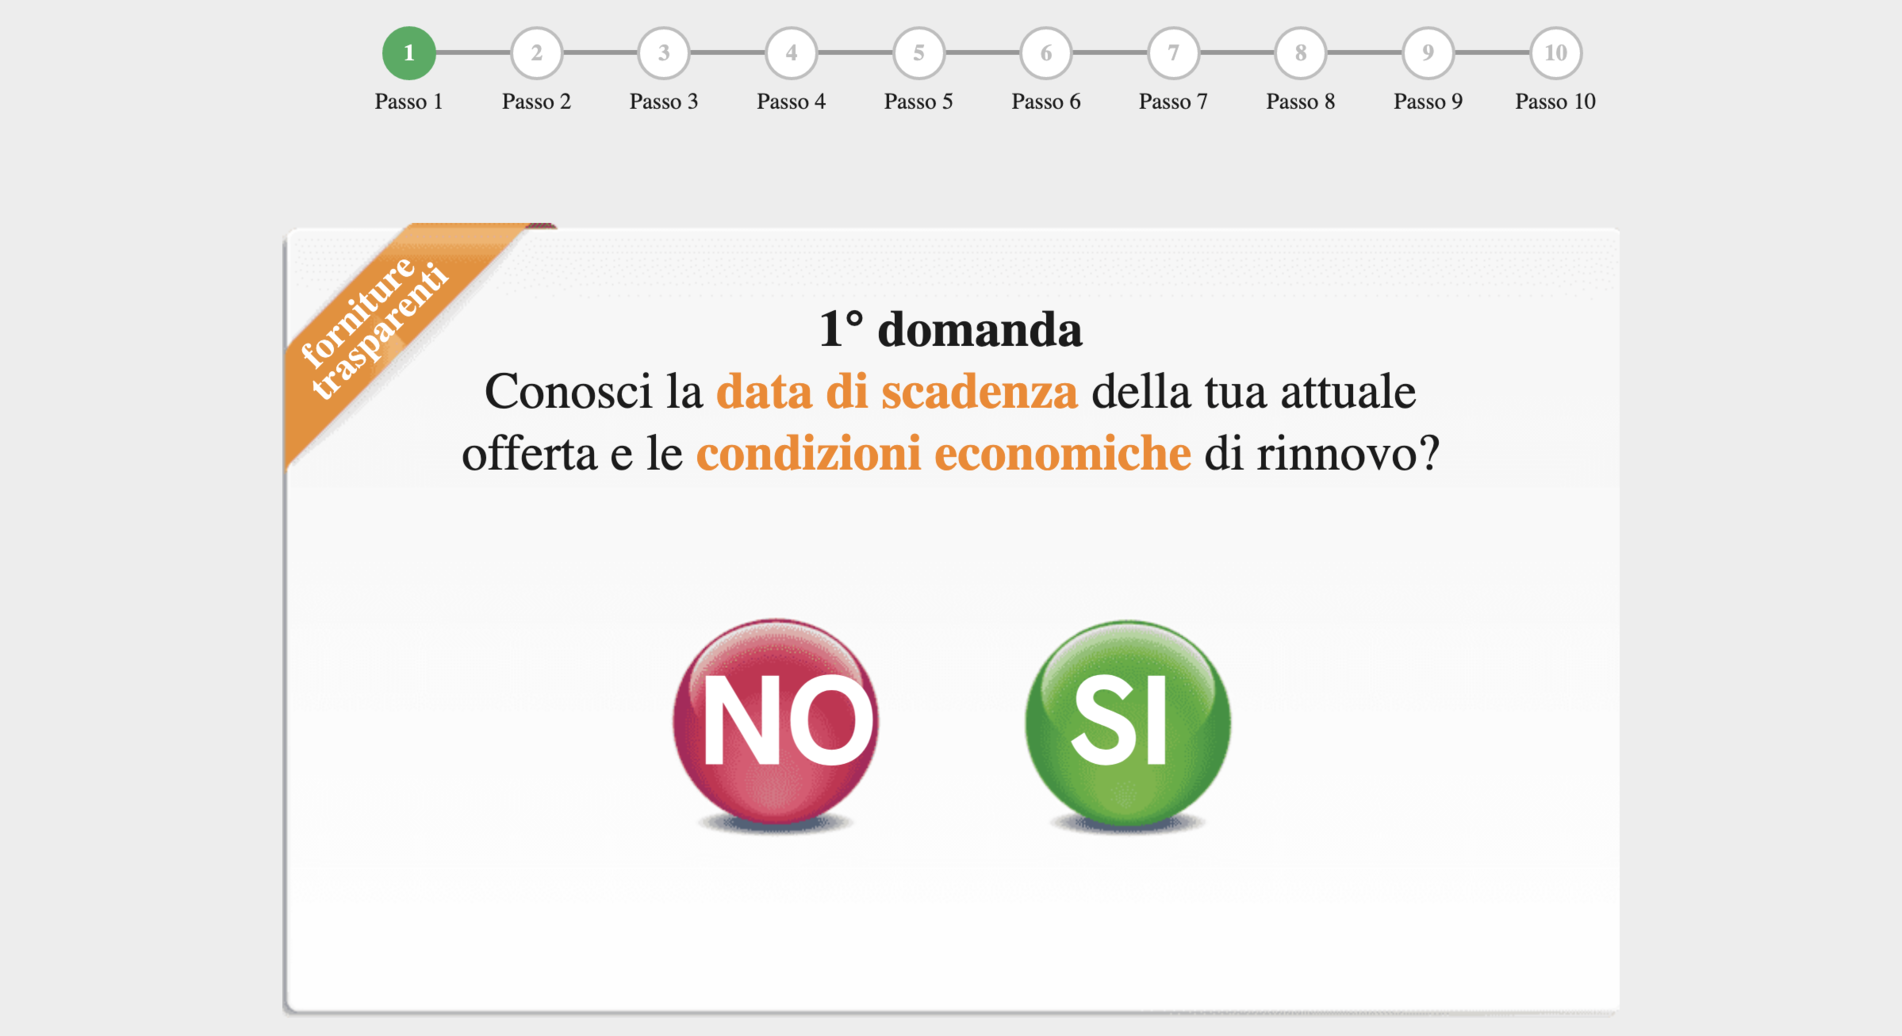
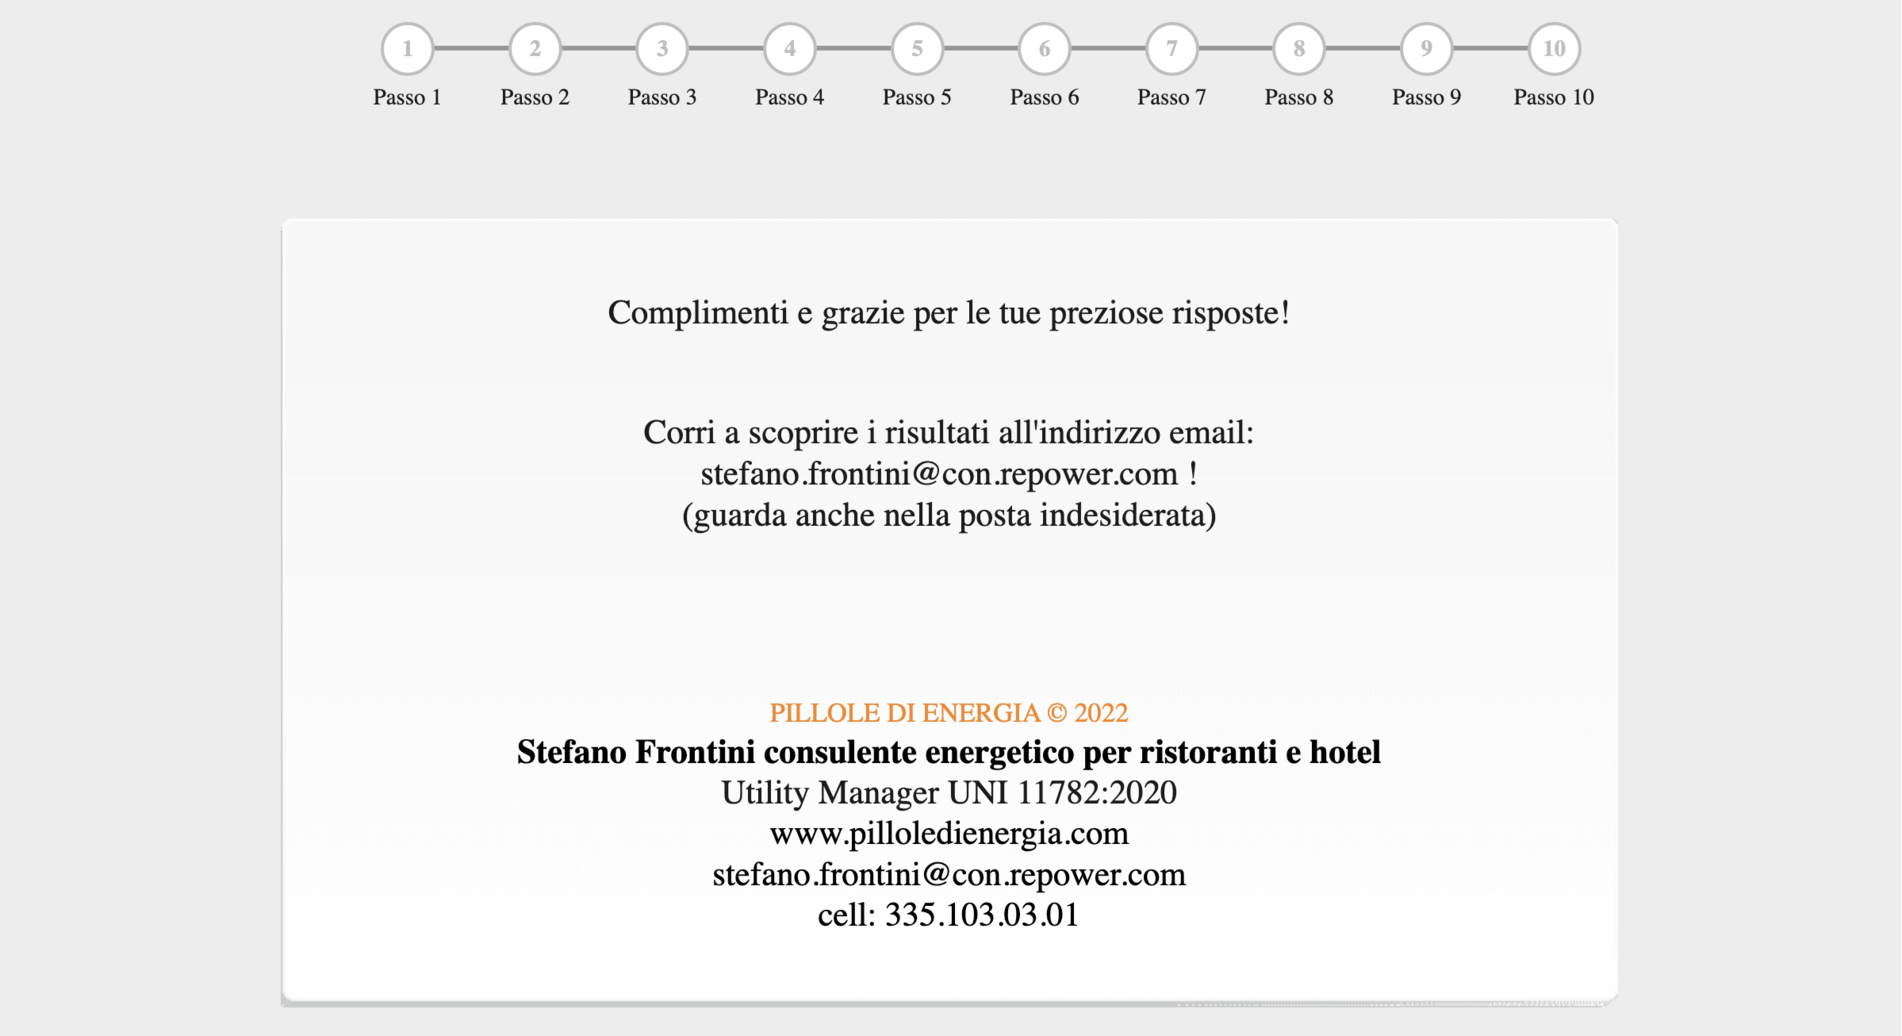
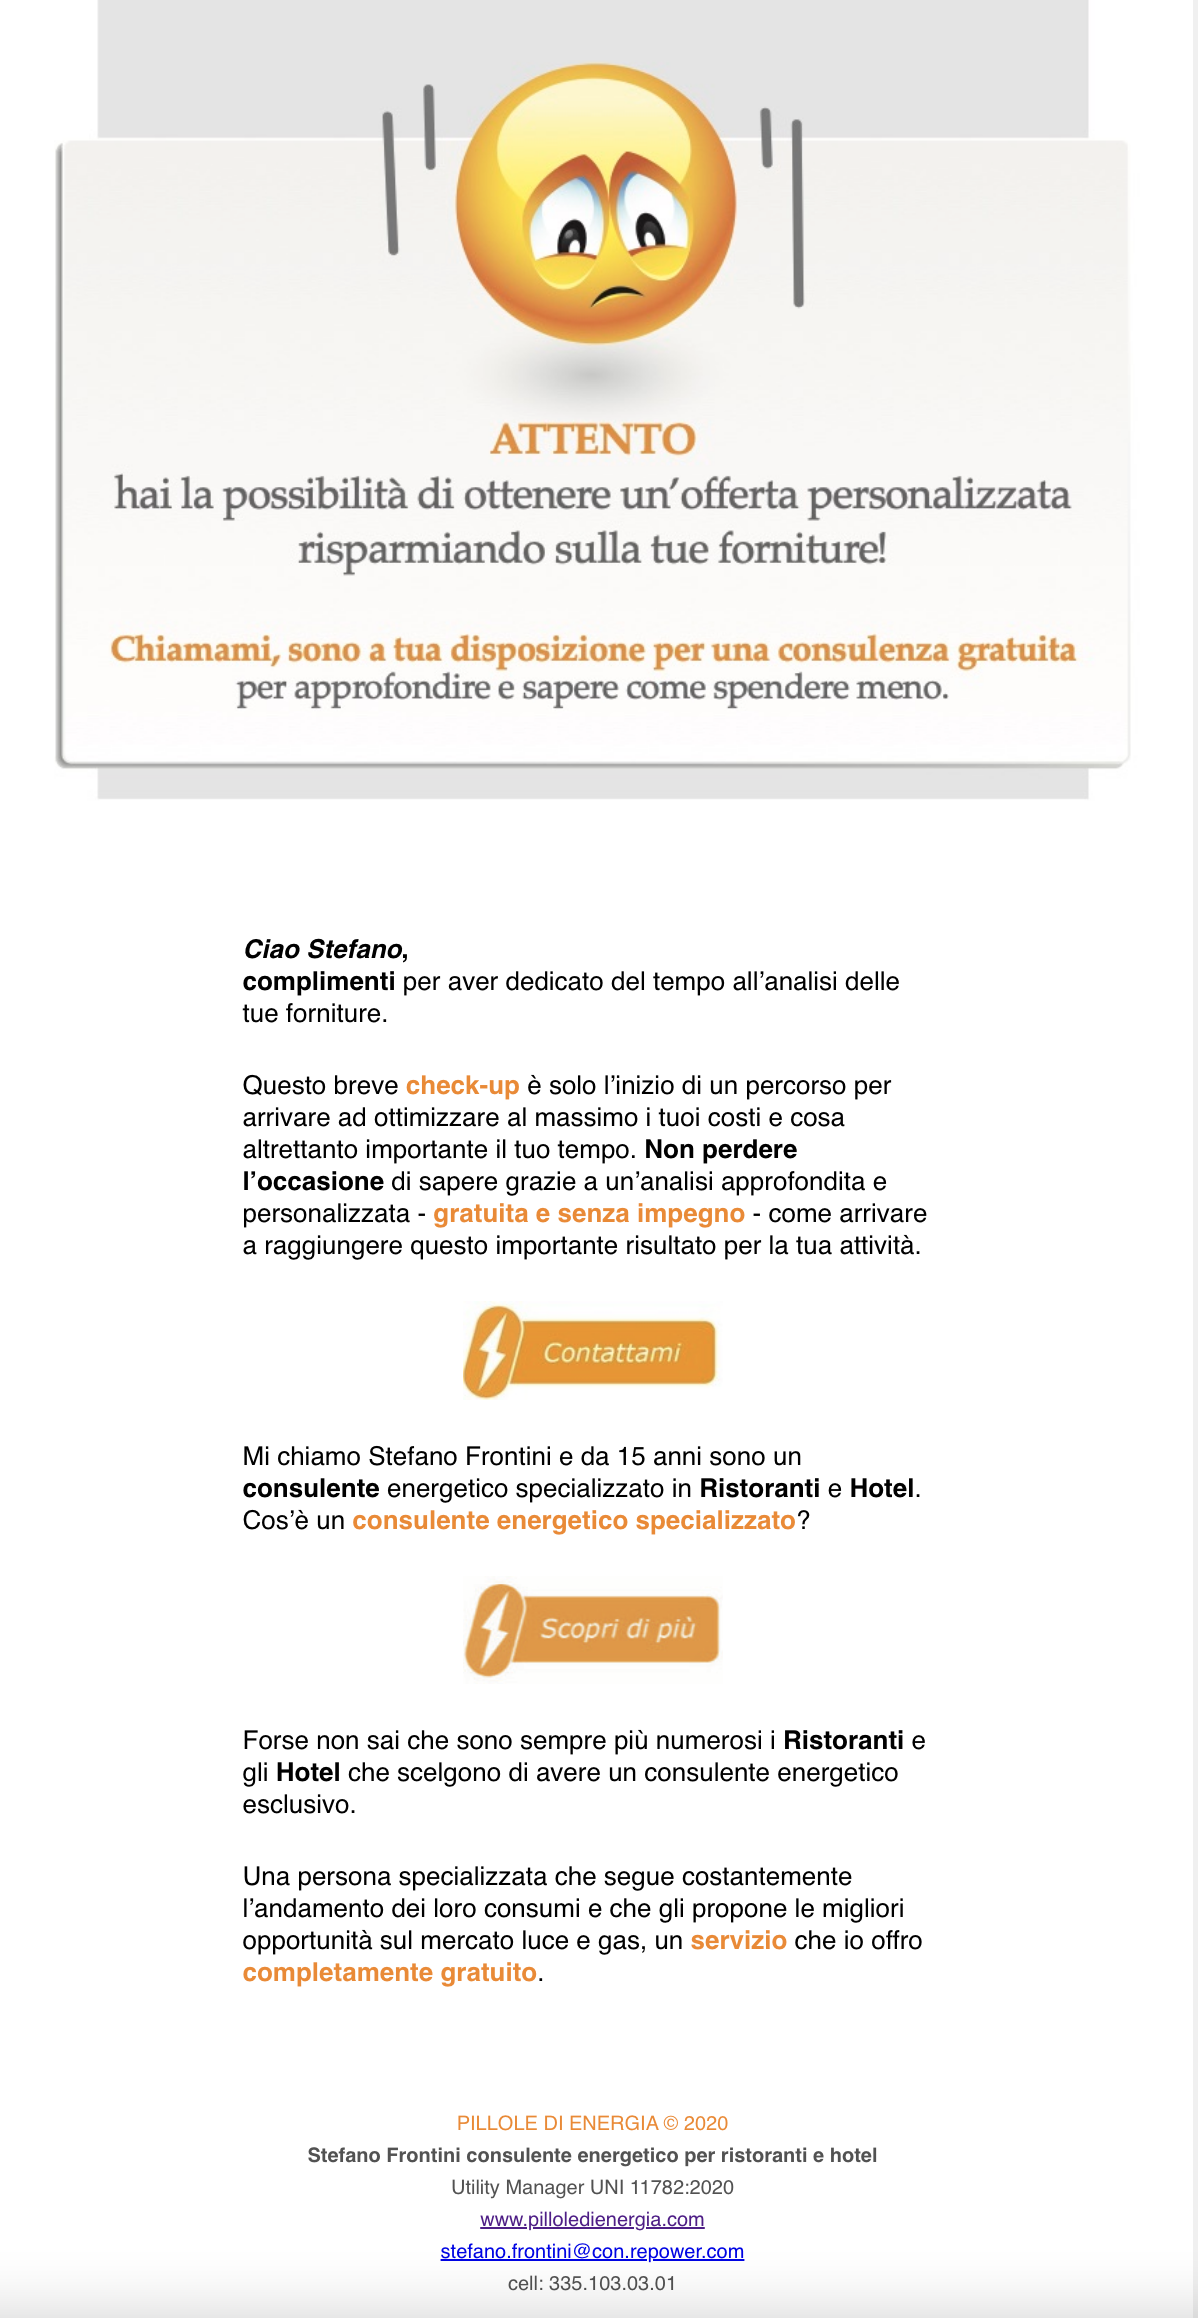
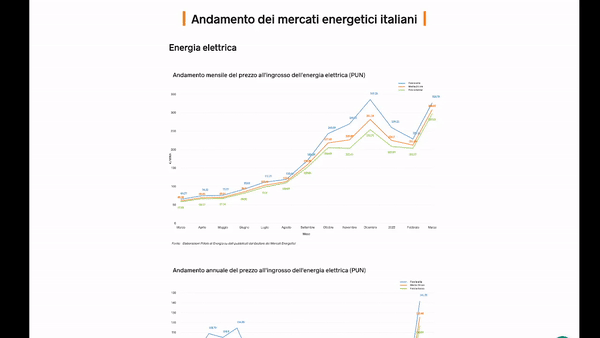
During the lockdown period in 2020 I developed pilloledienergia.com: the website for the promotion of my activity as an energy consultant. Tech stack: HTML, CSS Flexbox, SASS, Javascript, Vue, Gridsome, D3, GraphQL, Markdown, MJML email framework.

The site had to have:
- a carousel related to my latest videos on youtube
- an energy check-up functionality to capture potential leads, send a report to the user by email and save the email address to a database;
-
charts showing the trend of the energy market and electric car registrations.
-
good design.
As regards the technology I wanted to try a frontend framework like Vue.js. The problem though is that single page application are not good for SEO so I decided to go for a static site generator called Gridsome. Gridsome heavely relies on GraphQL to get data from API's. I learned GraphQL queries and decided to interact with FaunaDB using GraphQL to save email addresses.
Years ago, when I worked for Repower as an employee, I was in charge of leading a team to develop a dashboard to visualize electricity and gas consumption data. We were helped by an agency whose specific area was data visualization. This project made me fall in love with data visualization and I discovered that the technology used was D3.js. Why not take this opportunity to learn how to use D3? So I decided to use D3 for all the charts of the website. I wanted Vue to handle the DOM and use D3 only for the built-in shapes. The implementation was hard due to lack of documentation (blogs/videos) about combining Vue and D3.
I decided also to deploy the site to Netlify and use Serverless functions to intereact with FaunaDB. Serverless functions were really nice to use! It's like having a server but without the complications of running one!
One big problem was to format nicely the email sent to users after having completed the energy check-up. I discovered that formatting an email with html is very difficult! So I decided to go for an email framework called MJML.
For the design of the homepage and the energy check-up I decided to hire an Art Director. I loved working with her!
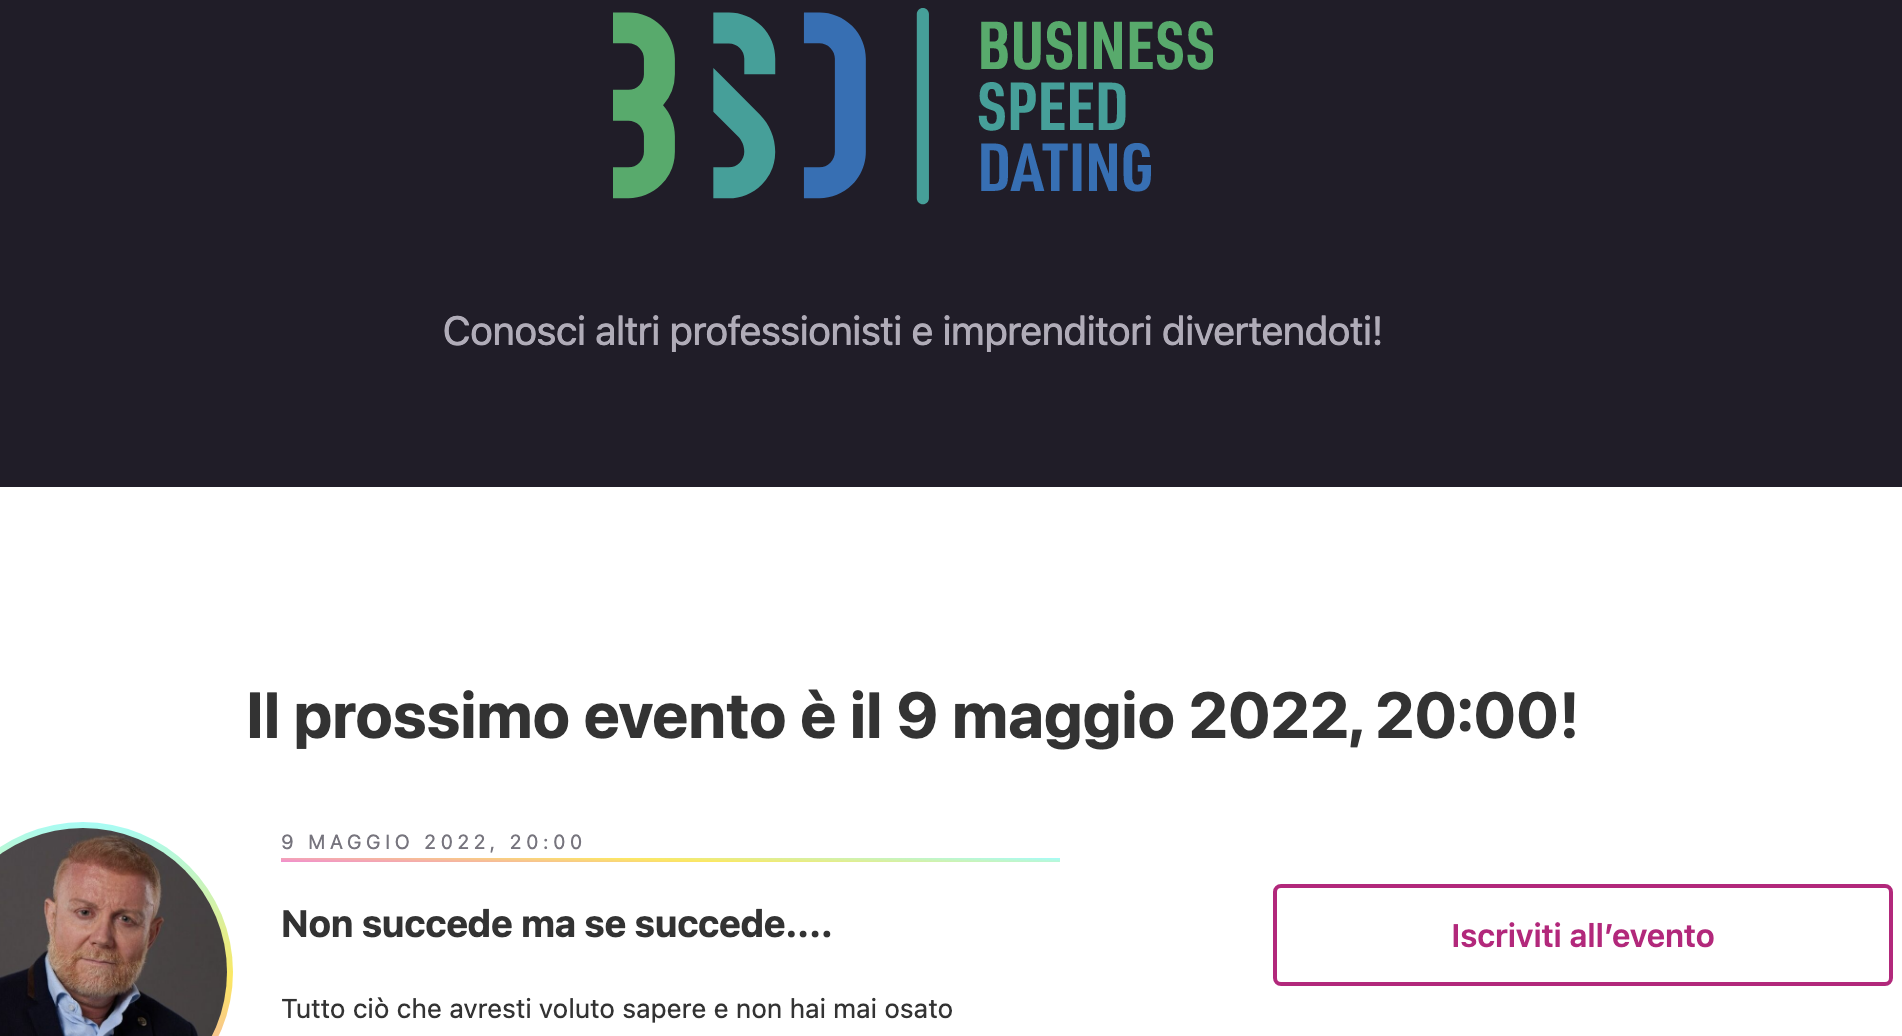
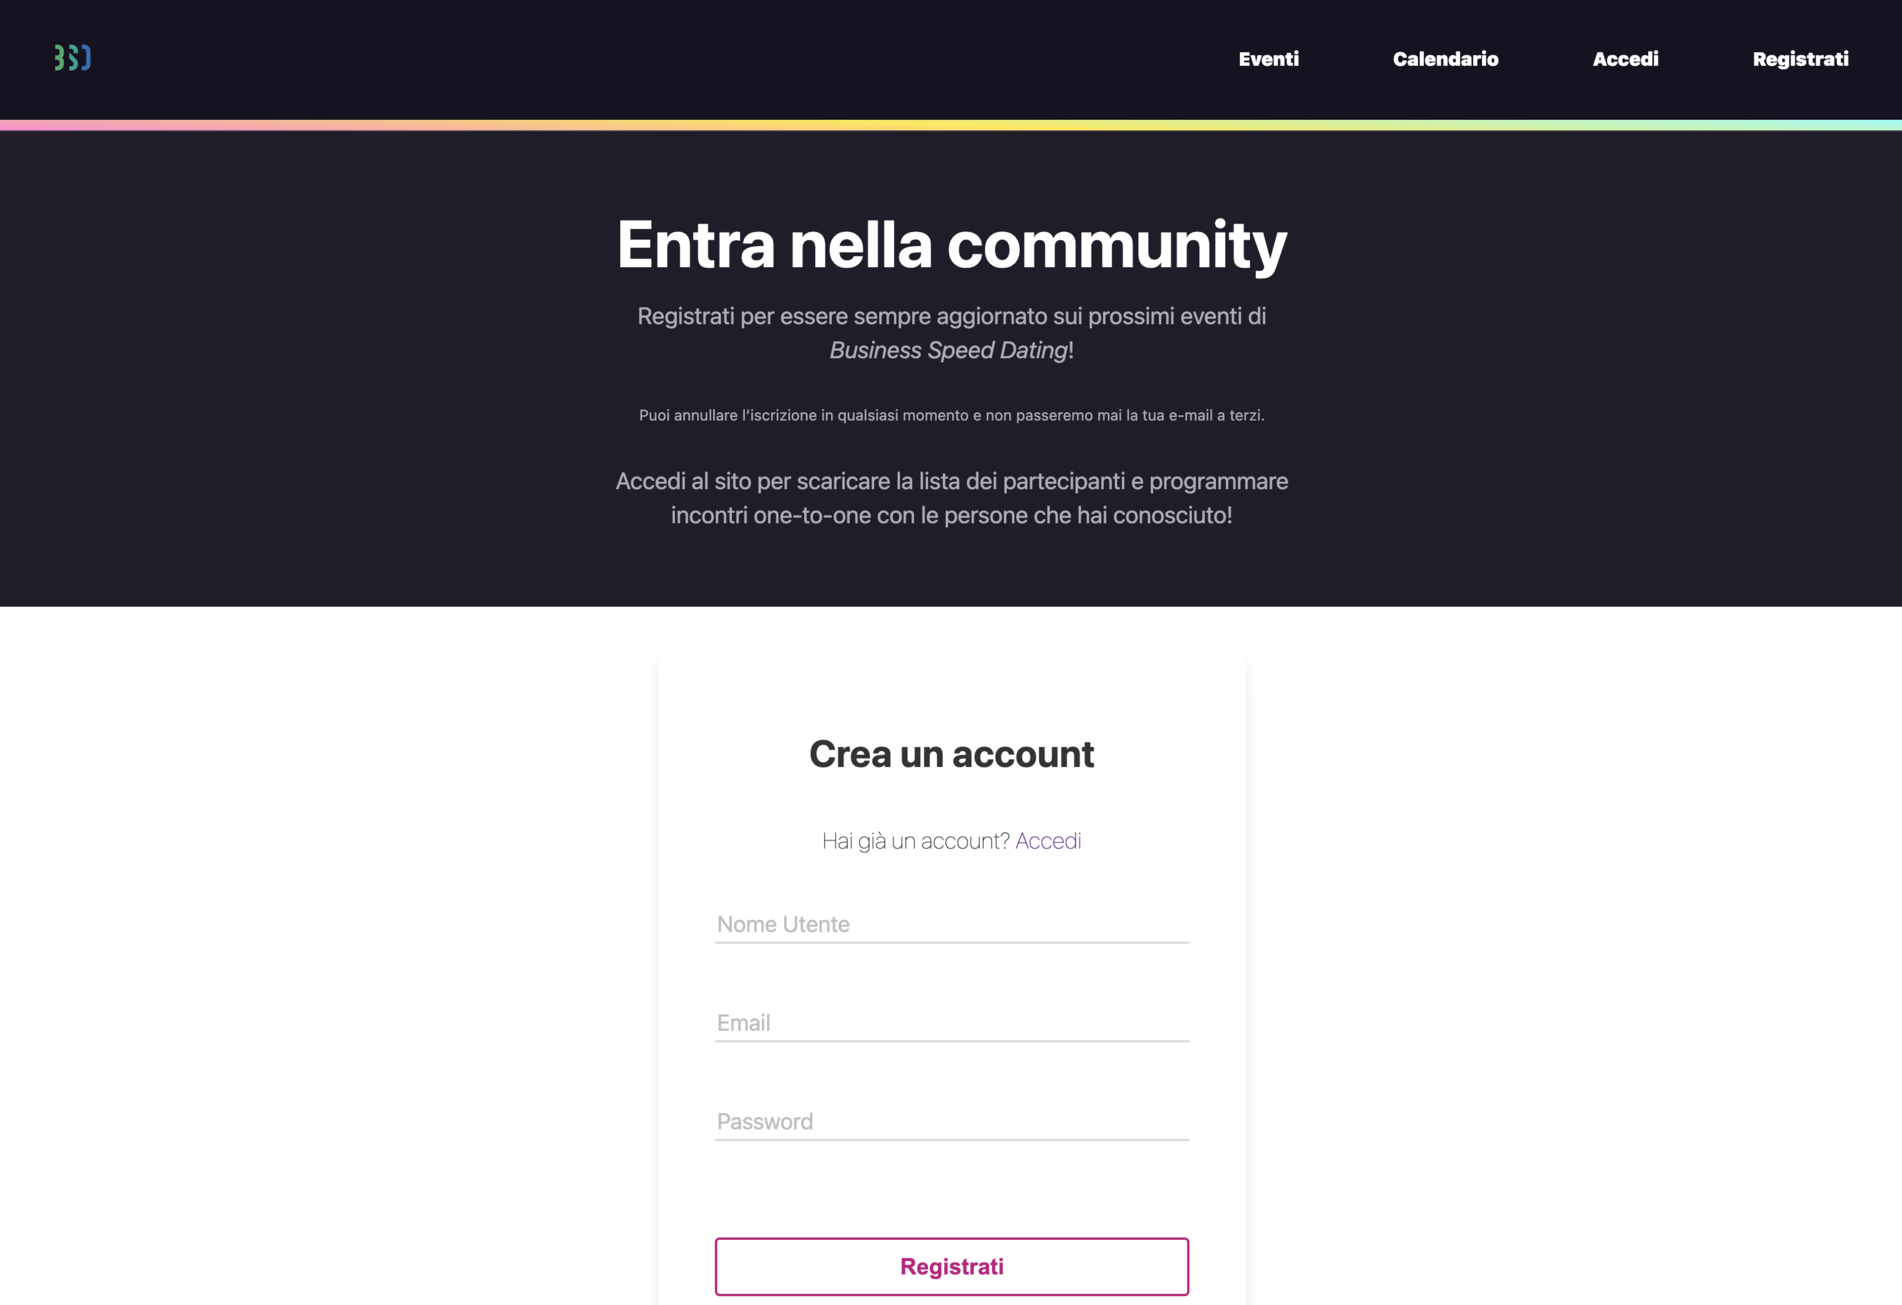
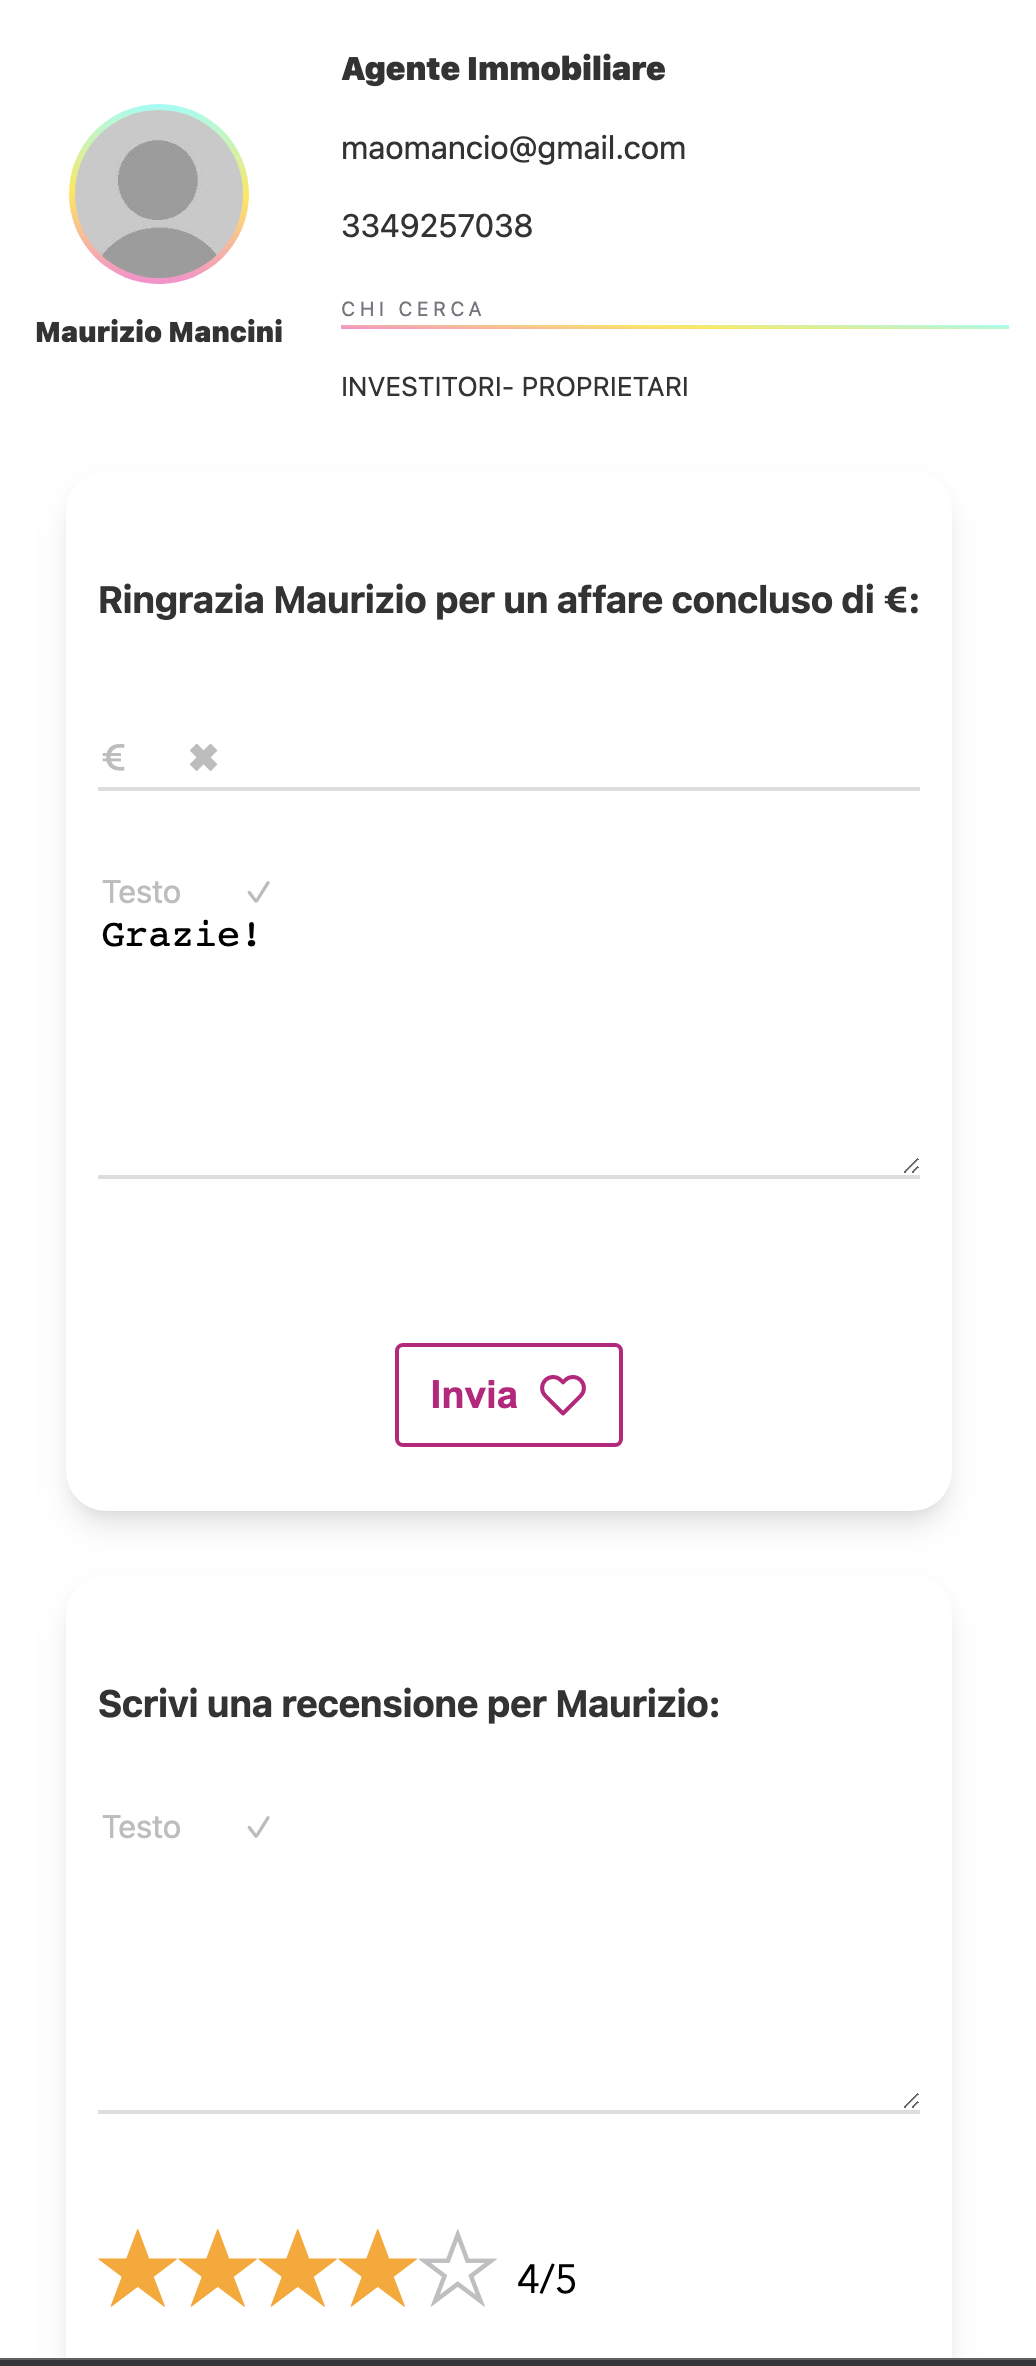
In 2021 a business partner and I created a community to connect professionals and entrepreneus.
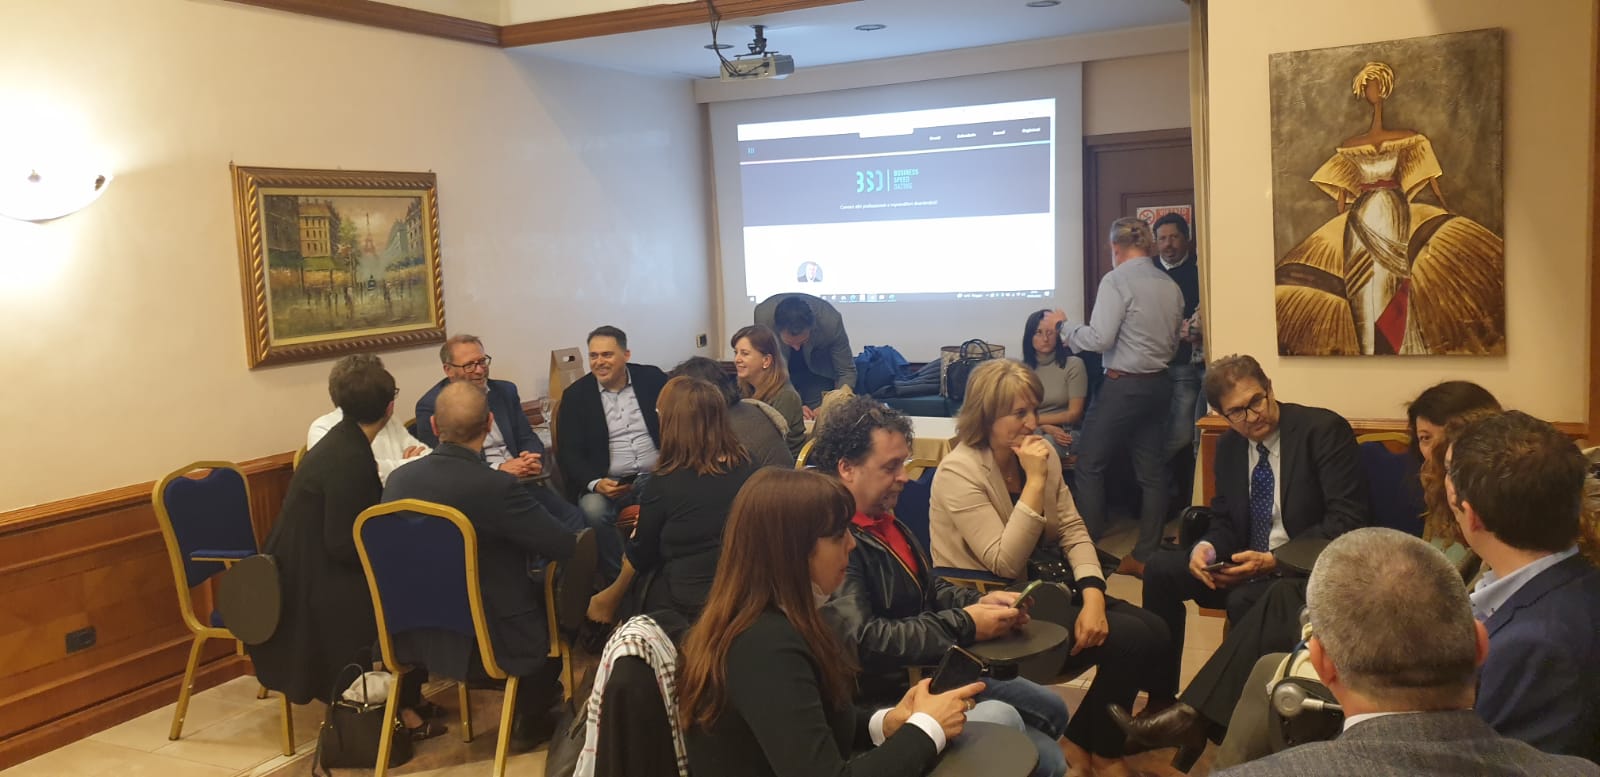
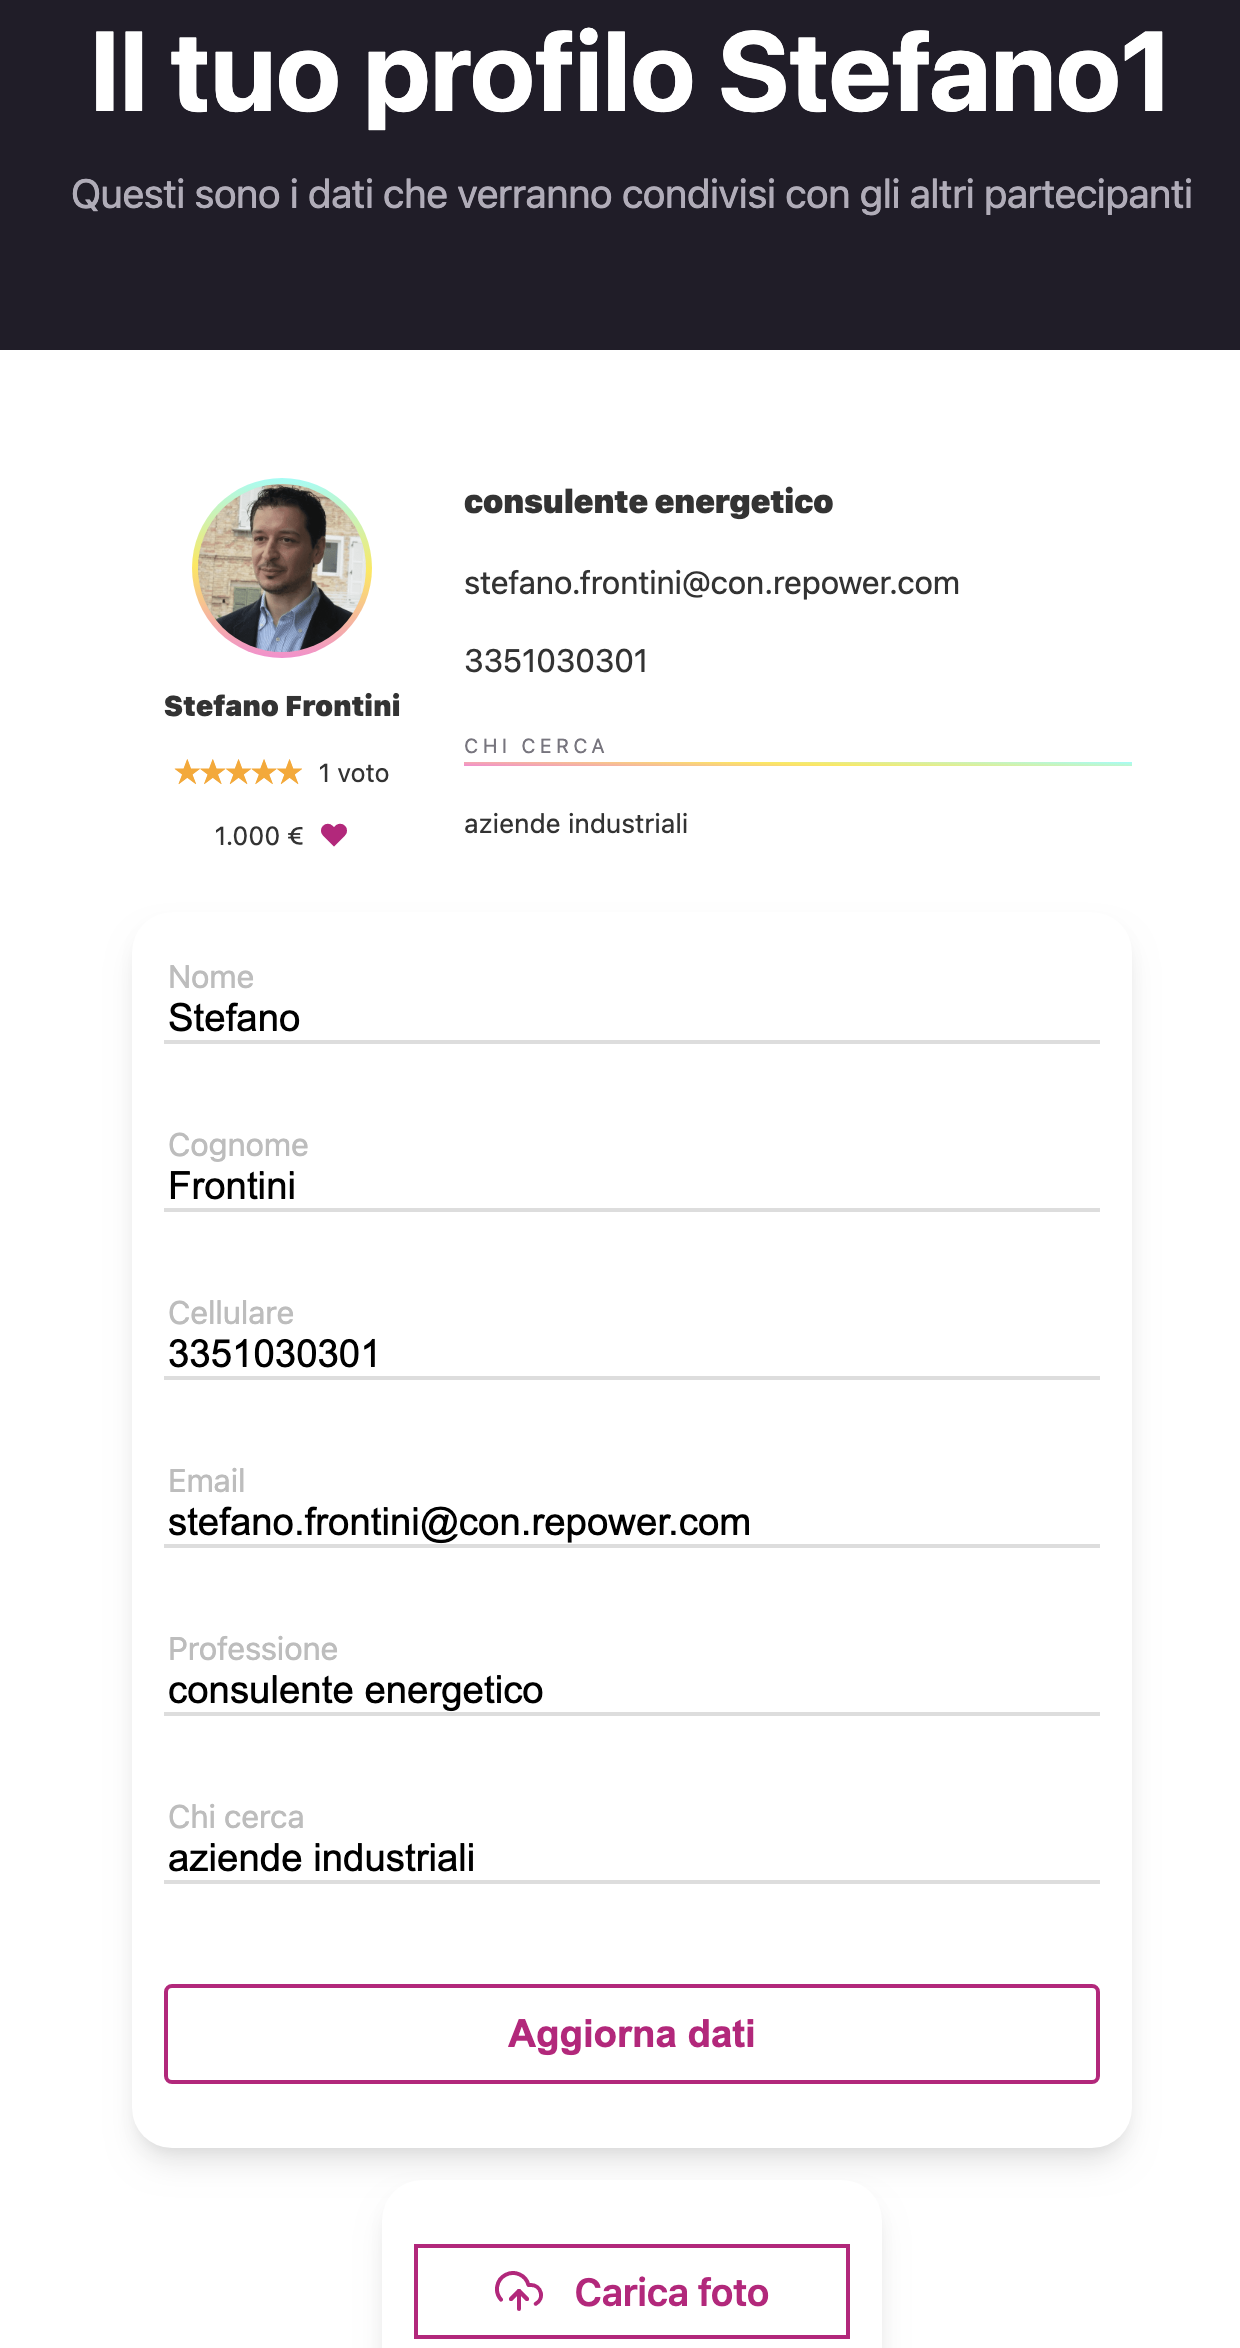
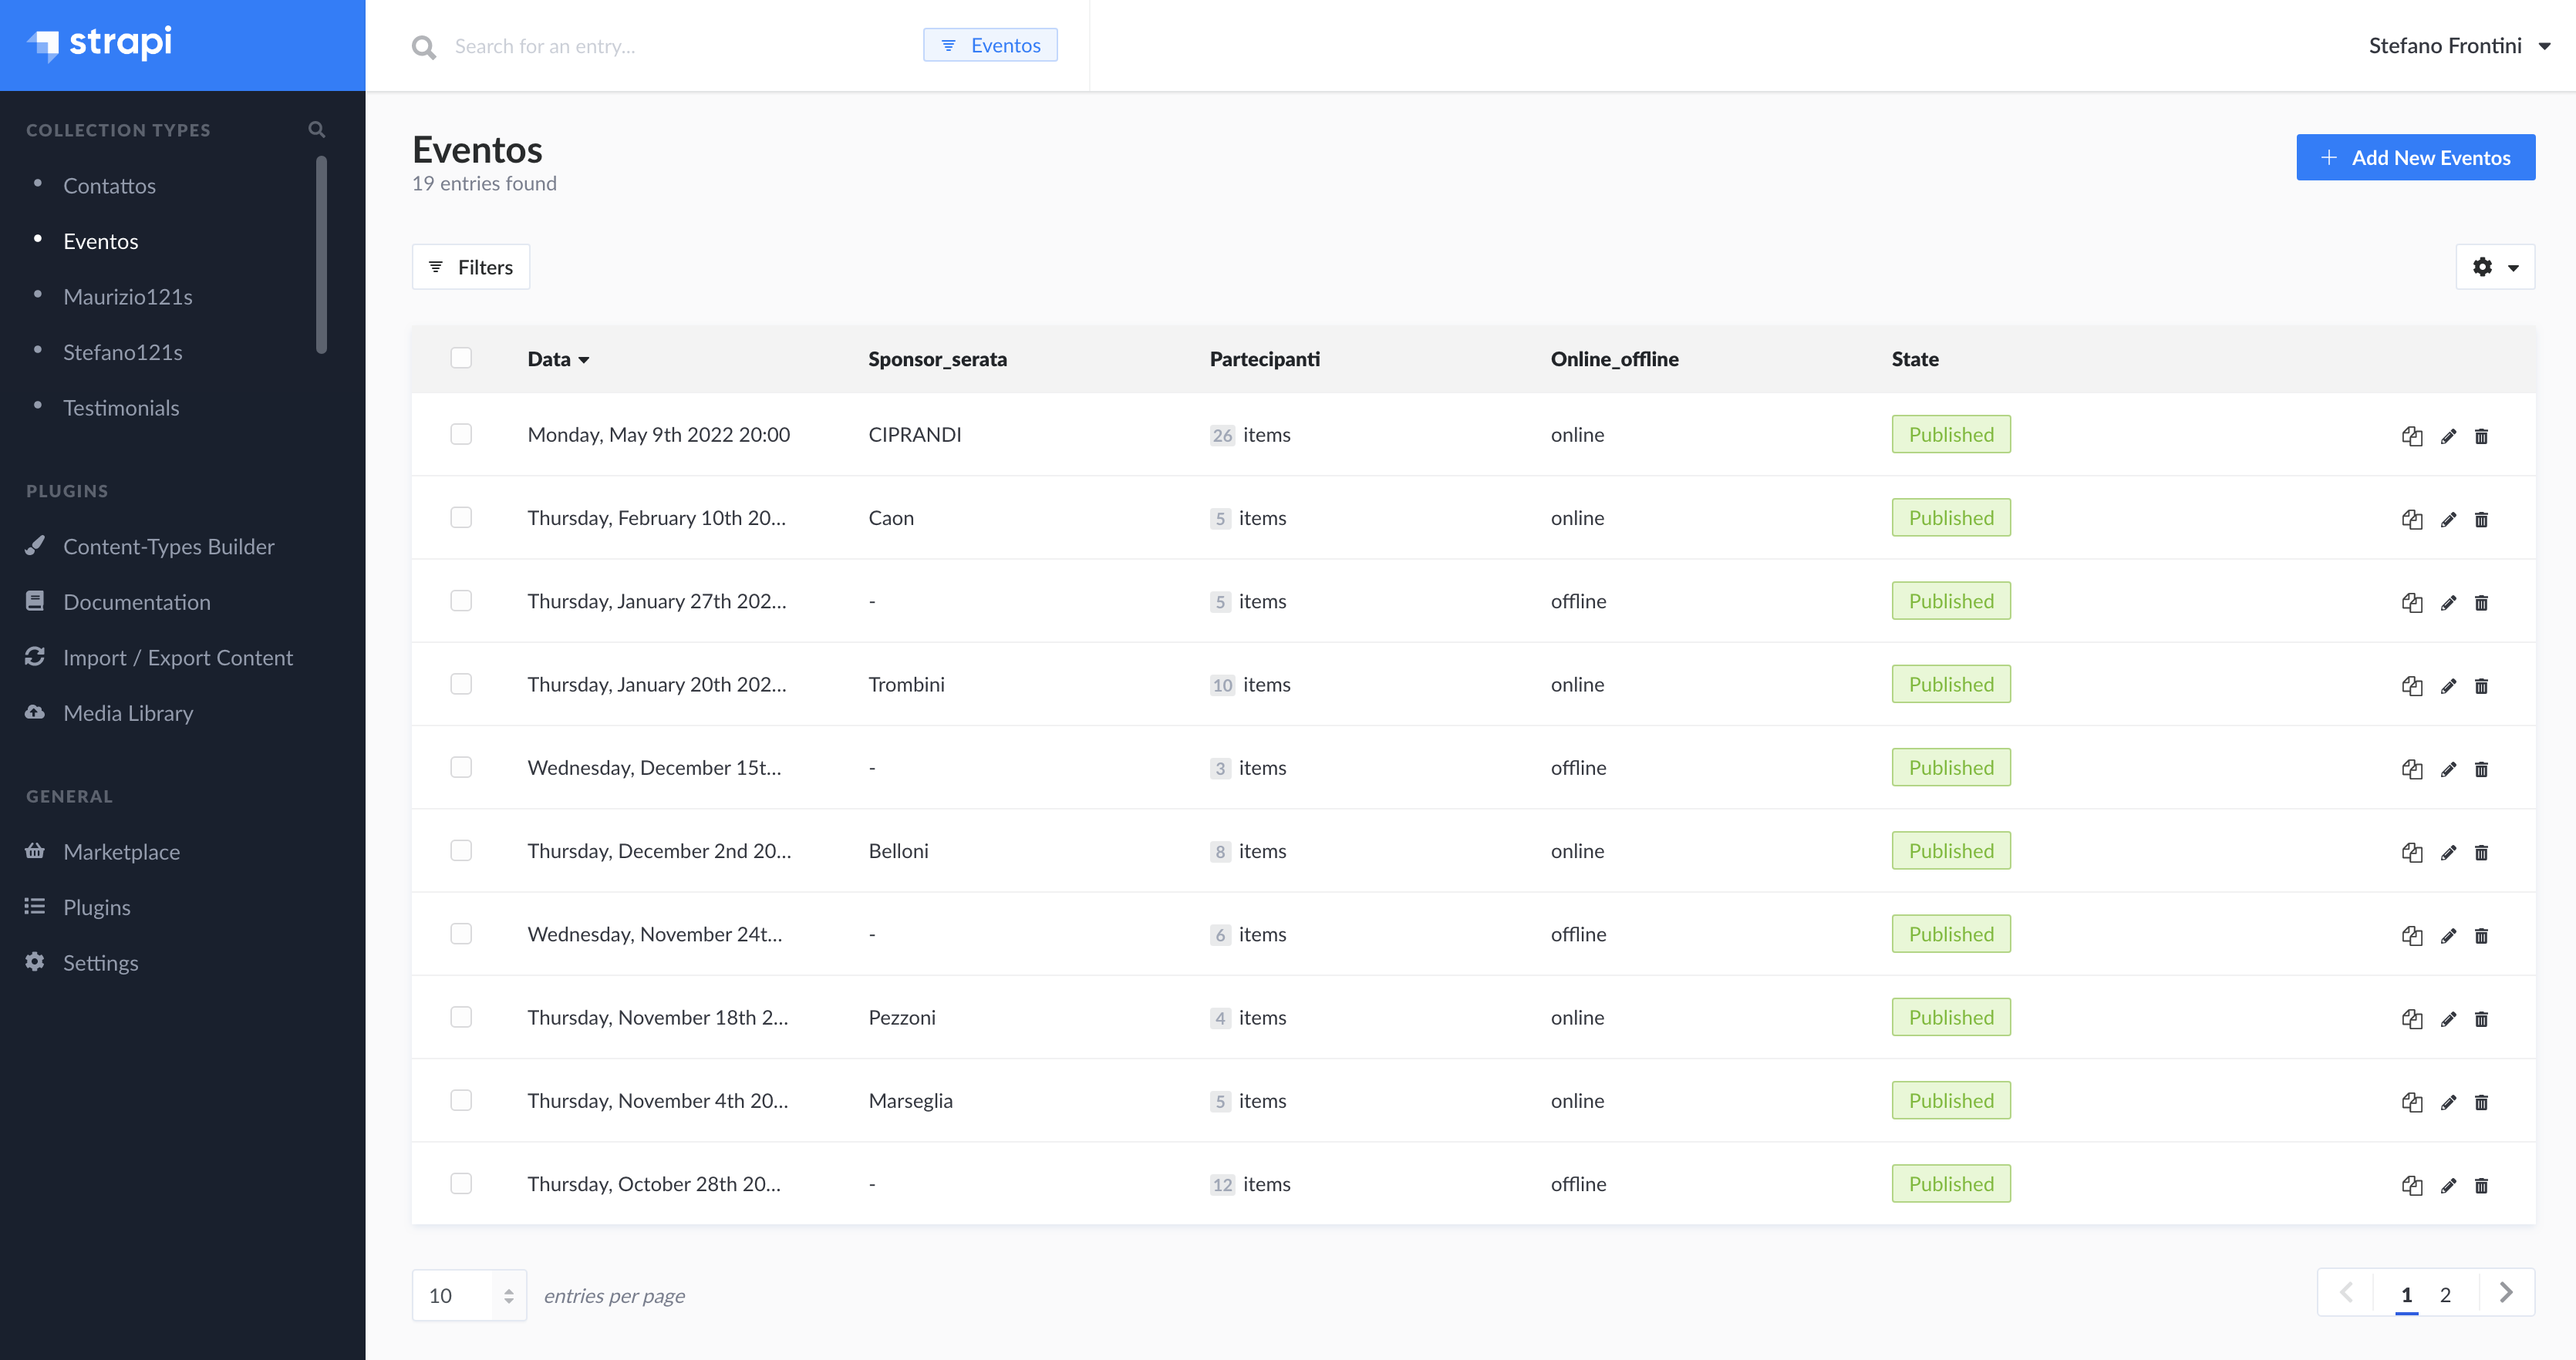
The community was growing steadily and to minimize the workflow I needed an app that would allow me to manage the networking events and keep track of the contacts I developed. So I built bsdating.com. Tech stack: HTML, CSS Flexbox and Grid, Vue, Gridsome, GraphQL, Algolia, Nodemailer, Strapi (headless CMS), Netlify. The challenge was quite big because:
- Participants should be able to register for the event and automatically be invited to subscribe to the MailChimp newsletter.
- Participants should be able to receive a confirmation email.
- Organizers should be able to receive an email notification when someone signs up for an event.
- The site should show the record of past events and the calendar of upcoming events
- Participants should be able to register and become members.
-
Community members should be able to login.
-
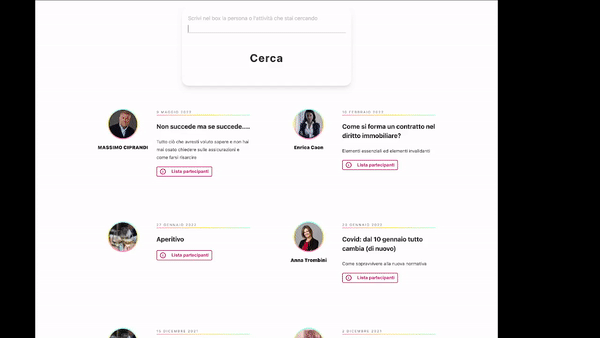
Community members should be able to see all the events they have attended
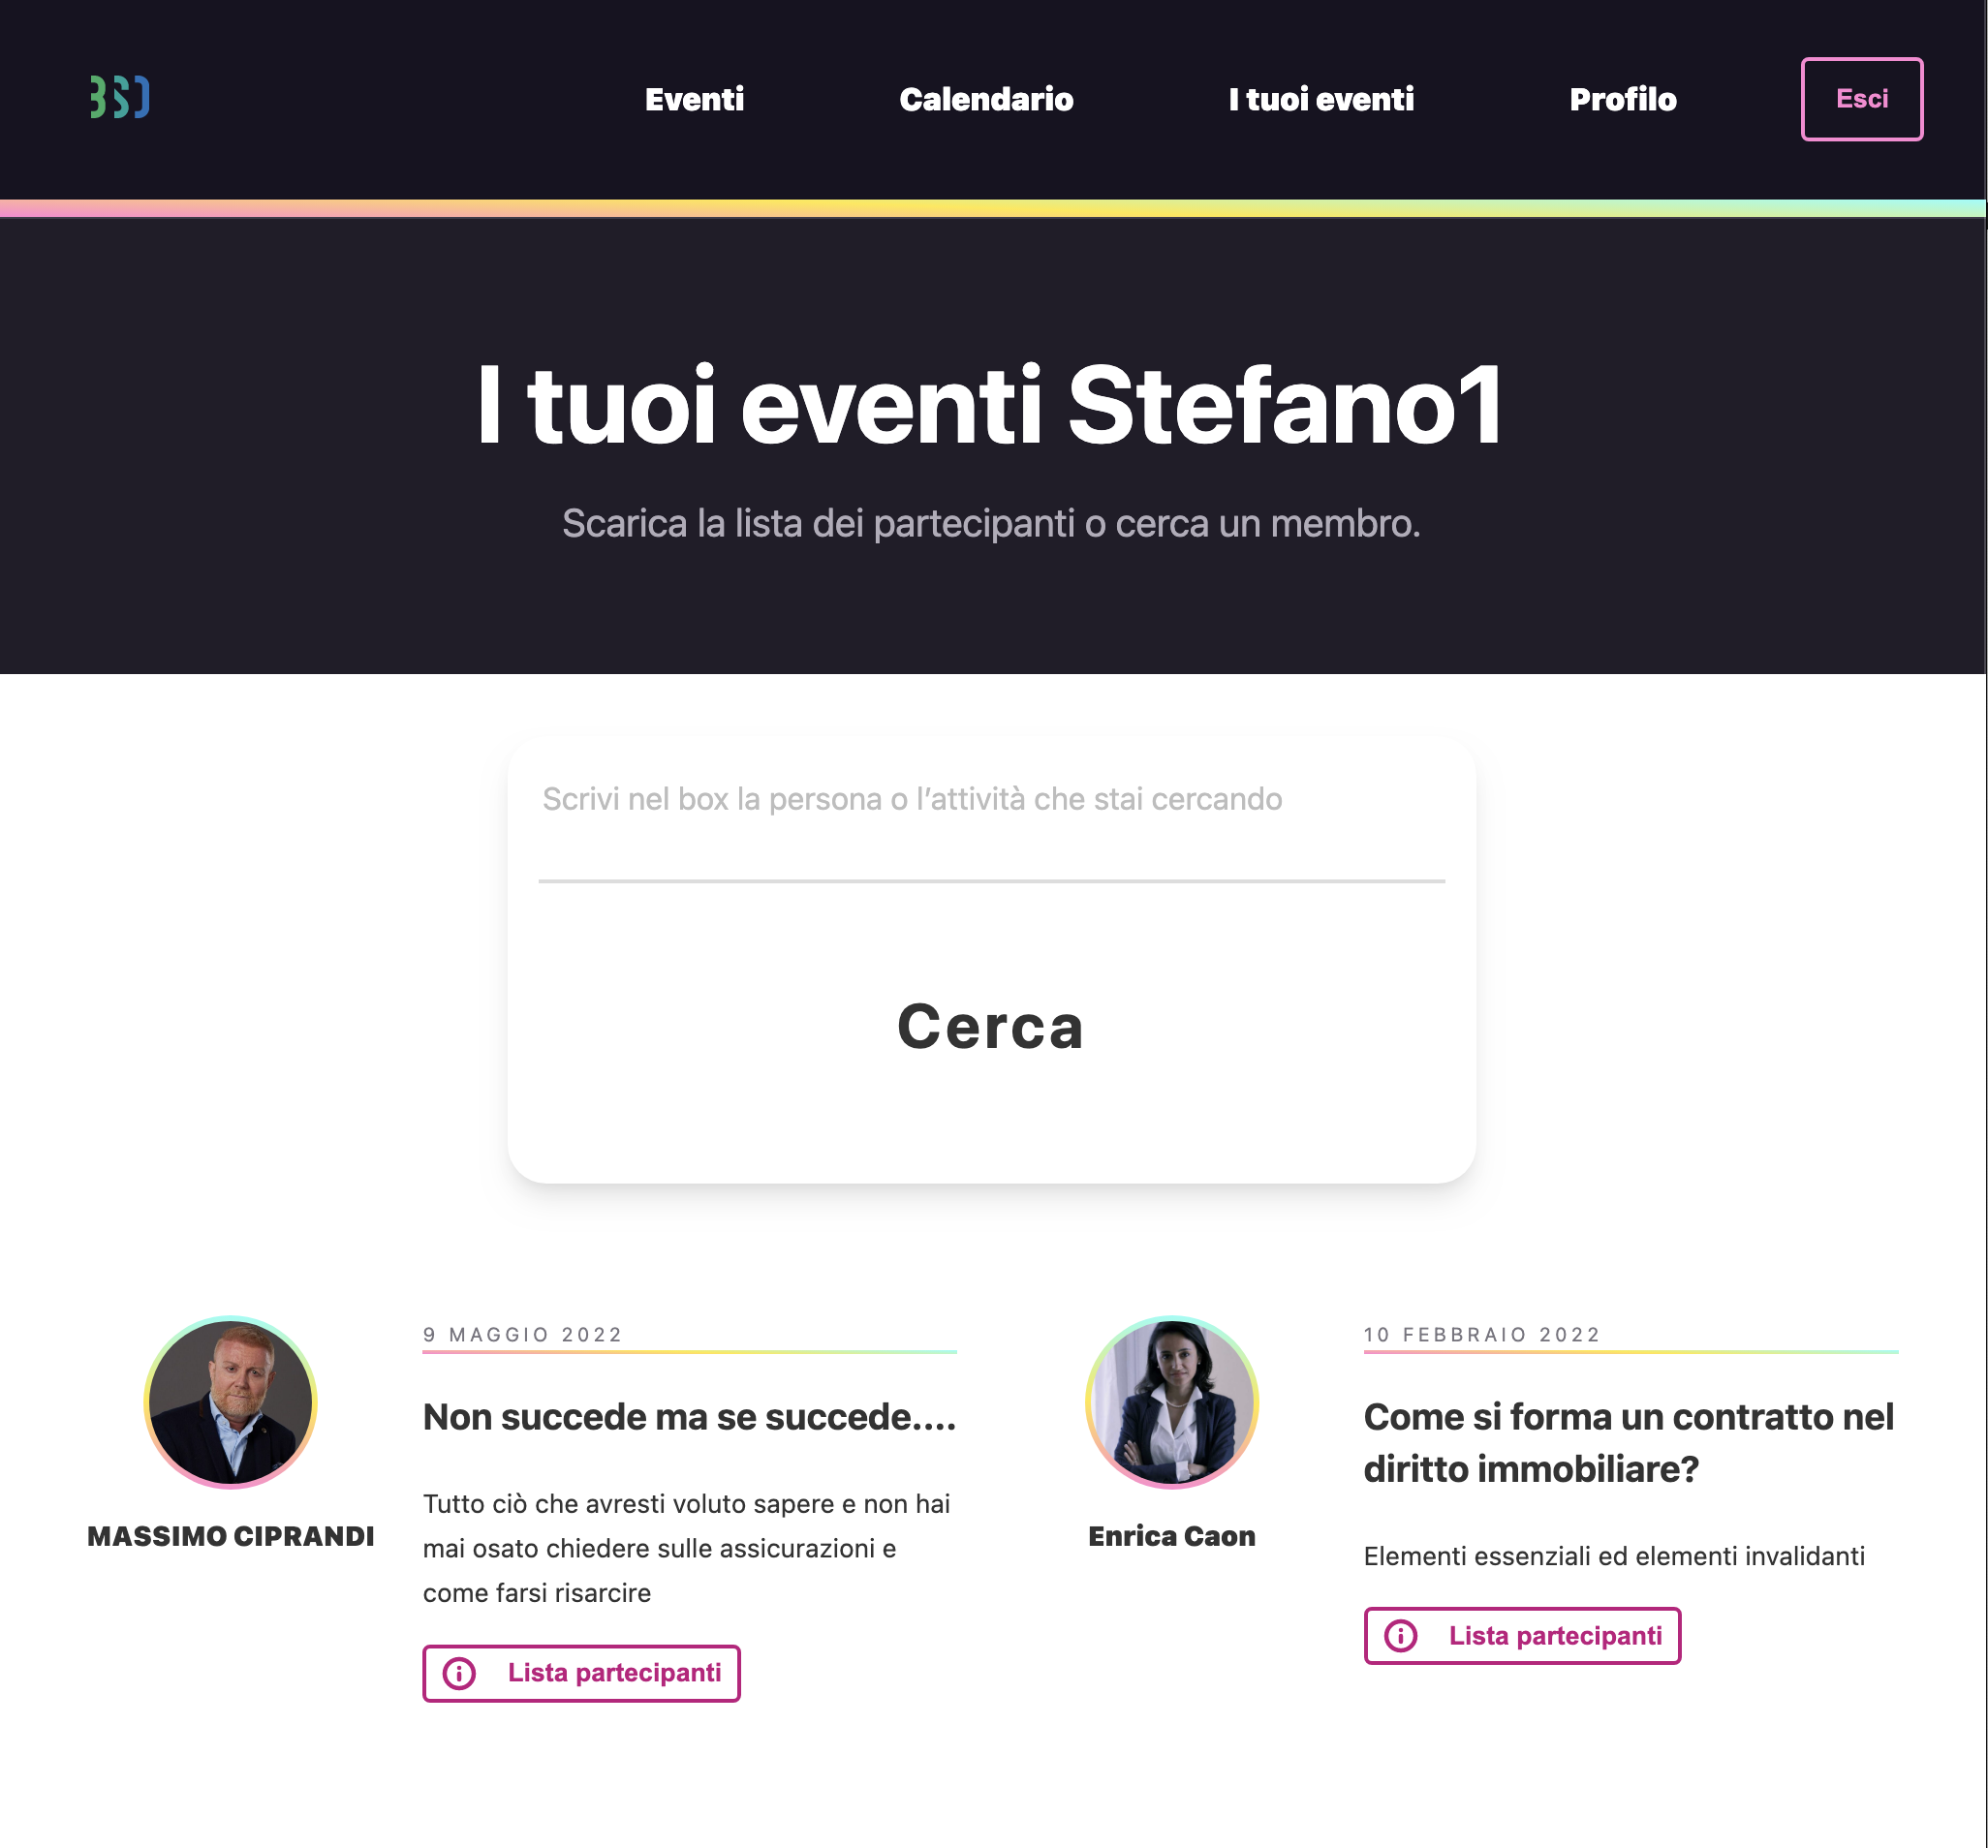
- Community members should be able to download the list of participants;
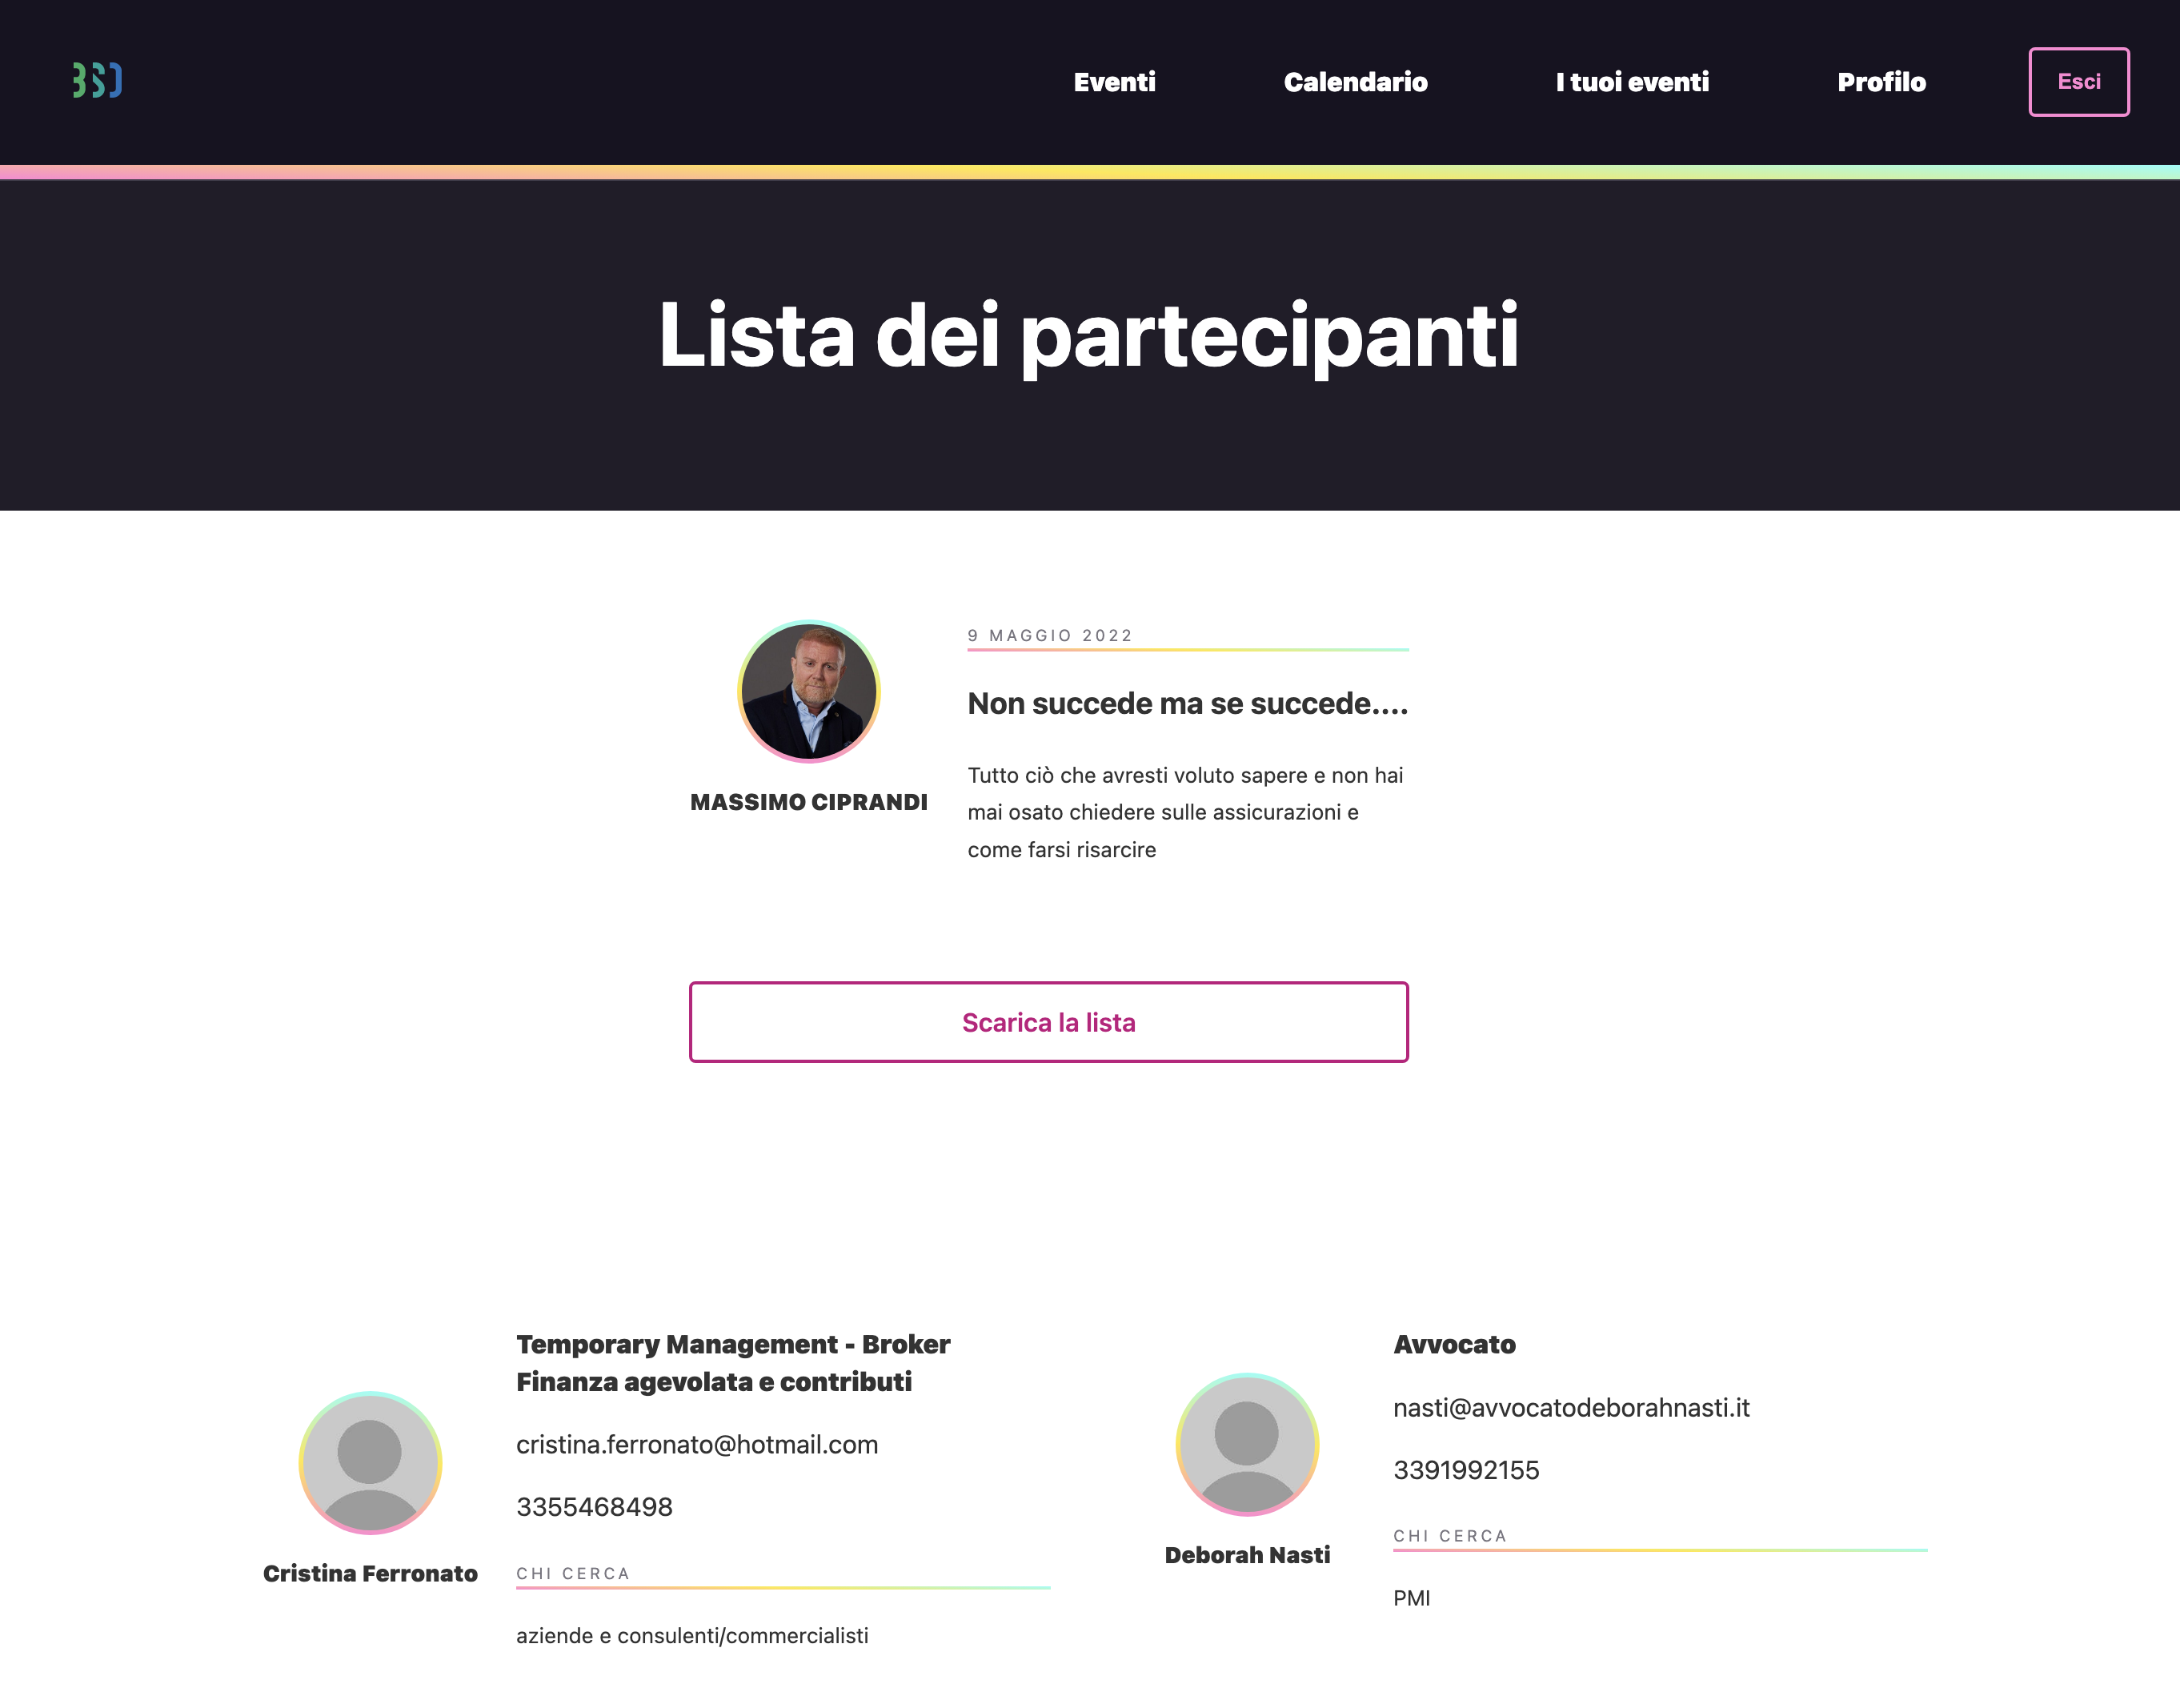
- Community members should be able to search other participants by name and / or profession;
- Community members should be able to give reviews to other members;
- Community members should be able to update their profile data.
- When someone gives a review to another member an automatic notification should be sent to the Telegram channel.
- All participant and event data should be stored in a database.
- Organizers should be able to access the database via a graphical interface.
- Organizers should be autonomous in uploading a new event on the site.
By building this app I learned GraphQL and how to interact with Strapi to manage the database (CRUD operations and user authentication).
I learned a lot about the search and autocomplete functionality provided by Algolia. Really amazing what you can do!
I learned also how to interact with the MailChimp and Telegram API.
Implementing members reviews required also a lot of effort. It's like building a social app!
When someone signs up for an event, the app updates the db and generates a unique member profile page with this slug: bsdating.com/firstName-lastName. What happens if two people with same name sign up? I had a hard time figuring it out how to solve this problem!
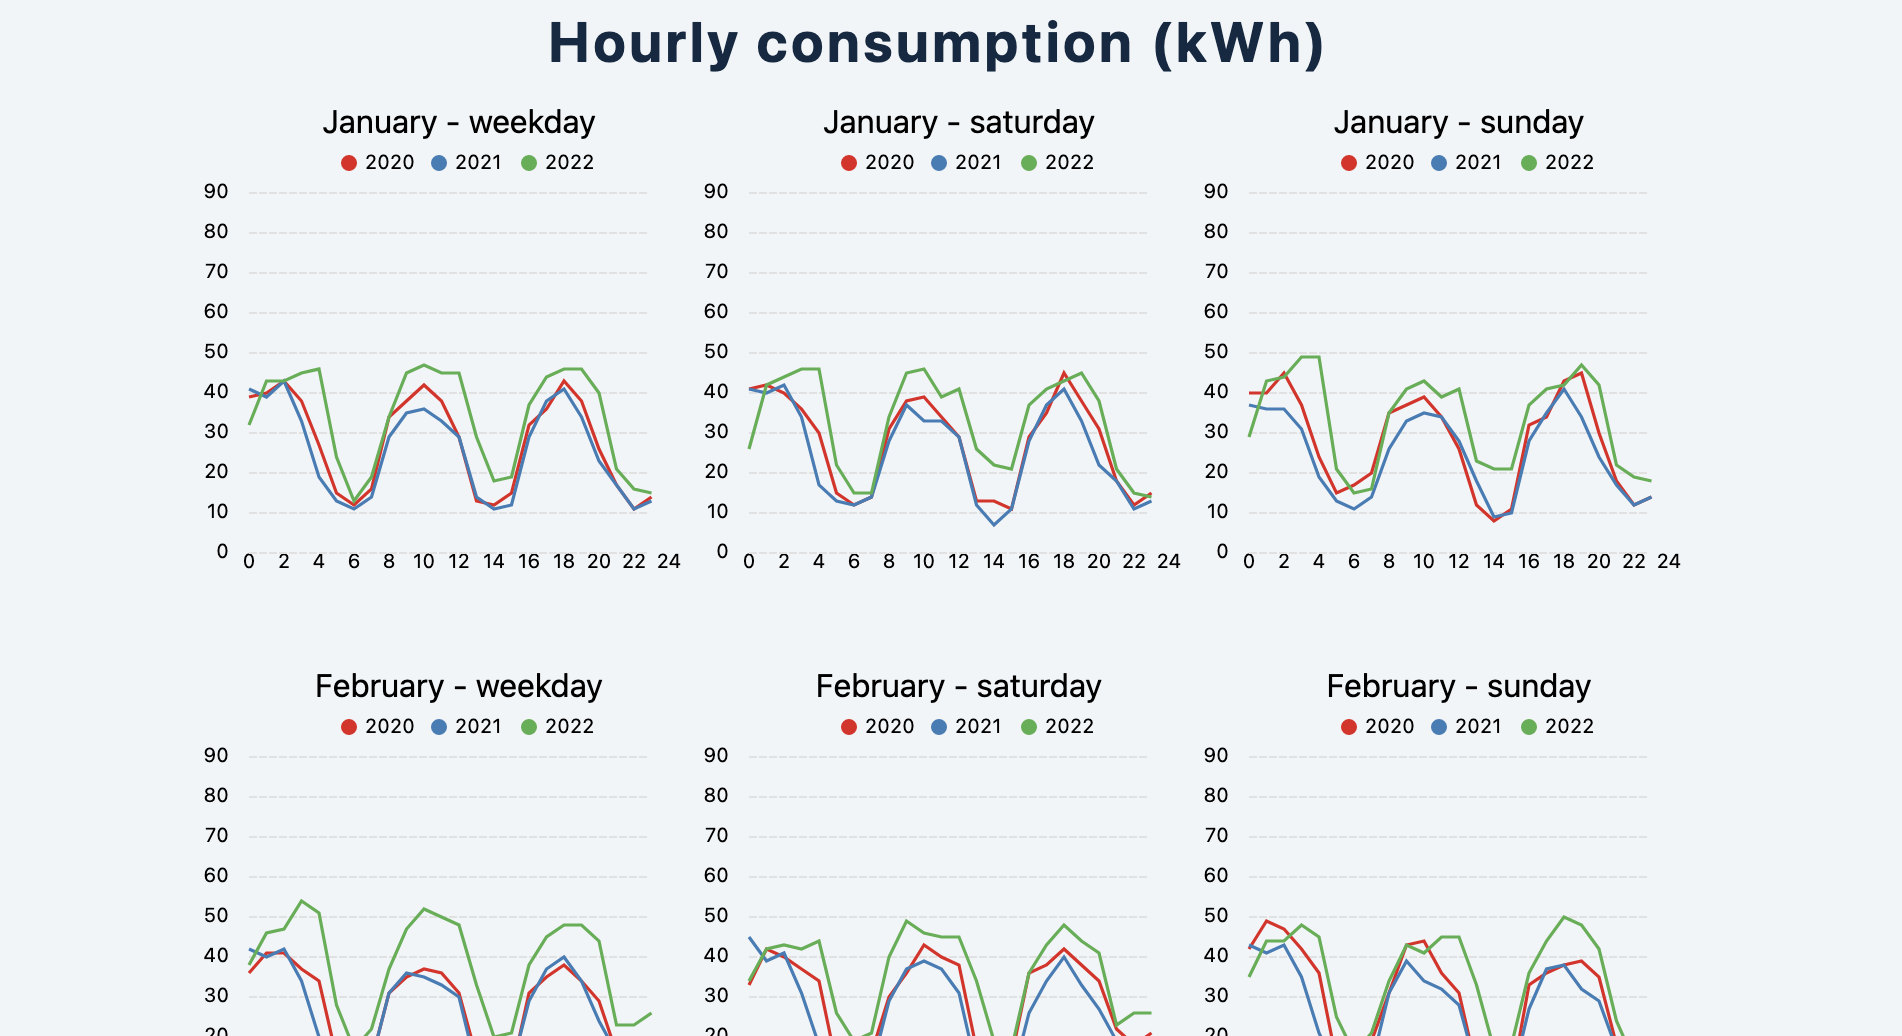
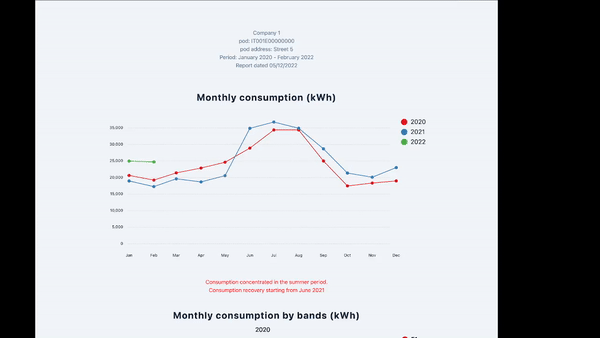
In order to speed up the workflow and improve the consulting services offered to my customers, I created Energy Dashboard: an app that allows me:
- to visually analyze my customers' electricity and gas consumption in order to bring out anomalies and trends;
- print a PDF report to be delivered to the customer.
For this project I wanted to use React because it is a very popular library and because when I tried it I fell in love with it!
Tech stack: HTML, CSS, Javascript, React, D3, GraphQL, JWT, Cookies, Strapi.
User should be able to:
- upload a 3-year time series for each of his clients to a content management system (CMS)
- log into account
- display the list of all his clients in a sidebar
- search for a specific client
- print the report with charts and comments in PDF
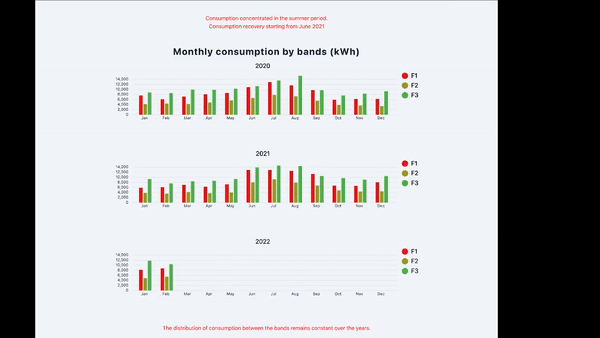
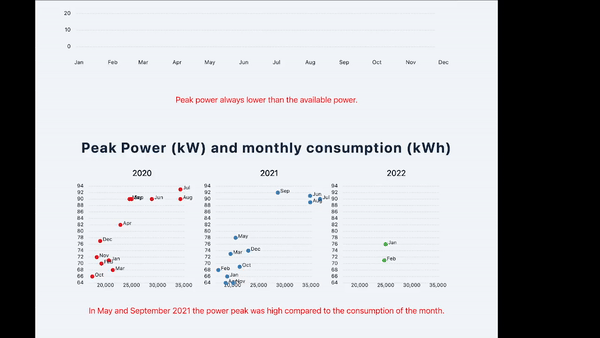
Type of charts needed:
- Line plot with three groups
- Grouped barplot
- Scatterplot
This project allowed me to familiarize myself with React and learn how to combine React and D3.
As Amelia Wattenberger stated in this article:
These two technologies (React and D3) are notoriously tricky to combine. The crux of the issue is that they both want to handle the DOM.
What are the benefits of using standard JSX instead of running d3 code on mount? Following Amalia:
- Declarative instead of imperative. The code describes what is being drawn, instead of how to draw it.
- Less code.
- Less hacky. React is, chiefly, a rendering library, and has many optimizations to keep our web apps performant. When adding elements using d3, we're hacking around React, and essentially have to fight against those optimizations. Hacking around your JS framework is a recipe for future frustration, especially if the framework's API changes.
So I decided to let React handle the DOM and use the powerful D3 built-in shapes.
Once I figured it out how React would render the data to generate the line chart with multiple groups and so the shape of the dataset it expects - basically a nested array, I faced the problem of how to generate the nested array starting from the dataset I got from the API.
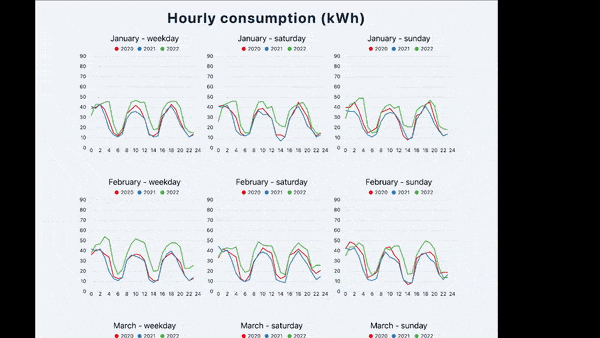
A big challenge was to draw the hourly consumptions charts (for a 3-year time series it means more 24.000 data points). I wanted to compare the average hourly consumption from year to year, month to month, working day to working day, Saturday to Saturday and Sunday to Sunday
Another big issue was to print the hourly consumption charts nicely in PDF!
For user authentication to the Strapi backend I used JWT and Cookies.
🌱 I'm studying:
- Next.js
- Typescript
- D3.js, Framer Motion.
- Data structures and algorithms. In March 2022 I got the FreeCodeCamp certificate: "Javascript Algorithms and Data Structures".
- Canvas API 👉 Particles effect with HTML5 and Vanilla JS
🔭 I’m currently working for a IT consulting company
📫 Connect with me on Twitter!
👯 I’m looking to collaborate on open source projects!
📄 Want to know about my experiences? Visit my LinkedIn!