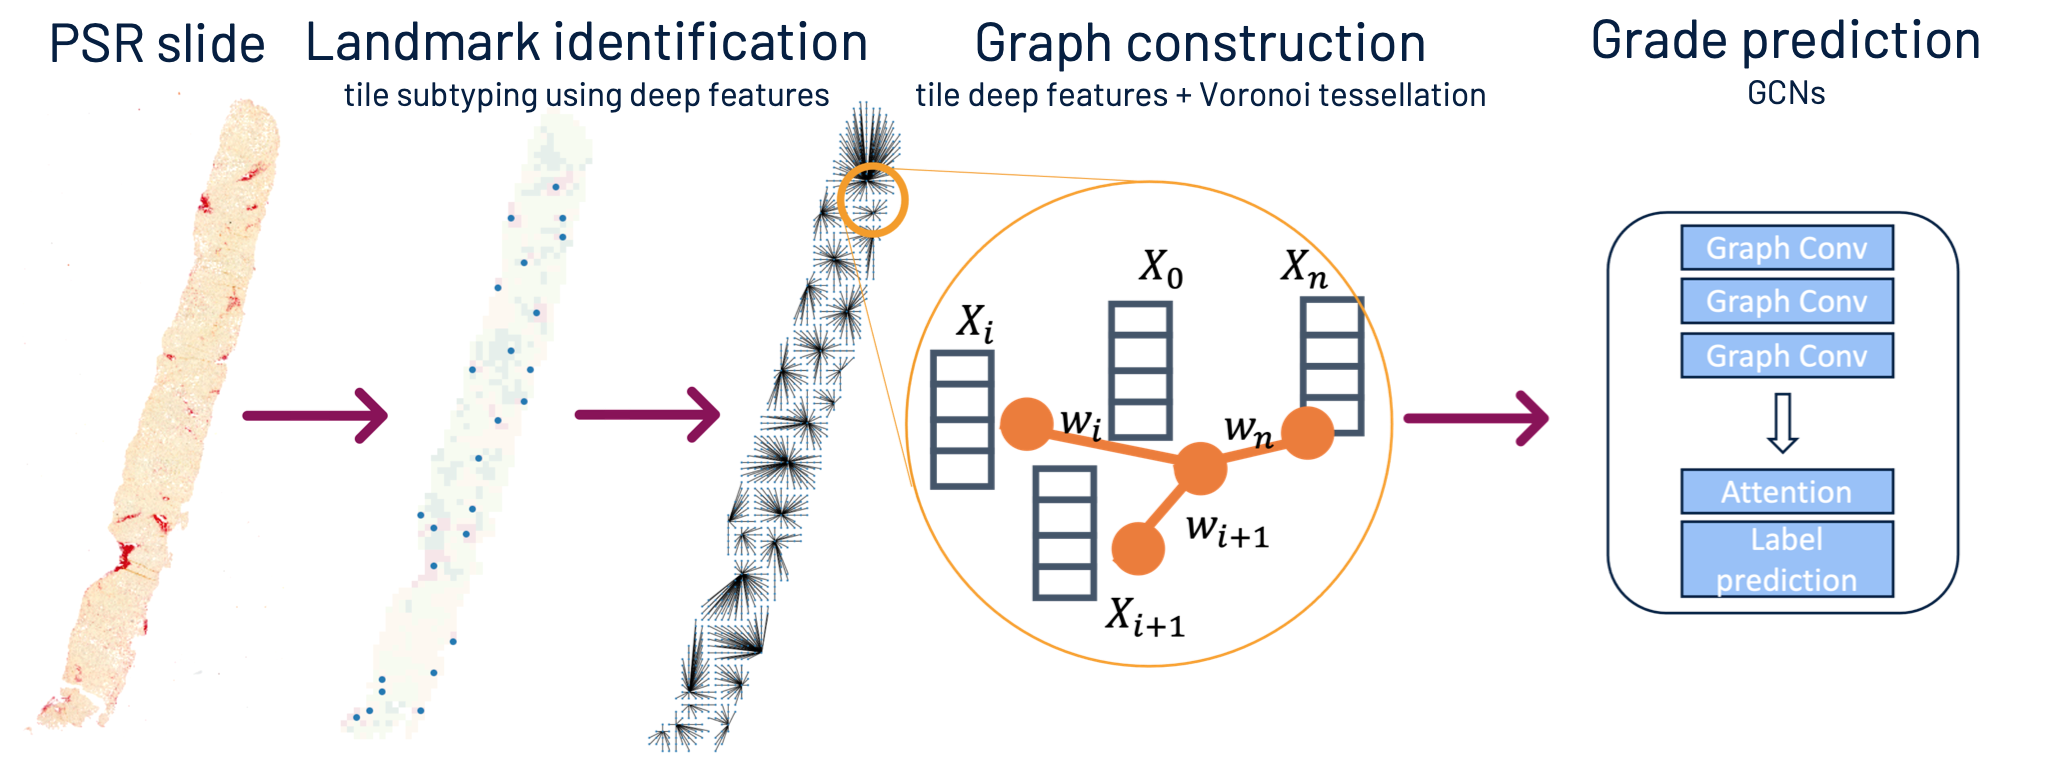
This is the code from the Early Detection of Liver Fibrosis Using Graph Convolutional Networks paper originally presented at the MICCAI'21 conference. The purpose is to predict fibrosis grade from a PSR-stained liver biopsy. The graph construction pipeline is designed to explicitly mimic liver tissue architecture.
Here the code is divided into three scripts:
- Tile clustering for tissue landmark identification
- Case processing (tile-by-tile classification)
- Biopsy graph construction for biopsy grade prediction
The clustering pipeline takes in a folder of tissue tiles saved as image files and performs k-means clustering of the tiles based on tile deep features. In the paper we used pre-segmented binary collagen tiles as input.

The tile classification takes in a biopsy slide and performs collagen pattern classification on each tile separately, according to the learnt clusters. The classification output is saved in an array of tile-by-tile classification results, where each tile is represented by an integer in the range [-1, 3]. Background tiles are encoded with -1, and 0 to 3 encode fibrosis pattern subtypes.
The purpose of this part is to identify the liver tissue landmarks, i.e. dense collagen regions (tile subtype 3: red), which later become central nodes in the liver graph.
This part performs a Voronoi tesselation over the tile array. Centroids of dense-collagen regions become the centre nodes for the tesselation.
Each node in the graph represents one tile from the biopsy. The nodes contain tile features extracted with an ImageNet pre-trained deep network. The edge weights explicitly represent the distance between the tile and the centre node.
The reason for choosing this particular predefined graph structure is that liver tissue has a highly regular architecture centred around portal tracts, which are made of dense collagen.
Here we are using a GNN (GCN, GIN or GAT) to predict fibrosis grade from the constructed tissue graph.

You need to modify paths in the code to match your data format. Unfortunately due to the private nature of our data we are not able to share any examples.
- clustering.py expects path to im_dir, which is supposed to be a folder of presegmented tissue tiles saved in an image format (e.g. png). It outputs the res_net_kmeans.joblib classifier you can use for tile processing.
- process_case.py needs paths to image-segmentation map pairs, as well as the tile classifier from clustering.py. It outputs two numpy arrays per slide: prediction.npy and features_map.npy. Prediction.npy is the array of tile-wise class predictions and features_map.npy are the corresponding tile features. These are both needed for tissue graph construction.
- gcn_classification expects prediction.npy and features_map.npy, as well as a casewise_labels.csv which is the ground truth array for your dataset. You need to make sure that slide_name and ID are extracted from your filenames correctly.
This work is licensed under a Creative Commons Attribution-NonCommercial-ShareAlike 4.0 International License.
