Example plots
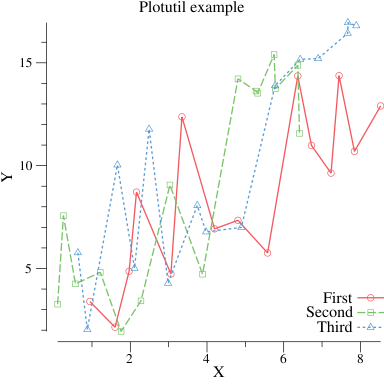
If the default style (color, dashes, and glyph shapes) work for you then the plotutil package makes creating line and points plots very easy:
package main

import (
	"math/rand"

	"gonum.org/v1/plot"
	"gonum.org/v1/plot/plotter"
	"gonum.org/v1/plot/plotutil"
	"gonum.org/v1/plot/vg"
)

func main() {
	rand.Seed(int64(0))

	p := plot.New()

	p.Title.Text = "Plotutil example"
	p.X.Label.Text = "X"
	p.Y.Label.Text = "Y"

	err := plotutil.AddLinePoints(p,
		"First", randomPoints(15),
		"Second", randomPoints(15),
		"Third", randomPoints(15))
	if err != nil {
		panic(err)
	}

	// Save the plot to a PNG file.
	if err := p.Save(4*vg.Inch, 4*vg.Inch, "points.png"); err != nil {
		panic(err)
	}
}

// randomPoints returns some random x, y points.
func randomPoints(n int) plotter.XYs {
	pts := make(plotter.XYs, n)
	for i := range pts {
		if i == 0 {
			pts[i].X = rand.Float64()
		} else {
			pts[i].X = pts[i-1].X + rand.Float64()
		}
		pts[i].Y = pts[i].X + 10*rand.Float64()
	}
	return pts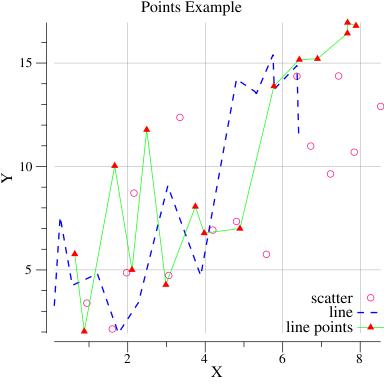
}If you need more fine-grained control it is available too:
package main

import (
	"image/color"
	"math/rand"

	"gonum.org/v1/plot"
	"gonum.org/v1/plot/plotter"
	"gonum.org/v1/plot/vg"
	"gonum.org/v1/plot/vg/draw"
)

func main() {
	// Get some random points
	rand.Seed(int64(0))
	n := 15
	scatterData := randomPoints(n)
	lineData := randomPoints(n)
	linePointsData := randomPoints(n)

	// Create a new plot, set its title and
	// axis labels.
	p := plot.New()

	p.Title.Text = "Points Example"
	p.X.Label.Text = "X"
	p.Y.Label.Text = "Y"
	// Draw a grid behind the data
	p.Add(plotter.NewGrid())

	// Make a scatter plotter and set its style.
	s, err := plotter.NewScatter(scatterData)
	if err != nil {
		panic(err)
	}
	s.GlyphStyle.Color = color.RGBA{R: 255, B: 128, A: 255}

	// Make a line plotter and set its style.
	l, err := plotter.NewLine(lineData)
	if err != nil {
		panic(err)
	}
	l.LineStyle.Width = vg.Points(1)
	l.LineStyle.Dashes = []vg.Length{vg.Points(5), vg.Points(5)}
	l.LineStyle.Color = color.RGBA{B: 255, A: 255}

	// Make a line plotter with points and set its style.
	lpLine, lpPoints, err := plotter.NewLinePoints(linePointsData)
	if err != nil {
		panic(err)
	}
	lpLine.Color = color.RGBA{G: 255, A: 255}
	lpPoints.Shape = draw.PyramidGlyph{}
	lpPoints.Color = color.RGBA{R: 255, A: 255}

	// Add the plotters to the plot, with a legend
	// entry for each
	p.Add(s, l, lpLine, lpPoints)
	p.Legend.Add("scatter", s)
	p.Legend.Add("line", l)
	p.Legend.Add("line points", lpLine, lpPoints)

	// Save the plot to a PNG file.
	if err := p.Save(4*vg.Inch, 4*vg.Inch, "points.png"); err != nil {
		panic(err)
	}
}

// randomPoints returns some random x, y points.
func randomPoints(n int) plotter.XYs {
	pts := make(plotter.XYs, n)
	for i := range pts {
		if i == 0 {
			pts[i].X = rand.Float64()
		} else {
			pts[i].X = pts[i-1].X + rand.Float64()
		}
		pts[i].Y = pts[i].X + 10*rand.Float64()
	}
	return pts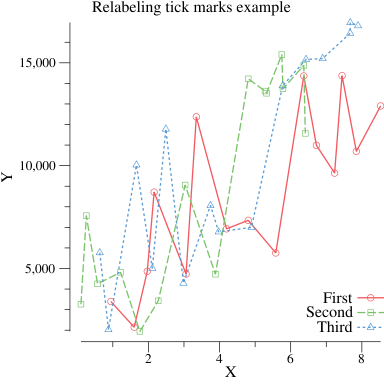
}You can override the Axis.Tick.Marker function to make your own custom tick marks. Some people like commas separating the place values of numbers:
package main

import (
	"math/rand"

	"gonum.org/v1/plot"
	"gonum.org/v1/plot/plotter"
	"gonum.org/v1/plot/plotutil"
	"gonum.org/v1/plot/vg"
)

func main() {
	rand.Seed(int64(0))

	p := plot.New()

	p.Title.Text = "Relabeling tick marks example"
	p.X.Label.Text = "X"
	p.Y.Label.Text = "Y"
	// Use a custom tick marker interface implementation with the Ticks function,
	// that computes the default tick marks and re-labels the major ticks with commas.
	p.Y.Tick.Marker = commaTicks{}

	err := plotutil.AddLinePoints(p,
		"First", randomPoints(15),
		"Second", randomPoints(15),
		"Third", randomPoints(15))
	if err != nil {
		panic(err)
	}

	// Save the plot to a PNG file.
	if err := p.Save(4*vg.Inch, 4*vg.Inch, "points_commas.png"); err != nil {
		panic(err)
	}
}

// RandomPoints returns some random x, y points.
func randomPoints(n int) plotter.XYs {
	pts := make(plotter.XYs, n)
	for i := range pts {
		if i == 0 {
			pts[i].X = rand.Float64()
		} else {
			pts[i].X = pts[i-1].X + rand.Float64()
		}
		pts[i].Y = (pts[i].X + 10*rand.Float64()) * 1000
	}
	return pts
}

type commaTicks struct{}
// Ticks computes the default tick marks, but inserts commas
// into the labels for the major tick marks.
func (commaTicks) Ticks(min, max float64) []plot.Tick {
	tks := plot.DefaultTicks{}.Ticks(min, max)
	for i, t := range tks {
		if t.Label == "" { // Skip minor ticks, they are fine.
			continue
		}
		tks[i].Label = addCommas(t.Label)
	}
	return tks
}

// AddCommas adds commas after every 3 characters from right to left.
// NOTE: This function is a quick hack, it doesn't work with decimal
// points, and may have a bunch of other problems.
func addCommas(s string) string {
	rev := ""
	n := 0
	for i := len(s) - 1; i >= 0; i-- {
		rev += string(s[i])
		n++
		if n%3 == 0 {
			rev += ","
		}
	}
	s = ""
	for i := len(rev) - 1; i >= 0; i-- {
		s += string(rev[i])
	}
	return s
}
package main
import (
"math/rand"
"gonum.org/v1/plot"
"gonum.org/v1/plot/plotter"
"gonum.org/v1/plot/plotutil"
)
func main() {
// Get some data.
n, m := 5, 10
pts := make([]plotter.XYer, n)
for i := range pts {
xys := make(plotter.XYs, m)
pts[i] = xys
center := float64(i)
for j := range xys {
xys[j].X = center + (rand.Float64() - 0.5)
xys[j].Y = center + (rand.Float64() - 0.5)
}
}
plt, err := plot.New()
if err != nil {
panic(err)
}
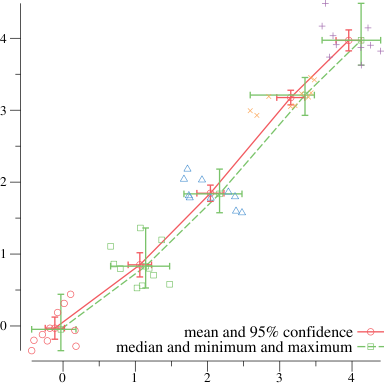
// Create two lines connecting points and error bars. For
// the first, each point is the mean x and y value and the
// error bars give the 95% confidence intervals. For the
// second, each point is the median x and y value with the
// error bars showing the minimum and maximum values.
mean95, err := plotutil.NewErrorPoints(plotutil.MeanAndConf95, pts...)
if err != nil {
panic(err)
}
medMinMax, err := plotutil.NewErrorPoints(plotutil.MedianAndMinMax, pts...)
if err != nil {
panic(err)
}
plotutil.AddLinePoints(plt,
"mean and 95% confidence", mean95,
"median and minimum and maximum", medMinMax)
plotutil.AddErrorBars(plt, mean95, medMinMax)
// Add the points that are summarized by the error points.
plotutil.AddScatters(plt, pts[0], pts[1], pts[2], pts[3], pts[4])
plt.Save(4*vg.Inch, 4*vg.Inch, "errpoints.png")
}
package main
import (
"gonum.org/v1/plot"
"gonum.org/v1/plot/plotter"
"gonum.org/v1/plot/plotutil"
"gonum.org/v1/plot/vg"
)
func main() {
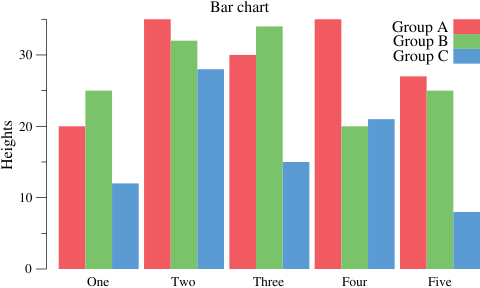
groupA := plotter.Values{20, 35, 30, 35, 27}
groupB := plotter.Values{25, 32, 34, 20, 25}
groupC := plotter.Values{12, 28, 15, 21, 8}
p := plot.New()
p.Title.Text = "Bar chart"
p.Y.Label.Text = "Heights"
w := vg.Points(20)
barsA, err := plotter.NewBarChart(groupA, w)
if err != nil {
panic(err)
}
barsA.LineStyle.Width = vg.Length(0)
barsA.Color = plotutil.Color(0)
barsA.Offset = -w
barsB, err := plotter.NewBarChart(groupB, w)
if err != nil {
panic(err)
}
barsB.LineStyle.Width = vg.Length(0)
barsB.Color = plotutil.Color(1)
barsC, err := plotter.NewBarChart(groupC, w)
if err != nil {
panic(err)
}
barsC.LineStyle.Width = vg.Length(0)
barsC.Color = plotutil.Color(2)
barsC.Offset = w
p.Add(barsA, barsB, barsC)
p.Legend.Add("Group A", barsA)
p.Legend.Add("Group B", barsB)
p.Legend.Add("Group C", barsC)
p.Legend.Top = true
p.NominalX("One", "Two", "Three", "Four", "Five")
if err := p.Save(5*vg.Inch, 3*vg.Inch, "barchart.png"); err != nil {
panic(err)
}
}
package main
import (
"image/color"
"math"
"gonum.org/v1/plot"
"gonum.org/v1/plot/plotter"
"gonum.org/v1/plot/vg"
)
func main() {
p := plot.New()
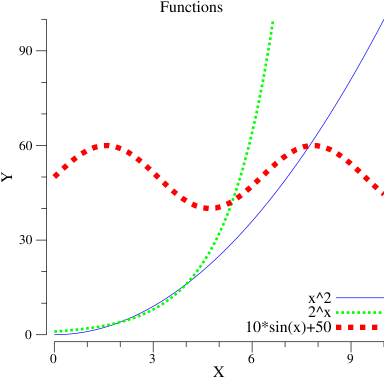
p.Title.Text = "Functions"
p.X.Label.Text = "X"
p.Y.Label.Text = "Y"
// A quadratic function x^2
quad := plotter.NewFunction(func(x float64) float64 { return x * x })
quad.Color = color.RGBA{B: 255, A: 255}
// An exponential function 2^x
exp := plotter.NewFunction(func(x float64) float64 { return math.Pow(2, x) })
exp.Dashes = []vg.Length{vg.Points(2), vg.Points(2)}
exp.Width = vg.Points(2)
exp.Color = color.RGBA{G: 255, A: 255}
// The sine function, shifted and scaled
// to be nicely visible on the plot.
sin := plotter.NewFunction(func(x float64) float64 { return 10*math.Sin(x) + 50 })
sin.Dashes = []vg.Length{vg.Points(4), vg.Points(5)}
sin.Width = vg.Points(4)
sin.Color = color.RGBA{R: 255, A: 255}
// Add the functions and their legend entries.
p.Add(quad, exp, sin)
p.Legend.Add("x^2", quad)
p.Legend.Add("2^x", exp)
p.Legend.Add("10*sin(x)+50", sin)
p.Legend.ThumbnailWidth = 0.5 * vg.Inch
// Set the axis ranges. Unlike other data sets,
// functions don't set the axis ranges automatically
// since functions don't necessarily have a
// finite range of x and y values.
p.X.Min = 0
p.X.Max = 10
p.Y.Min = 0
p.Y.Max = 100
// Save the plot to a PNG file.
if err := p.Save(4*vg.Inch, 4*vg.Inch, "functions.png"); err != nil {
panic(err)
}
}
package main
import (
"image/color"
"math"
"math/rand"
"gonum.org/v1/plot"
"gonum.org/v1/plot/plotter"
"gonum.org/v1/plot/vg"
"github.com/gonum/stat/distuv"
)
func main() {
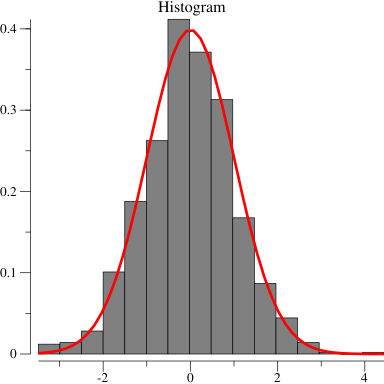
// Draw some random values from the standard
// normal distribution.
rand.Seed(int64(0))
v := make(plotter.Values, 10000)
for i := range v {
v[i] = rand.NormFloat64()
}
// Make a plot and set its title.
p := plot.New()
p.Title.Text = "Histogram"
// Create a histogram of our values drawn
// from the standard normal.
h, err := plotter.NewHist(v, 16)
if err != nil {
panic(err)
}
// Normalize the area under the histogram to
// sum to one.
h.Normalize(1)
p.Add(h)
// The normal distribution function
norm := plotter.NewFunction(distuv.UnitNormal.Prob)
norm.Color = color.RGBA{R: 255, A: 255}
norm.Width = vg.Points(2)
p.Add(norm)
// Save the plot to a PNG file.
if err := p.Save(4*vg.Inch, 4*vg.Inch, "hist.png"); err != nil {
panic(err)
}
}
package main

import (
	"math/rand"

	"gonum.org/v1/plot"
	"gonum.org/v1/plot/plotter"
	"gonum.org/v1/plot/vg"
)

func main() {
	// Get some data to display in our plot.
	rand.Seed(uint64(0))
	n := 10
	uniform := make(plotter.Values, n)
	normal := make(plotter.Values, n)
	expon := make(plotter.Values, n)
	for i := 0; i < n; i++ {
		uniform[i] = rand.Float64()
		normal[i] = rand.NormFloat64()
		expon[i] = rand.ExpFloat64()
	}

	// Create the plot and set its title and axis label.
	p := plot.New()

	p.Title.Text = "Box plots"
	p.Y.Label.Text = "Values"

	// Make boxes for our data and add them to the plot.
	w := vg.Points(20)
	b0, err := plotter.NewBoxPlot(w, 0, uniform)
        b0.FillColor = color.RGBA{127, 188, 165, 1}
	if err != nil {
		panic(err)
	}
	b1, err := plotter.NewBoxPlot(w, 1, normal)
        b1.FillColor = color.RGBA{127, 188, 165, 1}
	if err != nil {
		panic(err)
	}
	b2, err := plotter.NewBoxPlot(w, 2, expon)
        b2.FillColor = color.RGBA{127, 188, 165, 1}
	if err != nil {
		panic(err)
	}
	p.Add(b0, b1, b2)

	// Set the X axis of the plot to nominal with
	// the given names for x=0, x=1 and x=2.
	p.NominalX("Uniform\nDistribution", "Normal\nDistribution",
		"Exponential\nDistribution")

	if err := p.Save(3*vg.Inch, 4*vg.Inch, "boxplot.png"); err != nil {
		panic(err)
	}
}
Or, the same plot using the plotutil package:
package main

import (
	"math/rand"

	"gonum.org/v1/plot"
	"gonum.org/v1/plot/plotter"
	"gonum.org/v1/plot/plotutil"
	"gonum.org/v1/plot/vg"
)

func main() {
	// Get some data to display in our plot.
	rand.Seed(int64(0))
	n := 10
	uniform := make(plotter.Values, n)
	normal := make(plotter.Values, n)
	expon := make(plotter.Values, n)
	for i := 0; i < n; i++ {
		uniform[i] = rand.Float64()
		normal[i] = rand.NormFloat64()
		expon[i] = rand.ExpFloat64()
	}

	// Create the plot and set its title and axis label.
	p := plot.New()

	p.Title.Text = "Box plots"
	p.Y.Label.Text = "Values"

	// Make boxes for our data and add them to the plot.
	err := plotutil.AddBoxPlots(p, vg.Points(20),
		"Uniform\nDistribution", uniform,
		"Normal\nDistribution", normal,
		"Exponential\nDistribution", expon)
	if err != nil {
		panic(err)
	}

	if err := p.Save(3*vg.Inch, 4*vg.Inch, "boxplot.png"); err != nil {
		panic(err)
	}
}
package main
import (
"math/rand"
"gonum.org/v1/plot"
"gonum.org/v1/plot/plotter"
"gonum.org/v1/plot/vg"
)
func main() {
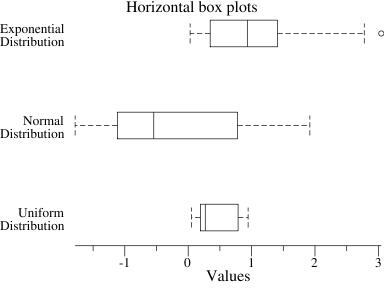
// Get some data to display in our plot.
rand.Seed(int64(0))
n := 10
uniform := make(plotter.Values, n)
normal := make(plotter.Values, n)
expon := make(plotter.Values, n)
for i := 0; i < n; i++ {
uniform[i] = rand.Float64()
normal[i] = rand.NormFloat64()
expon[i] = rand.ExpFloat64()
}
// Create the plot and set its title and axis label.
p := plot.New()
p.Title.Text = "Horizontal box plots"
p.X.Label.Text = "Values"
// Make horizontal boxes for our data and add
// them to the plot.
w := vg.Points(20)
b0, err := plotter.MakeHorizBoxPlot(w, 0, uniform)
if err != nil {
panic(err)
}
b1, err := plotter.MakeHorizBoxPlot(w, 1, normal)
if err != nil {
panic(err)
}
b2, err := plotter.MakeHorizBoxPlot(w, 2, expon)
if err != nil {
panic(err)
}
p.Add(b0, b1, b2)
// Set the Y axis of the plot to nominal with
// the given names for y=0, y=1 and y=2.
p.NominalY("Uniform\nDistribution", "Normal\nDistribution",
"Exponential\nDistribution")
if err := p.Save(4*vg.Inch, 3*vg.Inch, "boxplot-horiz.png"); err != nil {
panic(err)
}
}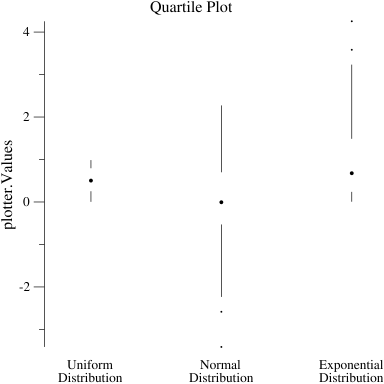
package main

import (
	"math/rand"

	"gonum.org/v1/plot"
	"gonum.org/v1/plot/plotter"
)

func main() {
	// Get some data to display in our plot.
	rand.Seed(int64(0))
	n := 10
	uniform := make(plotter.Values, n)
	normal := make(plotter.Values, n)
	expon := make(plotter.Values, n)
	for i := 0; i < n; i++ {
		uniform[i] = rand.Float64()
		normal[i] = rand.NormFloat64()
		expon[i] = rand.ExpFloat64()
	}

	// Create the plot and set its title and axis label.
	p := plot.New()

	p.Title.Text = "Quartile plots"
	p.Y.Label.Text = "Values"

	// Make boxes for our data and add them to the plot.
	q0, err := plotter.NewQuartPlot(0, uniform)
	if err != nil {
		panic(err)
	}
	q1, err := plotter.NewQuartPlot(1, normal)
	if err != nil {
		panic(err)
	}
	q2, err := plotter.NewQuartPlot(2, expon)
	if err != nil {
		panic(err)
	}
	p.Add(q0, q1, q2)

	// Set the X axis of the plot to nominal with
	// the given names for x=0, x=1 and x=2.
	p.NominalX("Uniform\nDistribution", "Normal\nDistribution",
		"Exponential\nDistribution")

	if err := p.Save(3*vg.Inch, 4*vg.Inch, "quartile.png"); err != nil {
		panic(err)
	}
}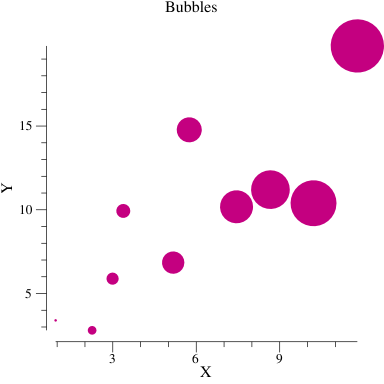
package main

import (
	"image/color"
	"math/rand"

	"gonum.org/v1/plot"
	"gonum.org/v1/plot/plotter"
	"gonum.org/v1/plot/vg"
)

func main() {
	rand.Seed(int64(0))
	n := 10
	bubbleData := randomTriples(n)

	p := plot.New()

	p.Title.Text = "Bubbles"
	p.X.Label.Text = "X"
	p.Y.Label.Text = "Y"

	bs, err := plotter.NewBubbles(bubbleData, vg.Points(1), vg.Points(20))
	if err != nil {
		panic(err)
	}
	bs.Color = color.RGBA{R: 196, B: 128, A: 255}
	p.Add(bs)

	if err := p.Save(4*vg.Inch, 4*vg.Inch, "bubble.png"); err != nil {
		panic(err)
	}
}

// randomTriples returns some random x, y, z triples
// with some interesting kind of trend.
func randomTriples(n int) plotter.XYZs {
	data := make(plotter.XYZs, n)
	for i := range data {
		if i == 0 {
			data[i].X = rand.Float64()
		} else {
			data[i].X = data[i-1].X + 2*rand.Float64()
		}
		data[i].Y = data[i].X + 10*rand.Float64()
		data[i].Z = data[i].X
	}
	return data
}
Also see the Creating Custom Plotters page for details on how the Bubbles plotter was implemented.