Creating Custom Plotters: A tutorial on creating custom Plotters
Plotters are Go types used by gonum/plot to draw data to a plot. Things such as lines, points, labels, box plots, etc. are each drawn using a different plotter. Thanks to Go's interfaces and gonum/plot's design, it is easy to create custom plotters, or custom types for displaying data in plots. In this tutorial, we will walk through the creation of the bubble plot plotter which is available in gonum/plot's plotter package.
Bubble plots are similar to scatter plots, plots of points on an x, y plane, however bubble plots show some information in a third dimension by using different sized points, or bubbles. Bubble plots can be useful for showing trends in x, y, and z dimensions on a 2-dimensional plot.
Here's an example:

Before we begin creating our plotter, we need to decide on the format in which it will accept data. A bubble plot needs x, y, and z values, and at the time of this writing there is no such format available in the plotter package. So, following the other formats in the plotter package, we will write an XYZer interface, an implementation of the interface, and a helper function to copy it. This step is not typically necessary unless your plotter needs data in a format that is not already available in the plotter package.
Here it is:
// XYZer wraps the Len and XYZ methods.
type XYZer interface {
	// Len returns the number of x, y, z triples.
	Len() int

	// XYZ returns an x, y, z triple.
	XYZ(int) (float64, float64, float64)
}

// XYZs implements the XYZer interface using a slice.
type XYZs []struct{ X, Y, Z float64 }

// Len implements the Len method of the XYZer interface.
func (xyz XYZs) Len() int {
	return len(xyz)
}

// XYZ implements the XYZ method of the XYZer interface.
func (xyz XYZs) XYZ(i int) (float64, float64, float64) {
	return xyz[i].X, xyz[i].Y, xyz[i].Z
}

// CopyXYZs copies an XYZer.
func CopyXYZs(data XYZer) XYZs {
	cpy := make(XYZs, data.Len())
	for i := range cpy {
		cpy[i].X, cpy[i].Y, cpy[i].Z = data.XYZ(i)
	}
	return cpy
}Our bubble plot plotter must be a Go type that implements the Plotter interface. Our type will store a copy of the XYZer used to create it. (All plotters in the plotter package use a copy of the data so that the original Valuer, XYer, or XYZer may change their values without affecting the created plotters.)
We need to decide what we want the user to have the ability to configure. For bubble plots, we would like the user to be able to chose the color of the bubbles, the minimum bubble radius, and the maximum bubble radius. We also need to choose what information we would like to pre-compute on creation of the plotter. We will need the minimum and maximum z values of the data. Here is our bubble plot type:
// Bubbles implements the Plotter interface, drawing
// a bubble plot of x, y, z triples where the z value
// determines the radius of the bubble.
type Bubbles struct {
	XYZs

	// Color is the color of the bubbles.
	color.Color

	// MinRadius and MaxRadius give the minimum and
	// maximum bubble radius respectively.  The radius
	// of each bubble is interpolated linearly between
	// these two values.
	MinRadius, MaxRadius vg.Length

	// MinZ and MaxZ are the minimum and maximum Z
	// values from the data.
	MinZ, MaxZ float64
}
At this point, it is useful to discuss the vg.Length type; both the MinRadius and MaxRadius fields have this type. In short, vg.Length is used to represent lengths or distances for drawing without worrying about the conversion between different units. In order to get a value of type vg.Length one must either specify the units (with vg.Points(), vg.Inches(), etc.) or explicitly coerce a float64 into a vg.Length, making it difficult to mix units. More details are available in the documentation for gonum/plot's vector graphics library, vg.
By the a convention of the plotter package, each plotter has a 'New' function that is used to create a new instance of the plotter from data. Our 'New' function will copy the data, set the minimum and maximum radius fields and compute the minimum and maximum Z values:
// NewBubbles creates as new bubble plot plotter for
// the given data, with a minimum and maximum
// bubble radius.
func NewBubbles(xyz XYZer, min, max vg.Length) *Bubbles {
	cpy := CopyXYZs(xyz)
	minz := cpy[0].Z
	maxz := cpy[0].Z
	for _, d := range cpy {
		minz = math.Min(minz, d.Z)
		maxz = math.Max(maxz, d.Z)
	}
	return &Bubbles{
		XYZs: cpy,
		MinRadius: min,
		MaxRadius: max,
		MinZ: minz,
		MaxZ: maxz,
	}
}The Plotter interface requires only a single method be implemented: the Plot method. The Plot method has two parameters, the first of which is a draw.Canvas to which the plotter should draw its data, and the second is the Plot, which can be used for determining the transformation from data coordinates to drawing coordinates.
This last point may need some further explanation. One of the main jobs of a plot is to convert between coordinate systems: the coordinate system of the user's data and the coordinate system of the plot's data display area. We will do this using the Transforms method of the *Plot type. The Transforms method takes a *draw.Canvas as its parameter and returns two functions that transform from the data X and Y coordinate systems respectively (represented by the plot's X and Y axes) to the coordinate system of the draw area. We will create these transforms using the following statement:
trX, trY := plt.Transforms(&c)We can now feed data values into trX and trY to transform them into locations on the draw.Canvas. For example, if we give trX the minimum value on the X axis (plt.X.Min) then we will get back the minimum X location in the draw.Canvas (c.Min.X). We will use these functions to locate the x,y points of our bubbles on the drawing surface.
Here is our Plot method:
// Plot implements the Plot method of the plot.Plotter interface.
func (bs *Bubbles) Plot(c draw.Canvas, plt *plot.Plot) {
	trX, trY := plt.Transforms(&c)

	c.SetColor(bs.Color)

	for _, d := range bs.XYZs {
		// Transform the data x, y coordinate of this bubble
		// to the corresponding drawing coordinate.
		x := trX(d.X)
		y := trY(d.Y)

		// Get the radius of this bubble.  The radius
		// is specified in drawing units (i.e., its size
		// is given as the final size at which it will
		// be drawn) so it does not need to be transformed.
		rad := bs.radius(d.Z)

		// Fill a circle centered at x,y on the draw area.
		var p vg.Path
		p.Move(x + rad, y)
		p.Arc(x, y, rad, 0, 2*math.Pi)
		p.Close()
		c.Fill(p)
	}
}

// radius returns the radius of a bubble, in drawing
// units (vg.Lengths), by linear interpolation.
func (bs *Bubbles) radius(z float64) vg.Length {
	if bs.MinZ == bs.MaxZ {
		return (bs.MaxRadius - bs.MinRadius)/2 + bs.MinRadius
	}

	// Convert MinZ and MaxZ to vg.Lengths.  We just
	// want them to compute a slope so the units
	// don't matter, and the conversion is OK.
	minz := vg.Length(bs.MinZ)
	maxz := vg.Length(bs.MaxZ)

	slope := (bs.MaxRadius - bs.MinRadius) / (maxz - minz)
	intercept := bs.MaxRadius - maxz*slope
	return vg.Length(z)*slope + intercept
}Now, let's test it out with some data:
func TestBubbles(t *testing.T) {
	rand.Seed(int64(0))
	n := 10
	bubbleData := randomTriples(n)

	p, err := plot.New()
	if err != nil {
		panic(err)
	}
	p.Title.Text = "Bubbles"
	p.X.Label.Text = "X"
	p.Y.Label.Text = "Y"

	bs := NewBubbles(bubbleData, vg.Points(1), vg.Points(20))
	bs.Color = color.RGBA{R:196, B:128, A: 255}
	p.Add(bs)

	// Axis ranges that seem to include all bubbles.
	p.X.Min = 0
	p.X.Max = 15
	p.Y.Min = 0
	p.Y.Max = 25

	if err := p.Save(4*vg.Inch, 4*vg.Inch, "bubble.png"); err != nil {
		panic(err)
	}
}

// randomTriples returns some random x, y, z triples
// with some interesting kind of trend.
func randomTriples(n int) XYZs {
	data := make(XYZs, n)
	for i := range data {
		if i == 0 {
			data[i].X = rand.Float64()
		} else {
			data[i].X = data[i-1].X + 2*rand.Float64()
		}
		data[i].Y = data[i].X + 10*rand.Float64()
		data[i].Z = data[i].X
	}
	return data
}
And it looks like this:
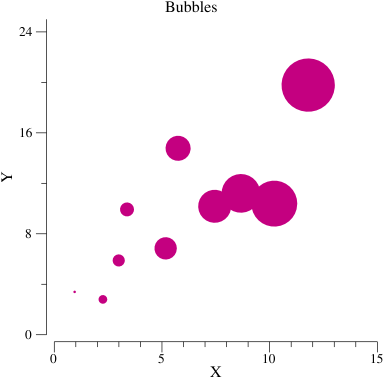
Pretty good. The bubbles get bigger as we move in the positive direction along the x axis, and this is what we expect because the z values are equal to the x values.
One problem or annoyance you may have noticed is that we had to set the axis ranges on the plot manually. This is a pain because it involves trial and error. Luckily gonum/plot has a solution for this, it is called the DataRanger interface. The DataRanger interface has a single method called DataRange that returns the minimum and maximum x and y values for the data. When a plotter implementing DataRanger is added to a plot (when p.Add is called above), the plot adjusts its axis ranges so that the ranges of x and y values reported by the DataRange method are covered by the axes. Essentially, this allows the axes of the plot to automatically fit to the data as you add it to the plot. (Note that, since the re-sizing happens when you add the data, you can change the axis ranges after data is added if you want to specify different ranges manually.)
Let's implement this simple method for our bubble plots:
// XYValues implements the XYer interface, returning the
// x and y values from an XYZer.
type XYValues struct { XYZer }

// XY implements the XY method of the XYer interface.
func (xy XYValues) XY(i int) (float64, float64) {
	x, y, _ := xy.XYZ(i)
	return x, y
}

// DataRange implements the DataRange method
// of the plot.DataRanger interface.
func (bs *Bubbles) DataRange() (xmin, xmax, ymin, ymax float64) {
	// Note that by defining the XYValues type, which
	// implements the XYer interface, we can easily re-use
	// the XYRange function from the plotter package to
	// compute the minimum and maximum X and Y values.
	return XYRange(XYValues{bs.XYZs})
}
Now, we can remove the following lines from our example:
	// Axis ranges that seem to include all bubbles.
	p.X.Min = 0
	p.X.Max = 15
	p.Y.Min = 0
	p.Y.Max = 25
And the resulting plot looks like this:
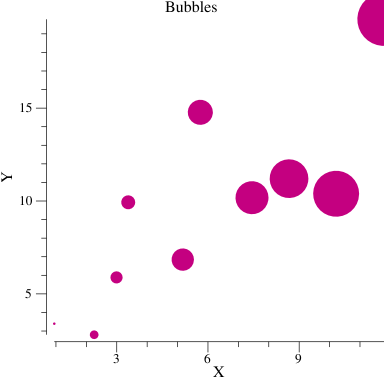
So, it looks like our axes were correctly set to the range of data for the bubbles, but this has exposed a new problem: the bubbles are clipped by the edge of the plot! The reason that this happens is because the data points correspond to the center of the bubbles, but the bubble glyph draws beyond the center and some of the glyphs go off of the end of the plot.
One possible solution to this problem would be to have the data range of the bubble plot be bigger than the actual range of the data to, accommodate for the bubbles. Unfortunately, this is not a good solution because the transformation between data coordinates, which are used by the DataRanger interface and drawing coordinates, which are used by the bubble radii, is not defined at the time the DataRange method is called.
gonum/plot has a different solution to this problem called the GlyphBoxer interface. The GlyphBoxer interface has a single method: the GlyphBoxes method. The GlyphBoxes method returns a slice of GlyphBoxes which describe the size and location of the glyphs drawn by the plotter. Each GlyphBox specifies the point in normalized data coodinates relative to which the glyph will be drawn, and the size of the glyph in drawing coordinates.
Normalized data coordinates is a mouth-full, but it is quite simple; they are x and y values normalized to the range of the plot's axes. Thus the minimum x value on the x axis has a normalized data coordinate of 0, the maximum x value on the x axis has a normalized data coordinate of 1, and the x value half-way between the minimum and maximum has a normalized data coordinate of 0.5. There are also some methods on the plot's axes that will compute these for us, as we will see below.
Now we are ready to implement the GlyphBoxes method:
// GlyphBoxes implements the GlyphBoxes method
// of the plot.GlyphBoxer interface.
func (bs *Bubbles) GlyphBoxes(plt *plot.Plot) []plot.GlyphBox {
	boxes := make([]plot.GlyphBox, len(bs.XYZs))
	for i, d := range bs.XYZs {
		// normalized x and y coordinates from the X
		// and Y axes of the plot.
		boxes[i].X = plt.X.Norm(d.X)
		boxes[i].Y = plt.Y.Norm(d.Y)

		// The bounding box of the glyph, which is
		// centered at the x, y point.
		r := bs.radius(d.Z)
		boxes[i].Rectangle = draw.Rectangle{
			// The minimum point of our glyph box is
			// the radius of the bubble less than the
			// center point in both the x and y directions.
			Min: draw.Point{-r, -r},

			// The maximum is the center plus the radius.
			Max: draw.Point{+r, +r},
		}
	}
	return boxes
}
For debugging purposes, gonum/plot's plotter package has a special plotter that will draw red boxes showing all of the plot's glyph boxes. We can use this plotter to ensure that our glyph boxes accurately represent each of our bubbles. Simply add the following line to the Test_bubbles function on the line before the plot is saved:
p.Add(NewGlyphBoxes())Here is what we end up with:
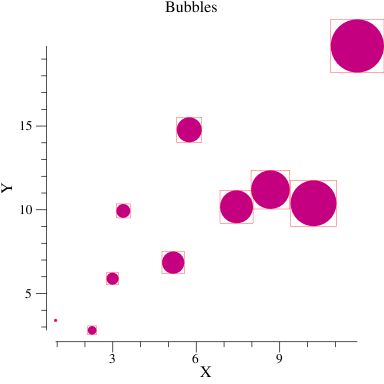
Notice that the plot has been padded to accommodate for the bubble glyphs, and each bubble is correctly bounded by a glyph box, drawn via the special GlyphBoxes plotter. The GlyphBoxes plotter can now be removed, and we end up with our final plot, shown at the beginning of this tutorial!