Gregory P. Way, Maria Kost-Alimova, Tsukasa Shibue, William F. Harrington, Stanley Gill, Federica Piccioni, Tim Becker, Hamdah Shafqat-Abbasi, William C. Hahn, Anne E. Carpenter, Francisca Vazquez, Shantanu Singh
2020
Table of contents generated with markdown-toc
Cell health can be altered by genetic and chemical perturbations. An increased understanding of these perturbation mechanisms is directly relevant for drug discovery and personalized medicine. Here and in an accompanying paper, we present two novel cell imaging assays that together measure 70 different aspects of cell health, such as proliferation, apoptosis, and cell cycle stalling. However, these assays require expensive reagents and do not scale well. Therefore, we also developed a machine learning solution to predict cell health readouts directly from a separate assay, known as Cell Painting. In contrast to the Cell Health assays, Cell Painting is inexpensive, high-throughput, and unbiased (reagents are not targeted). We predict many cell health indicators with high performance, but other readouts could not be predicted. We validated our predictions by using orthogonal readouts and by applying the models to a large set of 1,500 drugs from the Drug Repurposing Hub. Cell health predictions for drugs can be browsed at https://broad.io/cell-health-app. We confirmed mitotic arrest, reactive oxygen species, and DNA damage in G1 cell cycle based phenotypes via PLK, proteasome, and aurora kinase/tubulin inhibition, respectively. In the future, we can use this approach to determine the cell health consequences of any perturbation in cells. We conducted this project using open science principles with open data and open source code.
The following repository stores a complete analysis pipeline using Cell Painting data to predict readouts from the Cell Health assays.
We first developed the customized microscopy assays we collectively call "Cell Health". The Cell Health assays are comprised of two different reagent panels: "Cell cycle" and "viability". Together, these two panels use reagents which mark different cell health phenotypes.
| Assay/Dye | Phenotype | Panel |
|---|---|---|
| Caspase 3/7 | Apoptosis | Viability |
| DRAQ7 | Cell death | Viability |
| CellROX | Reactive oxygen species | Viability |
| EdU | Cellular profileration | Cell cycle |
| Hoechst | DNA content | Cell cycle |
| pH3 | Cell division | Cell cycle |
| gH2Ax | DNA damage | Cell cycle |
We hypothesized that we can use unbiased and high dimensional Cell Painting profiles to predict cell health readouts.
This overview figure outlines the Cell Health assays, the Cell Painting assay, and our machine learning approach.
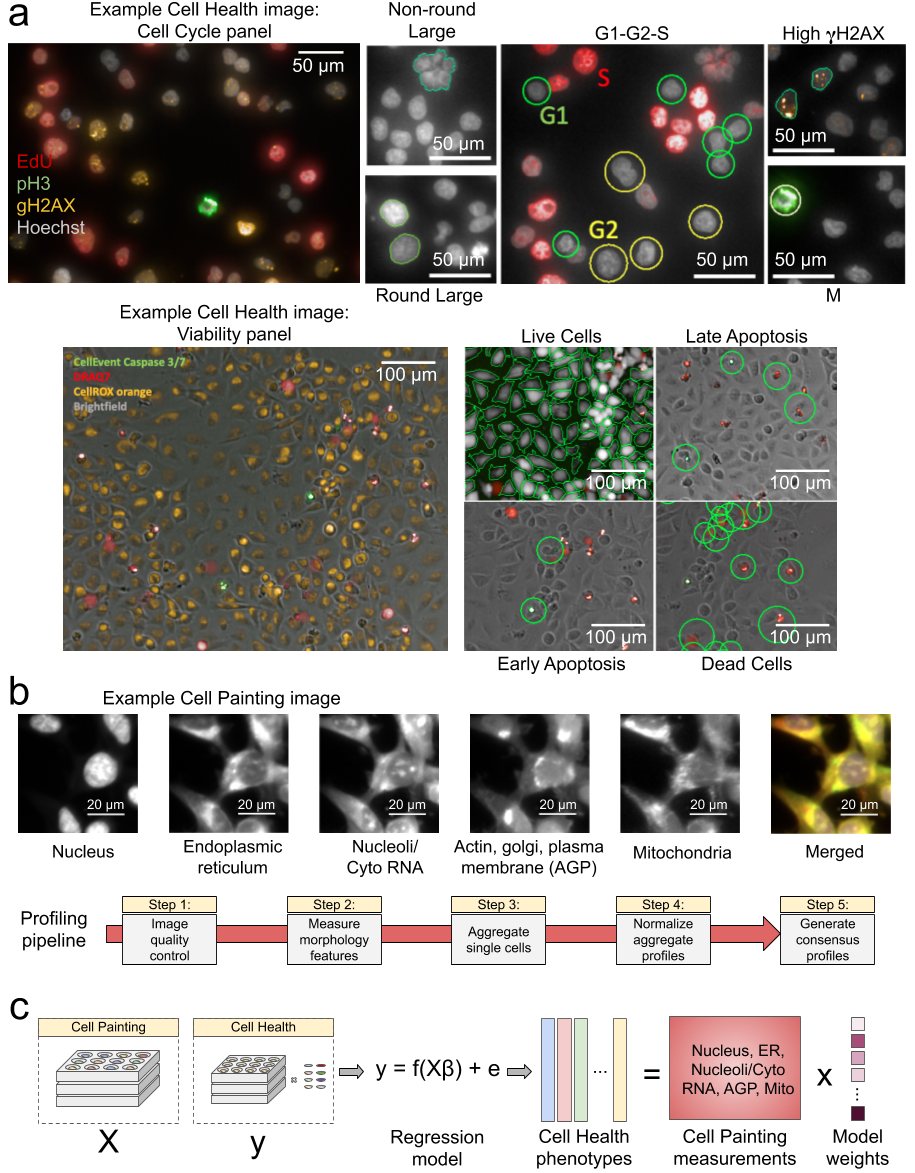
Data processing and modeling approach. (a) Example images and workflow from the Cell Health assays. We apply a series of manual gating strategies (see Methods) to isolate cell subpopulations and to generate cell health readouts for each perturbation. (top) In the “Cell Cycle” panel, in each nucleus we measure Hoechst, EdU, PH3, and gH2AX. (bottom) In the “Cell Viability” panel, we capture digital phase contrast images, measure Caspase 3/7, DRAQ7, CellROX, and (b) Example Cell Painting image across five channels, plus a merged representation across channels. The image is cropped from a larger image and shows ES2 cells. Below are the steps applied in an image-based profiling pipeline, after features have been extracted from each cell’s image. (c) Modeling approach where we fit 70 different regression models using CellProfiler features derived from Cell Painting images to predict Cell Health readouts.
All data are publicly available.
| Data | Level | Location | Notes |
|---|---|---|---|
| Images | 1 | Image Data Resource (IDR) | Accession idr0080 |
| SQLite file (single cell profiles ) | 2 | NIH Figshare https://doi.org/10.35092/yhjc.9995672 | 0.download-data/data (see 0.download-data/README.md) |
| Aggregated profiles with well information (metadata) | 3 | 1.generate-profiles/data/profiles | suffix: <PLATE>_augmented.csv.gz |
| Normalized aggregated profiles with metadata | 4a | 1.generate-profiles/data/profiles | suffix: <PLATE>_normalized.csv.gz |
| Normalized and feature selected aggregated profiles with metadata | 4b | 1.generate-profiles/data/profiles | suffix: <PLATE>_normalized_feature_select.csv.gz |
| Consensus profiles | 5 | 1.generate-profiles/data/consensus | Perturbation profiles created by summarizing replicates |
| Data | Level | Location | Notes |
|---|---|---|---|
| Cell health readouts | Raw | 1.generate-profiles/data/raw | Per cell health panel (cell cycle and viability) per cell line |
| Cell health readouts | Normalized | 1.generate-profiles/data/labels/normalized_cell_health_labels.tsv | |
| Cell health signatures | Consensus | 1.generate-profiles/data/consensus |
We apply all of our trained cell health models to Cell Painting data from the Drug Repurposing Hub. These data are available at https://doi.org/10.5281/zenodo.3928744.
We collected Cell Painting measurements using CRISPR perturbations. The experiment targeted 59 genes, which included 119 unique guides (~2 per gene), across 3 cell lines. The cell lines included A549, ES2, and HCC44.
| Cell Line | Primary Site |
|---|---|
| A549 | Lung cancer |
| ES2 | Ovarian cancer |
| HCC44 | Lung cancer |
About 60% of all CRISPR guides were reproducible. This is consistent with previous genetic perturbations (Rohban et al. 2017). It is important to note that we are not actually interested in the CRISPR treatment specifically, but instead, just its corresponding readout in each cell health assay.
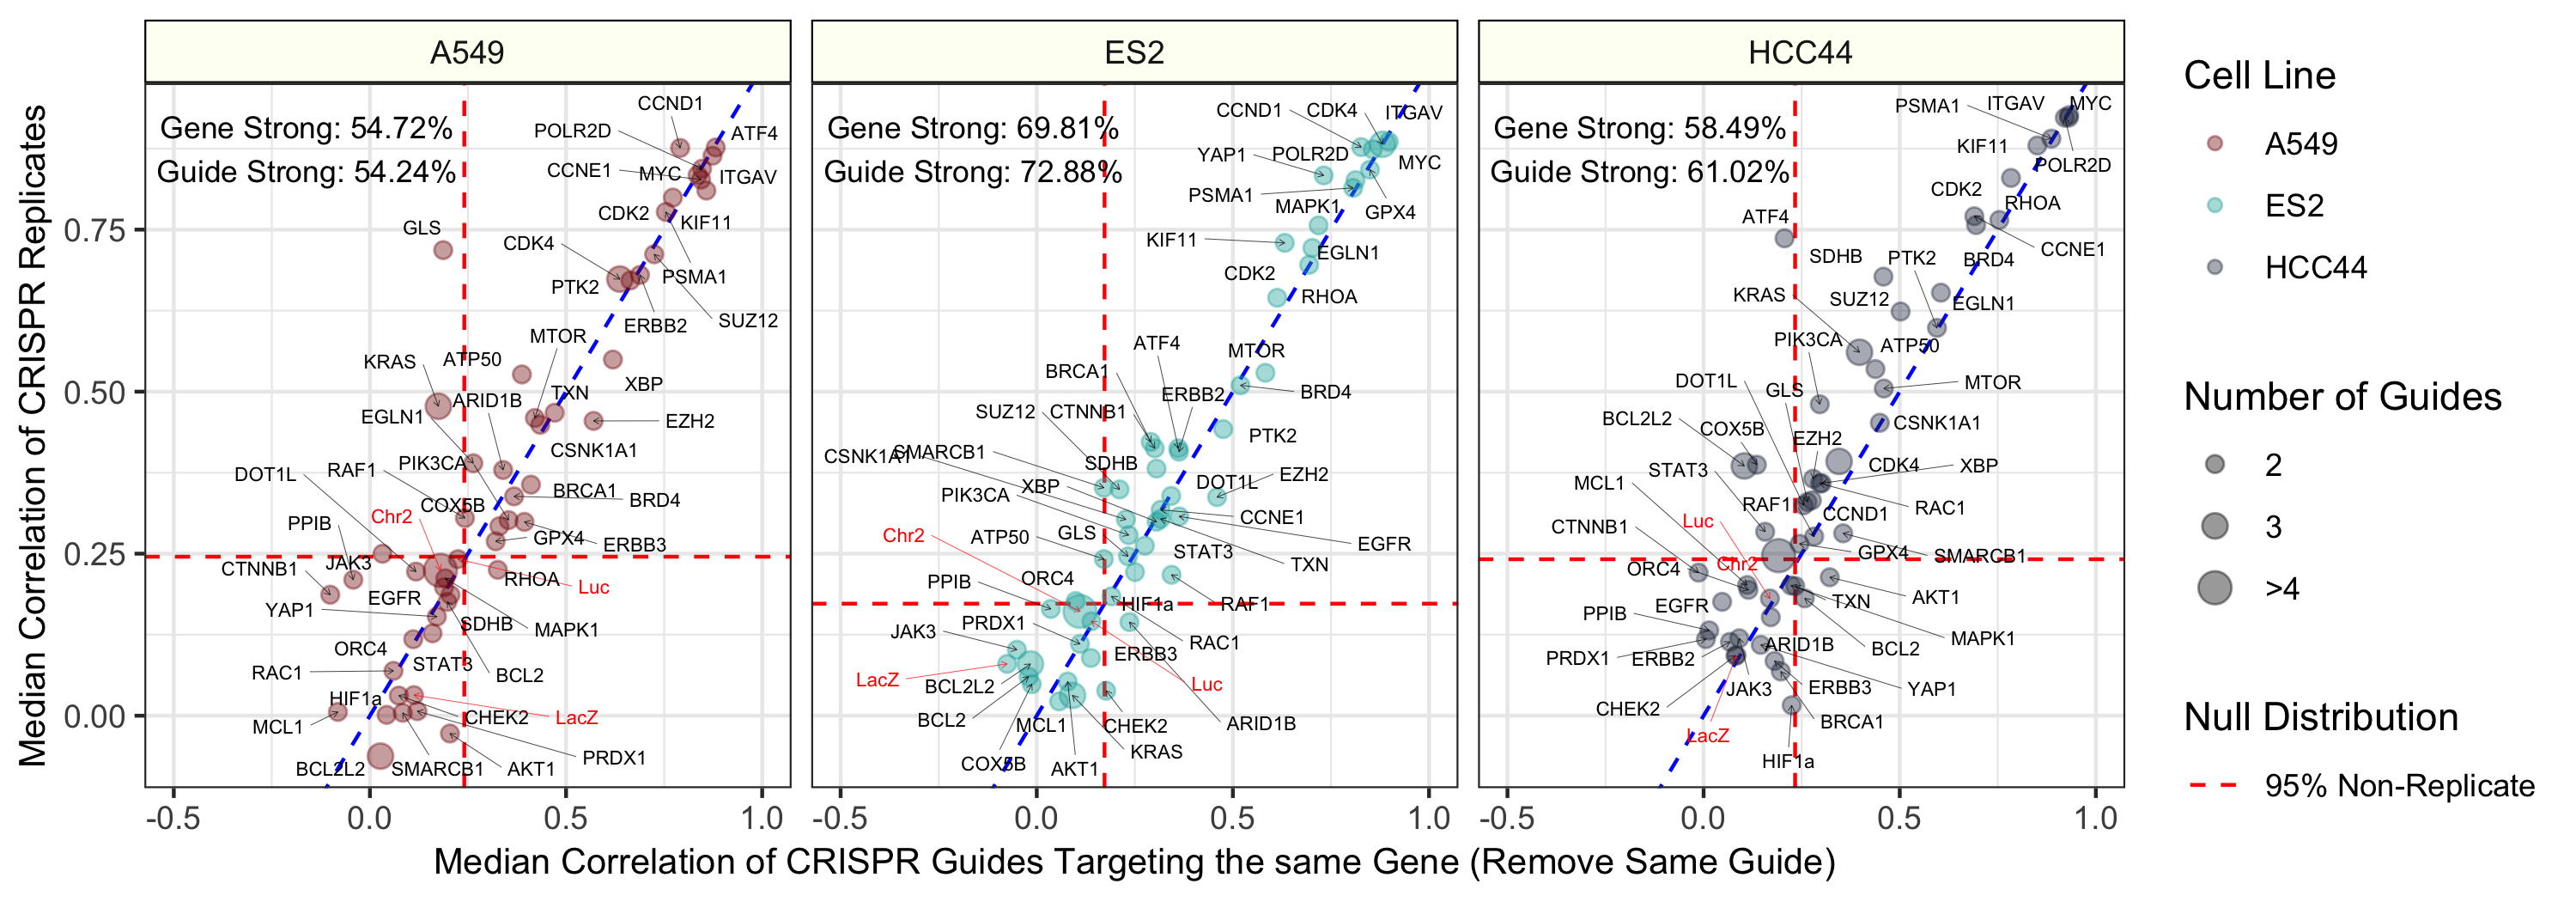
Median pairwise Pearson correlation of CRISPR guide replicate profiles (y axis) compared against Median pairwise Pearson correlation of CRISPR guides targeting the same gene or construct. We removed biological replicates when calculating the same-gene correlations. The three different cell lines (A549, ES2, and HCC44) are shown in different colors and in different facets of the figure. We generated the profiles by median aggregating CellProfiler measurements for all single cells within each well of a Cell Painting experiment (see Methods for more processing details). The text labels represent the proportion of gene and guide profiles with “strong phenotypes”. In other words, these profiles had replicate correlations greater than 95% of non-replicate pairwise Pearson correlations in the particular cell line. The dotted red line represents this 95% cutoff in the null distribution and the blue dotted line is y = x, which shows a strong consistency across CRISPR guide constructs.
The full analysis pipeline consists of the following steps:
| Order | Module | Description |
|---|---|---|
| 0.download-data | Download cell painting data | Retrieve single cell profiles archived on Figshare |
| 1.generate-profiles | Generate profiles | Generate and process cell painting and cell health assay readouts |
| 2.replicate-reproducibility | Determine replicate reproducibility | Determine the extent to which the CRISPR perturbations result in reproducible signatures |
| 3.train | Train machine learning models to predict cell health assays | Train and visualize regression models using cell painting data to predict cell health assay readouts |
| 4.apply | Apply the models | Apply the trained models to the Drug Repurposing Hub data to predict drug perturbation effect |
| 5.validate-repurposing | Validate the models | Use orthogonal readouts to validate the Drug Repurposing Hub predictions |
| 6.ml-robustness | Interrogate robustness of ML predictions | Assess sample size, feature groups, and cell line holdouts to probe ML robustness |
Each analysis module should be run in order. View each module for specific instructions on how to reproduce results.
analysis-pipeline.sh stores information on how to reproduce all analysis modules.
We use conda as a package manager. To install conda see instructions.
We recommend installing conda by downloading and executing the .sh file and accepting defaults.
To create the computational environment, run the following:
# Make sure the repo is cloned
conda env create --force --file environment.yml
conda activate cell-healthWe performed the following approach:
- Split data into 85% training and 15% test sets.
- Normalized data using the EMPTY controls in each plate (moderated z-score).
- Selected optimal hyperparamters using 5-fold cross-validation.
- Trained elastic net regression models to predict each of the 70 cell health assay readouts, independently.
- Trained using shuffled data as well.
- Report performance on training and test sets.
Initial results indicate that many of the cell health phenotypes can be predicted with high performance using our approach. However, there are many cell line specific differences.
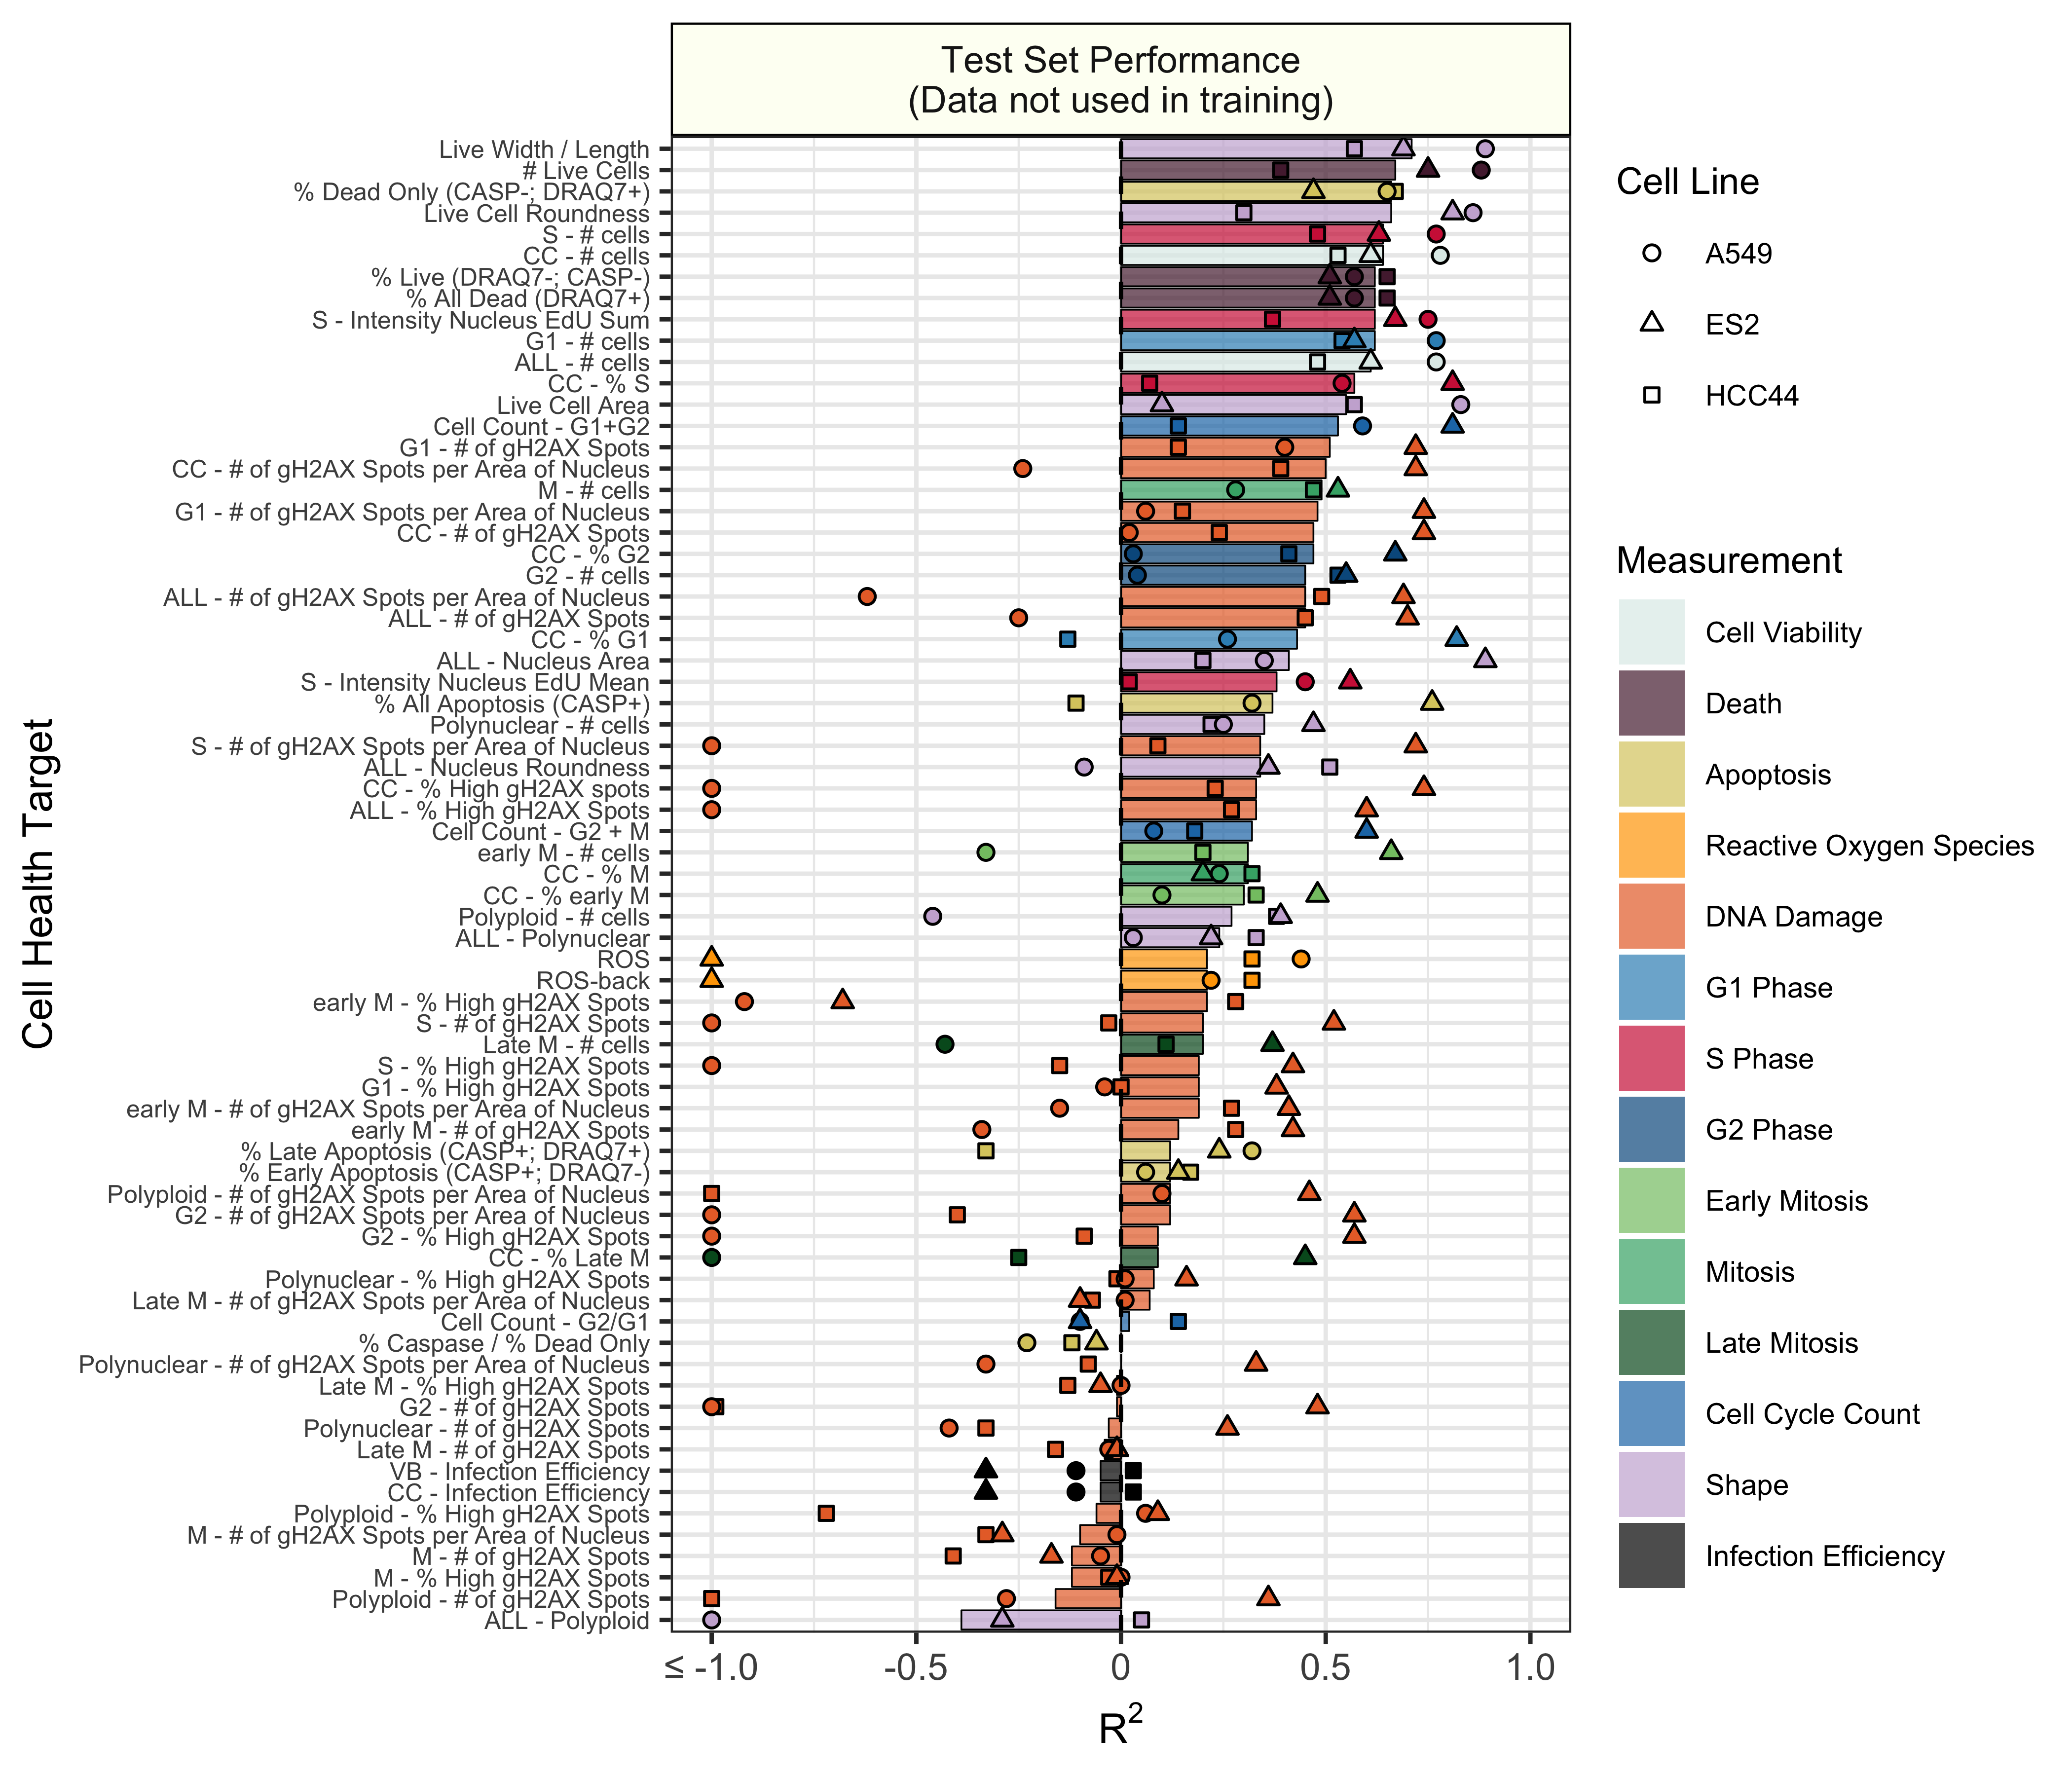
Test set model performance of predicting 70 cell health readouts with independent regression models. Performance for each phenotype is shown, sorted by decreasing R2 performance. The bars are colored based on the primary measurement metadata (see Supplementary Table S3), and they represent performance aggregated across the three cell lines. The points represent cell line specific performance. Points falling below -1 are truncated to -1 on the x axis. See 3.train for a full depiction.
Because we used a logistic regression classifier, we can readily interpret the output features. These features were derived from CellProfiler and represent different measurements of cell morphology. Shown above is a summary of coefficients from all 70 cell health models. We observed that each contribute to classifying various facets of cell health. Many different categories of cell morphology features contribute to cell health predictions.
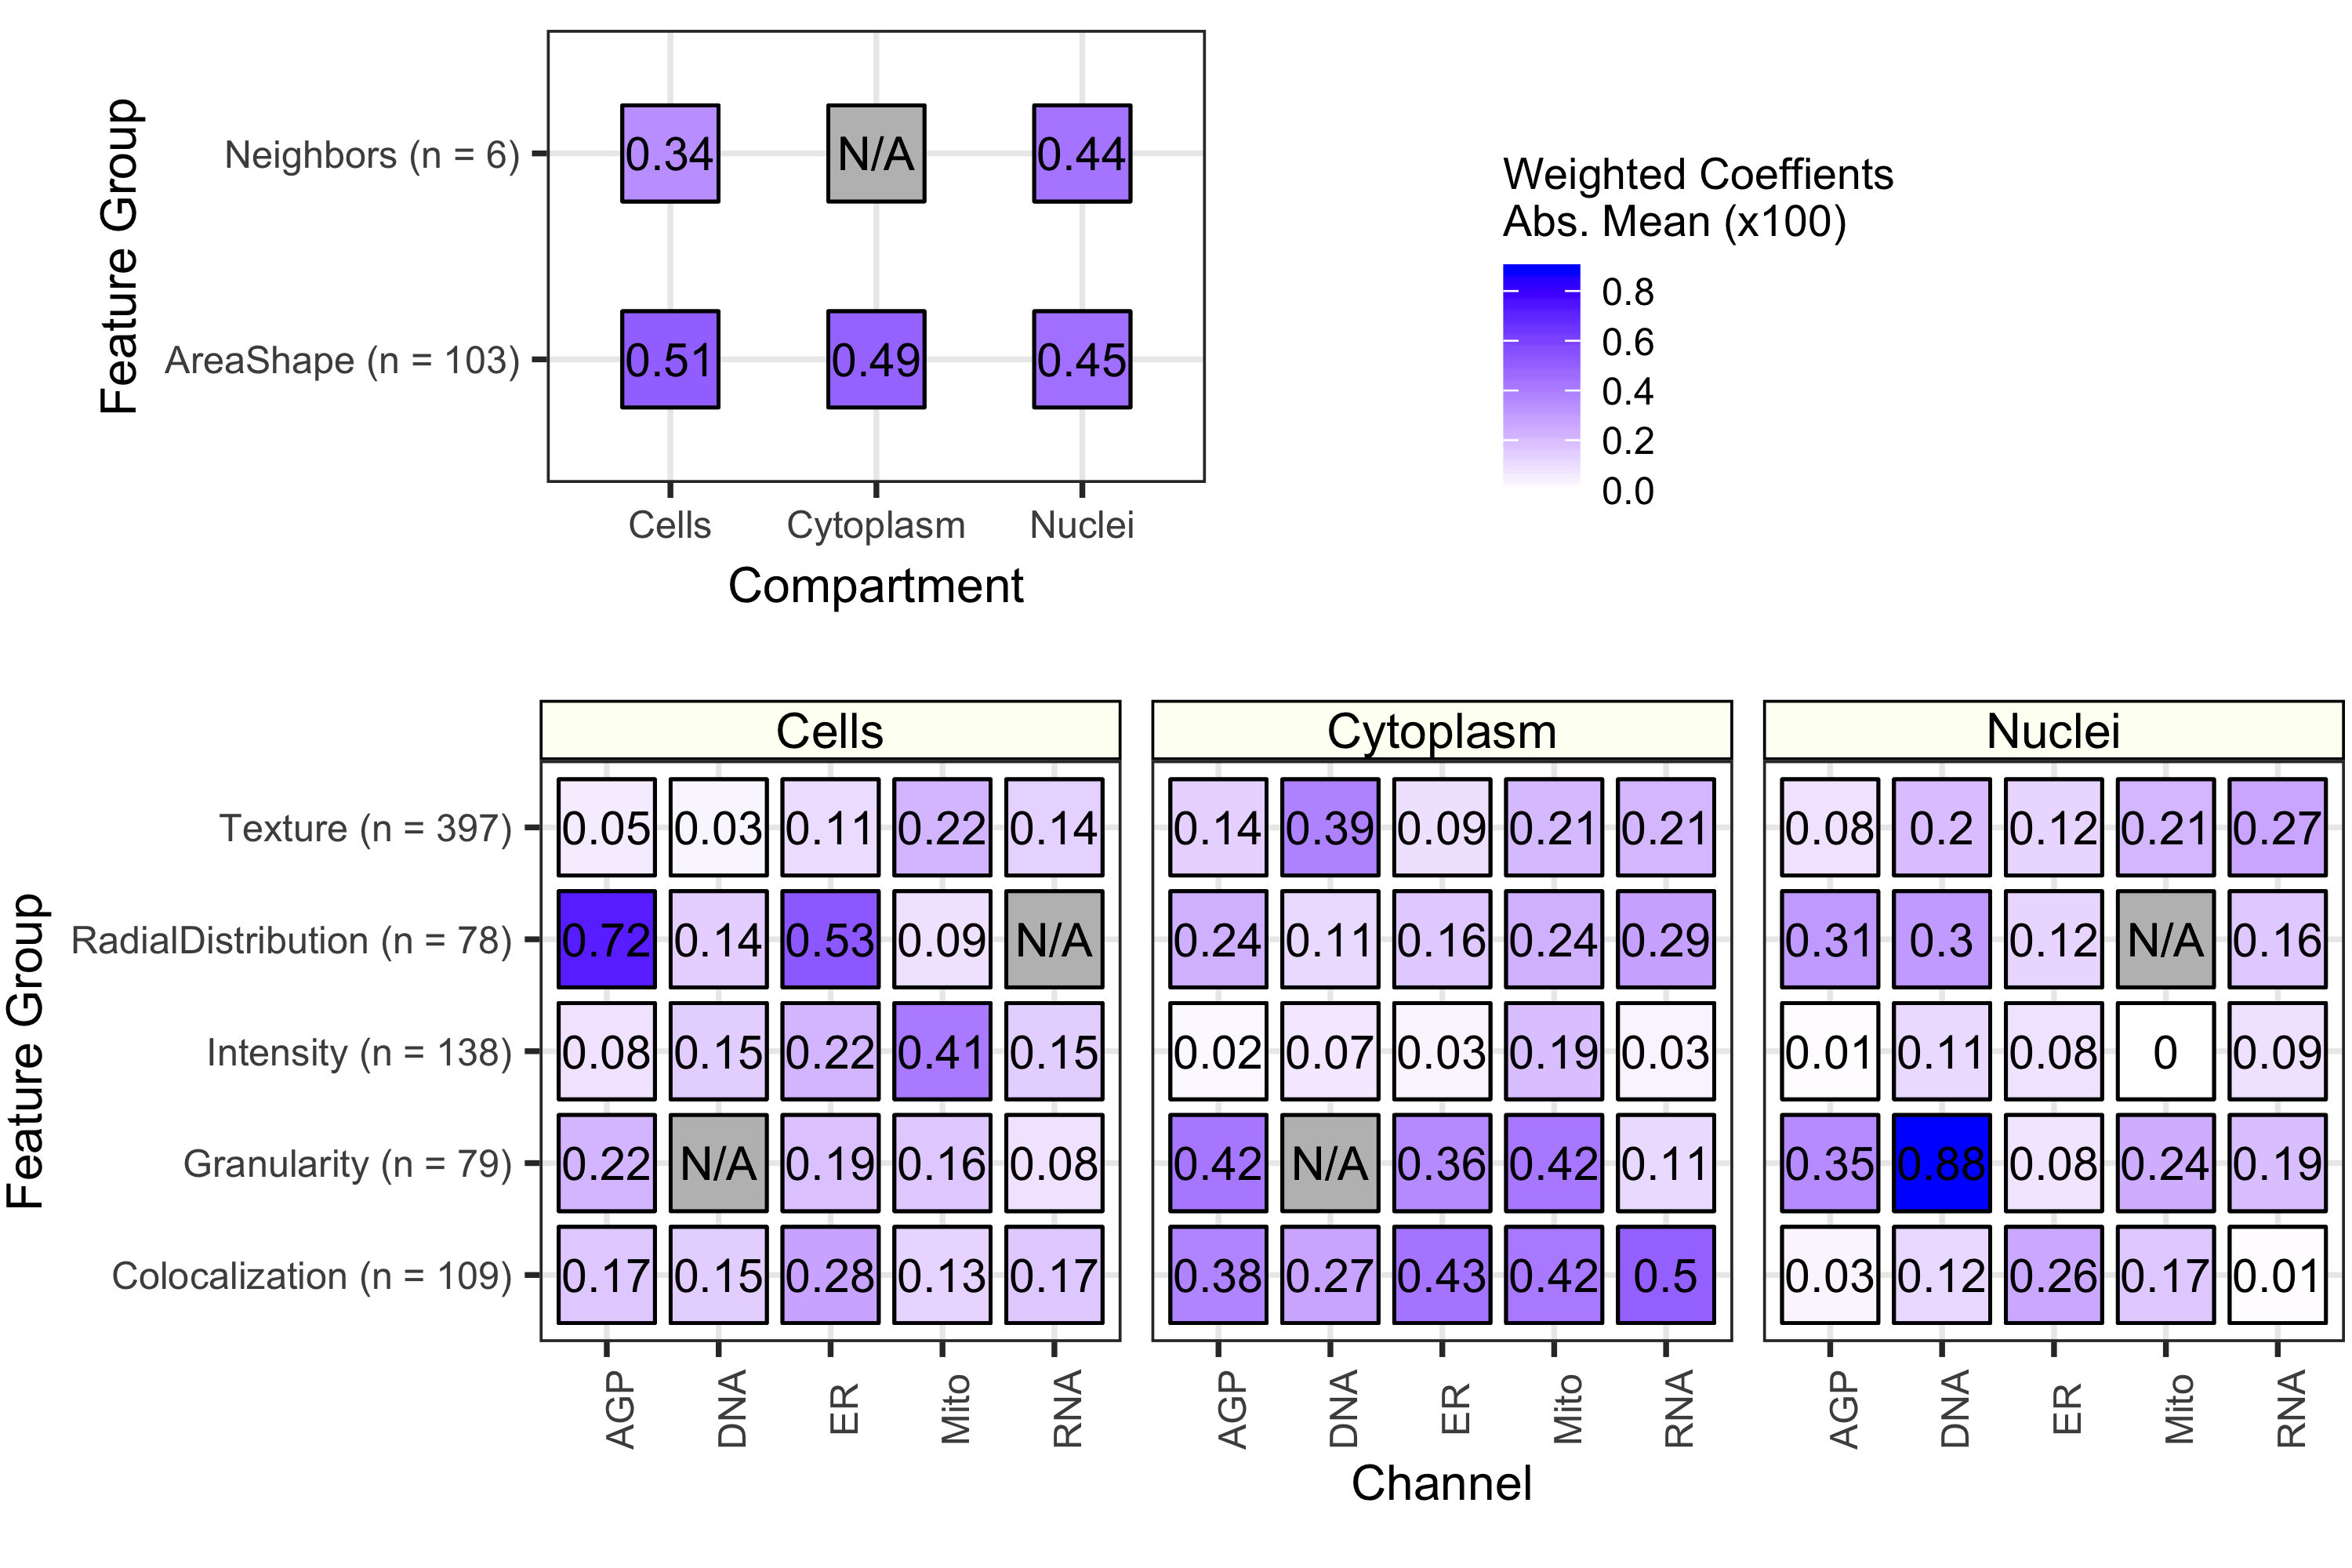
The importance of each class of Cell Painting features in predicting 70 cell health readouts. Each square represents the mean absolute value of model coefficients weighted by test set R2 across every model. The features are broken down by compartment (Cells, Cytoplasm, and Nuclei), channel (AGP, Nucleus, ER, Mito, Nucleolus/Cyto RNA), and feature group (AreaShape, Neighbors, Channel Colocalization, Texture, Radial Distribution, Intensity, and Granularity). For a complete description of all features, see the handbook: http://cellprofiler-manual.s3.amazonaws.com/CellProfiler-3.0.0/index.html Dark gray squares indicate “not applicable”, meaning either that there are no features in the class or the features did not survive an initial preprocessing step. Note that for improved visualization we multiplied the actual model coefficient value by 100.
We applied the trained models to Cell Painting data from the Drug Repurposing Hub (Corsello et al. 2017). These data represent ~1,500 compound perturbations in ~6 dose points in A549 cells.
Collapsing the Drug Repurposing Hub Cell Painting data into UMAP coordinates, we observed many associated Cell Health predictions. For example, predicted G1 Cell Count and predicted ROS had clear gradients in UMAP space. However, there is not exactly a 1-1 relationship. The proteasome inhibitors (DMSO and Bortezomib) are known to induce ROS, while PLK inhibitors are known to induce cell death by blocking mitosis entry. A single PLK inhibitor (HMN-214) showed a strong dose relationship with predicted G1 count.
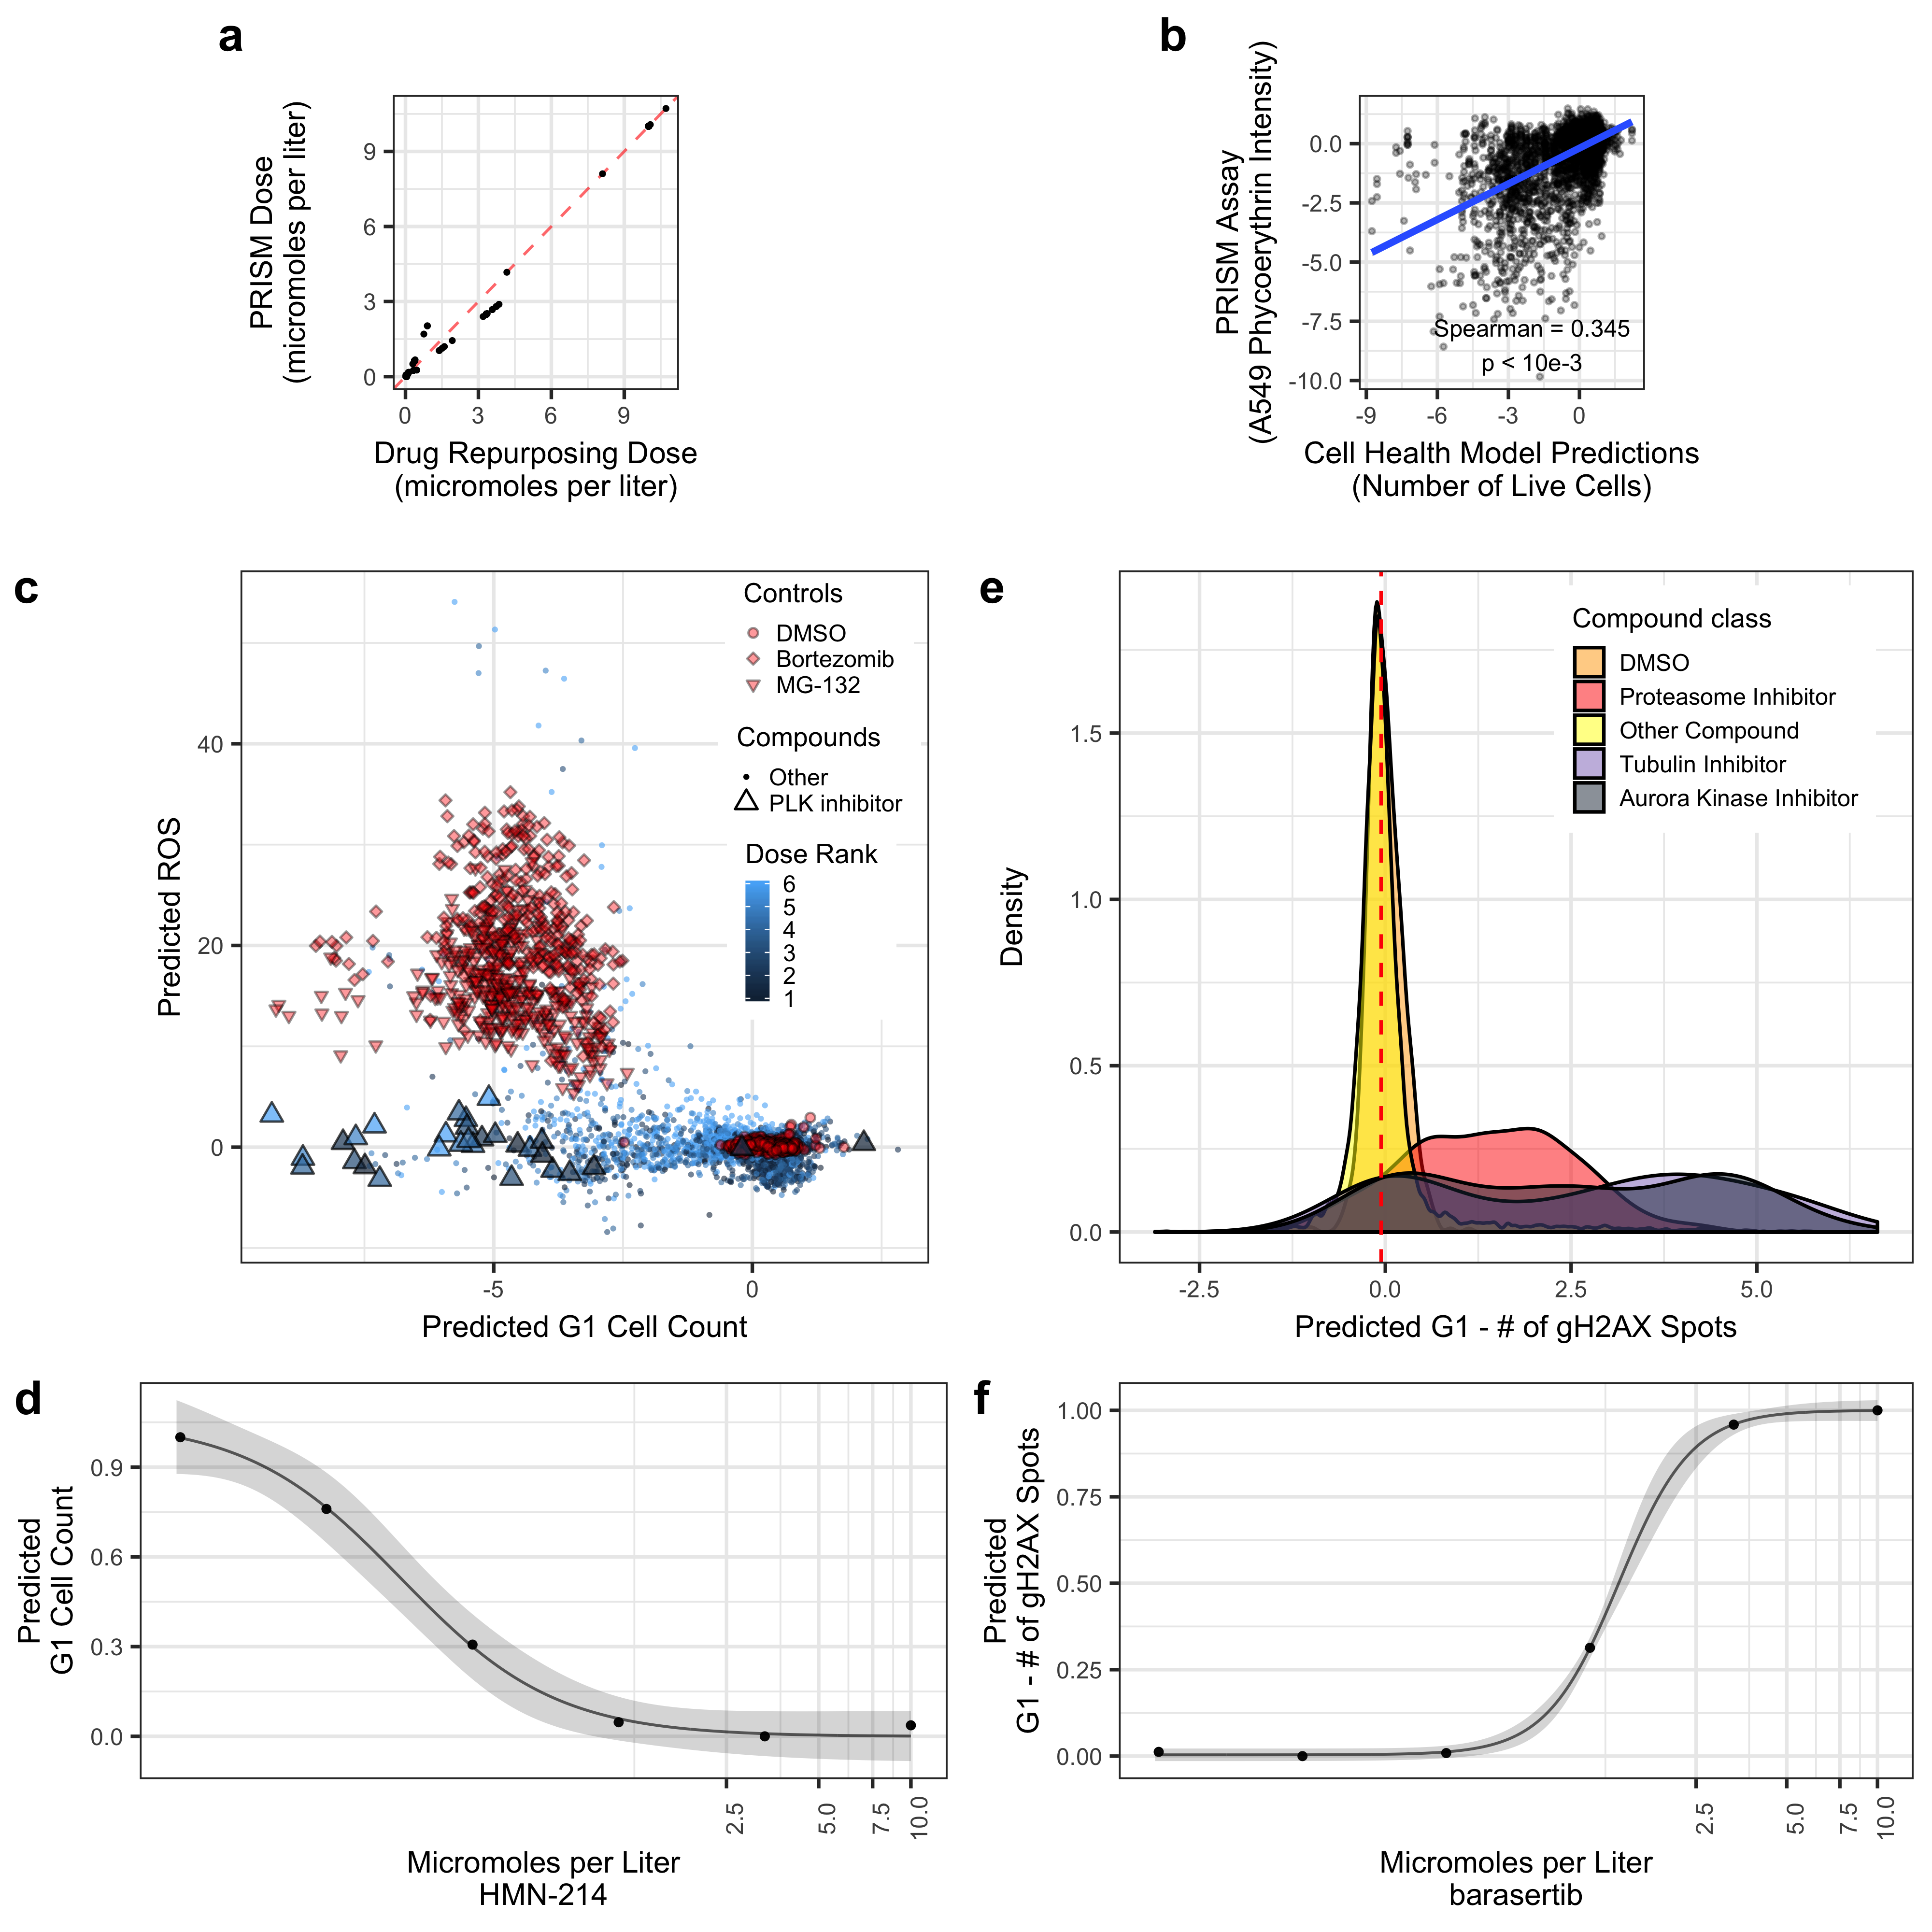
Validating Cell Health models to Cell Painting data from The Drug Repurposing Hub. (a) The results of the dose alignment between the PRISM assay and the Drug Repurposing Hub data. This view indicates that there was not a one-to-one matching between perturbation doses. (b) Comparing viability estimates from the PRISM assay to the predicted number of live cells in the Drug Repurposing Hub. The PRISM assay estimates viability by measuring barcoded A549 cells after an incubation period. (c) Drug Repurposing Hub profiles stratified by G1 cell count and ROS predictions. Bortezomib and MG-132 are proteasome inhibitors and are used as positive controls; DMSO is a negative control. We also highlight all PLK inhibitors in the dataset. (d) HMN-214 is an example of a PLK inhibitor that shows strong dose response for G1 cell count predictions. (e) Tubulin and aurora kinase inhibitors are predicted to have high Number of gH2AX spots in G1 cells compared to other compounds and controls. (f) Barasertib (AZD1152) is an aurora kinase inhibitor that is predicted to have a strong dose response for Number of gH2AX spots in G1 cells predictions.
We applied all predictions and present them in an easy-to-navigate webapp at https://broad.io/cell-health-app
If you use data, results, or insights from this repository, please consider citing our publication:
Gregory P. Way, Maria Kost-Alimova, Tsukasa Shibue, William F. Harrington, Stanley Gill, Federica Piccioni, Tim Becker, Hamdah Shafqat-Abbasi, William C. Hahn, Anne E. Carpenter, Francisca Vazquez, and Shantanu Singh. Predicting cell health phenotypes using image-based morphology profiling. Molecular Biology of the Cell 2021 32:9, 995-1005. DOI: https://doi.org/10.1091/mbc.E20-12-0784.
If you use the Cell Painting images, please also consider citing our public data set on IDR:
Gregory P. Way, Maria Kost-Alimova, Tsukasa Shibue, William F. Harrington, Stanley Gill, Federica Piccioni, Tim Becker, Hamdah Shafqat-Abbasi, William C. Hahn, Anne E. Carpenter, Francisca Vazquez, and Shantanu Singh. Cell health phenotypes can be predicted from unbiased image-based morphology readouts. Image Data Resource 2020, screen 2701:accession 0080. https://doi.org/10.17867/10000153.
If you use the single cell profiles of CellProfiler features, please also consider citing our public dataset on Figshare:
Gregory P. Way, Maria Kost-Alimova, Tsukasa Shibue, William F. Harrington, Stanley Gill, Federica Piccioni, Tim Becker et al. (2019): Cell Health - Cell Painting Single Cell Profiles. The NIH Figshare Archive. Dataset. https://doi.org/10.35092/yhjc.9995672.v5