Extra Features
There are a few "hidden" features that are not obviously available through the web interface, but are pretty powerful.
Any search result can be requested through the API interface, which lets you get results in JSON format. This makes it easy to build infrastructure around Anemometer. You might use it to build tools like:
- add an automated report that emails you when new or expensive queries are found in your live environment.
- add hooks into your continuous integration system or unit tests that can use digested query stats to flag potential problems and give reports back to developers.
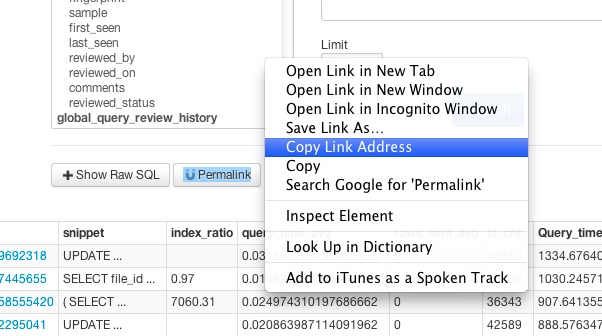
The easiest way to use the API is to customize a table report the way you want it. Set all the search parameters and make sure the results shown are those you want. Then edit the URL:
- Change action=report to action=api
- append &output=json to the end
This is a great feature to use in combination with relative dates, explained below.
When saving reports it's often needed that you don't want to see on specific time period like April 1st to April 5th, but you want to load the report and always show dates relative to the current time, such as "the last 7 days until now." This feature is supported, but it's not easily accesible via the search form.
All you have to do is modify the URL, and change the &dimension-ts_min_start= and &dimension-ts_min_end= properties. Valid values are defined by the Php Relative Date Format such as '-7 day' or 'last Thursday'.
For example you might use:
- &dimension-ts_min_start=-7+day&dimension-ts_min_end=now (last 7 days)
- &dimension-ts_min_start=last+Thursday&dimension-ts_min_end=now (Since last Thursday)
- &dimension-ts_min_start=first+day+of+-1+month&dimension-ts_min_end=last+day+of+-1+month (Last full month)
Pivot tables are used to turn columns into rows. This is useful in the case where you want to see a particular stat for a query, but see the value for each server it was collected from in your system. For example you might want to see if the number of occurrences (ts_cnt) is different on different hosts, and compare them easily.
This is currently used in the Graph Search, to show each host as a separate series, but it can be useful to look at the data in table form as well.
Take the URL for any table report, and append the following value:
- &dimension-pivot-hostname={column}
Where {column} is the value you want to see for each host. For example:
- &dimension-pivot-hostname=ts_cnt
- &dimension-pivot-hostname=query_time_avg