Home
Anemometer is a tool for visualizing collected data from the MySQL Slow Query Log. The name comes from the instrument in a weather station that measures wind speed. SQL queries are like the wind -- ephemeral and hard to get a hold of. Anemometer helps you get a handle on your queries; it makes it easier to figure out what to optimize and how to track performance over time.
Anemometer relies on the Percona Toolkit to do the slow query log collection. Specifically you can run pt-query-digest. To parse your slow logs and insert them into a database for reporting.
Ok, ok. Here's a quick tour of the app:
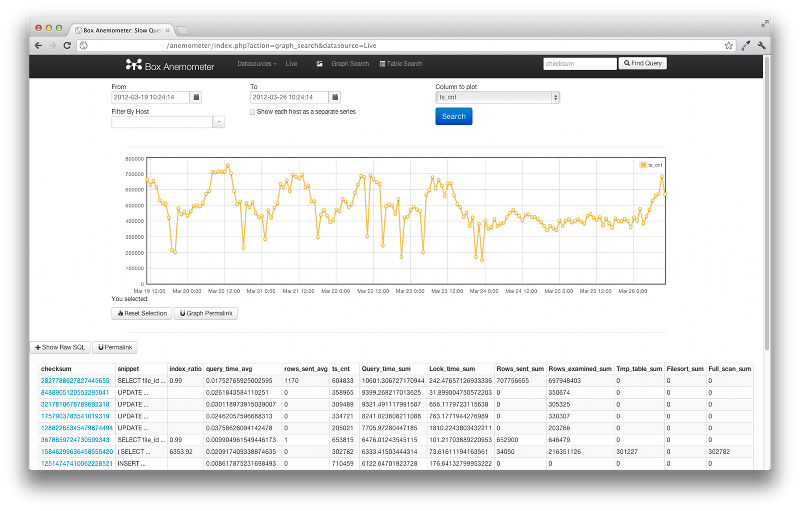
You can graph aggregate stats over time, and show the corresponding queries from that range. Then just click and drag to highlight a region and zoom in and the query results will automatically update. This lets you quickly find hotspots and drill down to see exactly what was happening at that time.
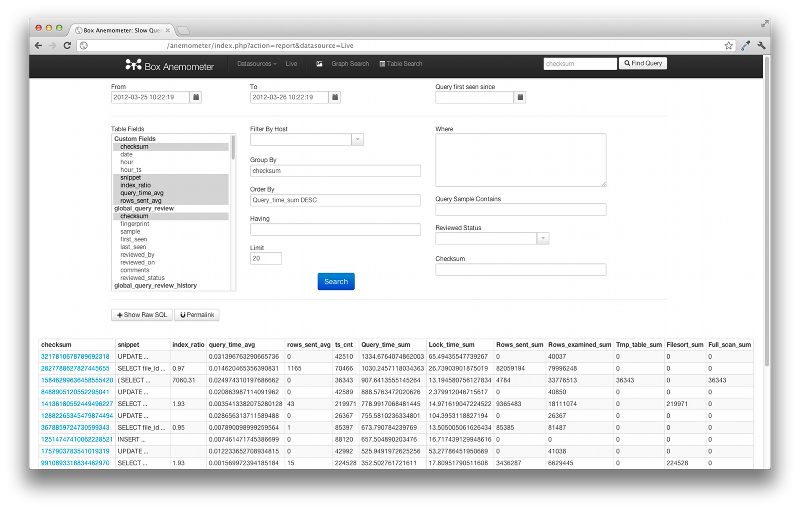
Dig in deeper detail by customizing the table report. Pick columns to show, change the sort order to quickly find the "worst offenders" by query time, index efficiency, temp table activity and more. Add custom fields, and custom query parameters, and even filter by the database host -- oh yeah, did we mention that Anemometer works great when collecting data from all your mysql servers? Monitor one or one hundred servers at once!
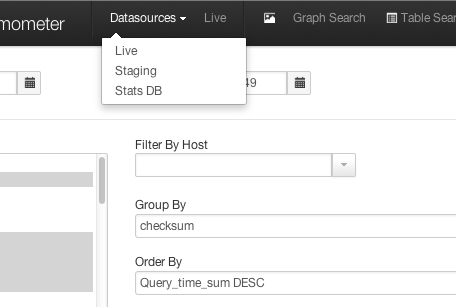
Add easily configurable datasources. You can separate reporting for your production and development environments, or create one-off digests with pt-query-digest and view them with Anemometer.
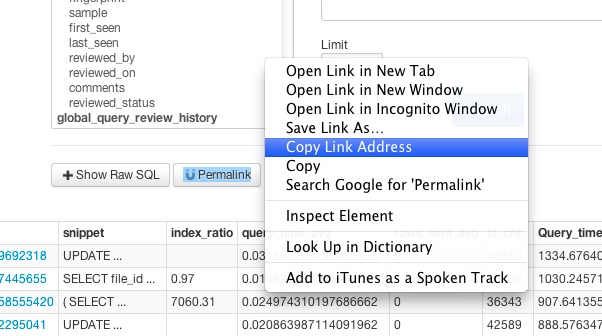
All forms use HTTP GET, which means sharing graphs and saving reports is super simple!
Just see the README in the project code for Quickstart Instructions
Check out the other pages of content we have. A select few are: