Image/Genome/Transcriptome Explorer
The purpose of ImageNomeR is to explore and identify important features and inter-subject relationships in regression and classification models.
- Background
- Requirements
- python, pip, numpy, scikit-learn, requests, flask, jupyter notebook, pytorch (optional)
- Installation
- Data
- Usage
- Components
- Results
- Team Members
Analyzing data often requires many repetitive change-run-plot cycles. Any feature identification leads to code edits to move on to the next step. We created a simple web interface to really speed up analysis work.
- Navigation is 100% by mouse.
- ImageNomeR is geared toward analysis of fMRI and omics data.
- It is not a new algorithm for prediction or feature detection, but an aid in analysis.
- We currently produce three types of interactive, interconnected charts along with annotations.
- The eventual goal is to have many types of plots and to link features with subjects.
Here are two examples of ImageNomeR being used to find features in an fMRI (top) and gene expression (bottom) dataset:


You should have the following software installed to use ImageNomeR: python, pip, numpy, scikit-learn, requests, flask, jupyter notebook, and pytorch (optional).
Currently the only way to install is via git. Run this command:
git clone https://github.com/u-brite/ImageNomeR.git
Then run
git submodule init
git submodule update
to get access to the LatSim model used in some notebooks.
We are working on a distributable pip package.
We used the following two datasets:
- https://openneuro.org/datasets/ds004144/versions/1.0.1 Fibromyalgia 2-task fMRI, 2 groups (17.9 GB)
- This dataset was used for fMRI.
- It contains lots of clinical and demographic data (no omics).
- https://www.ncbi.nlm.nih.gov/geo/query/acc.cgi?acc=GSE202295 Exercise, mRNA, type 2 diabetes (4 MB)
- This datset was used for omics.
- mRNA counts data from muscle biopsy and demographic data (no imaging).
For fMRI, we generated functional connectivity (FC) based on the Power atlas.
You can see an example of the Power regions of interest (ROIs) being used to extract signal at a given timepoint.
To load the data needed to run experiments, you must run the getdata.py script.
python getdata.py
The data will be located in the (newly created) data directory.
Once you have loaded the data, navigate back to the top ImageNomeR directory, and start the server:
python imagenomer/flask_backend/flask_backend.py 8000
Navigate to http://localhost:8000/ (note, no "s"). If the server is running but there are no analyses, you will see a screen like the following:
![]()
Our experiments are located in Jupyter notebooks. There are 4 experiments you can try:
- notebooks/fmri/fmri4LibWorkout.ipynb
- notebooks/fmri/fmri6WeighFeatCorrExperiments.ipynb
- notebooks/fmri/fmri7MLPExperiments.ipynb (requires pytorch, preferably with GPU acceleration)
- notebooks/omics/genecount2WandWFMultImageNomeR.ipynb
You must run jupyter notebook from the top ImageNomeR directory:
If the server is running, and you executed one or more experiments successfully, the page at http://localhost/ should now contain analyses:

The library formats user data into JSON and sends it to the server. The following line imports components from the ImageNomeR library:
from imagenomer import Analysis
Please take a look at the code for details on how to generate acceptable JSON.
This is a basic Flask server that coordinates communication between the web browser and the user's python code (which presumably generated results they want to examine). It contains the following endpoints:
- / - Main page, in templates/index.html
- /analyze - Analysis page, in templates/analyze.html
- /post - URL to push data from user code
- /data - URL for browser to send async requests to server
- /clear - Not implemented yet, to be used for reducing memory load by removing old analyses
The static/ directory contains js and css files for the frontend.
A simple web UI, using only the fetch and canvas APIs. Interoperability with the library and server requires paying attention to the JSON format. The front end is not able to make requests of the user code via the server (maybe in the future).
We attemped classification of normal controls versus female fibromyalgia sufferers with resting state and task (epr) functional connectivity from fMRI data, using Logistic Regression (LR) and MLP models. The results are as follows (averaged over 40 train/test splits):
| Accuracy | |
|---|---|
| LR | 0.64±0.09 |
| MLP | 0.51±0.10 |
| Sparse MLP | 0.56±0.11 |
The LR model was superior to both MLP models at the p < 1e-4 and p < 6e-4 significance levels.
We identified several consistently prominent connections:
- 'Temporal_Inf_L (aal)' to 'Fusiform_L (aal)' (UNK-UNK)
- 'Cerebelum_Crus1_R (aal)' to 'Cerebelum_Crus2_R (aal)' (DMN-UNK)
- 'Insula_R (aal)' to 'Cerebelum_Crus1_R (aal)' (UNK-UNK)
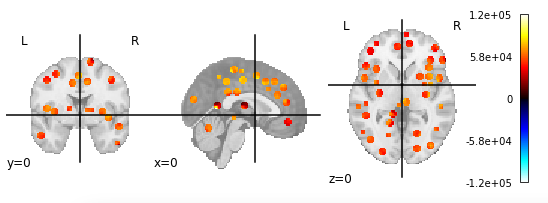
Additionally, the Default Mode Network (DMN) and Uncertain (UNK) network regions were greatly over-represented in the top few connections (20 total regions in the figure below).

We also attempted classification of normal glucose tolerant versus type 2 diabetic men, again with Logistic Regression. Most subjects had 3 timepoints: basal, post, and recovery. The results are as follows (averaged over 80 random train/test splits):
| basal | post | recovery | |
|---|---|---|---|
| LR | 0.52±0.16 | 0.60±0.16 | 0.57±0.16 |
We found a significant difference (p < 5e-4) between basal and post, but not a significant difference (p < 0.1) between post and recovery.
The following gene products appeared prominently in top features:
- NEB
- TTN
- MT-CO1
Two of these are muscle proteins, and a third is heavily involved in metabolism (also implicated in many diseases).
Anton Orlichenko | aorlichenko@tulane.edu | Team Leader
Jack Freeman | jackwfreeman@yahoo.com | Team Co-leader
Grant Daly | daly@southalabama.edu