.summary Reports
The summarizer generates a compact report in a format designed to be human-readable and computer-readable. A report describes alignments for one SRA dataset. This wiki page describes the nucleotide summary reports, but it is functionally similar for the RdRP translated nucleotide summary reports as well.

Input to the summarizer is SAM records generated by the bowtie2 read mapper. A SAM record describes an alignment of a read to a sequence in a reference database (the "mapping reference"). Bowtie2 reports either one or zero alignments for a read. If there are two or more equally good alignments, bowtie2 makes a choice at random. The --very-sensitive-local option of bowtie2 is used to maximize sensitivity, at the expense of generating many short, spurious alignments. We try to reduce these by masking problematic segments in the reference sequences ("black regions", in our jargon). The most common types of black region are poly-As and other low-complexity sequence.
The (nucleotide) mapping reference contains Coronavirus (Cov) plus, optionally, sequences from other RefSeq vertebrate viruses. The set of sequences for one family is called the "pan-genome" for that family. The combined sequences from all families is called the "mega-genome", or sometimes (misleadingly) just "the genome". The first line in the report is a comment line which includes our name for the mapping reference (cov3m in the example). An "m" suffix indicates a mega-genome with non-Cov families.
The pan-genome for a family may contain both full-length genomes and fragments. A fragment is anything less than a complete genome. For example, a complete CDS is a fragment as far as the summarizer is concerned. For Coronavirus, we include all Genbank sequences which are verified as belonging to the family by nt or a.a. alignment to a full-length Cov reference. These sequences are clustered at 99% to reduce redundancy. For non-Cov families, we currently only include Refseq sequences because these are curated, while for Cov we want to include as many as possible to increase sensitivity.
Coverage is measured by dividing a reference sequence into 25 equal bins and depicted as an ASCII text string of 25 symbols, one per bin; for example oaooomoUU:oWWUUWOWamWAAUW. Each symbol represents log2(n + 1), where n is the number of reads aligned to a bin in this order _.:uwaomUWAOM^. Thus, ‘_’ indicates no reads, ‘.’ exactly one read, ‘:’ two reads, ‘u’ 3–4 reads, ‘w’ 5–7 reads and so on; ‘^’ represents >2^13 = 8,192 reads in the bin. For a pangenome, alignments to its reference sequences are projected onto a corresponding set of 25 bins. For a complete genome, the projected pangenome bin number 1, 2, …, 25 is the same as the reference sequence bin number.
The coverage fraction (cvgpct) of a family is the fraction of bins which have at least one read. For example, if cvgpct=92% then 23/25 of the bins have a read and 2/25 = 8% are empty.
At the end of the report there is a section in FASTA format which captures read sequences assigned to Cov (>Cov.1, >Cov.2...) and non-Cov families (>Other.1, >Other.2...). For each bin 1 .. 25, the sequence of the first good read is captured. At the time of writing, "good" is defined as an alignment with no indels as a heuristic for selecting an alignment which is likely to be valid. I've found this to be useful as a quick sanity check -- I copy/paste the sequences and BLAST them at NCBI and check if they primarily hit viruses in the Taxonomy tab.
The Summarizer implements a binary classifier predicting the presence or absence of each virus family in the query on the basis of pangenome-aligned short reads. For a given family F, the classifier reports a score in the range [0,100] with the goal of assigning a high score to a dataset if it contains F and a low score if it does not. Setting a threshold on the score divides datasets into disjoint subsets representing predicted positive and negative detections of family F. The choice of threshold implies a trade-off between false positives and false negatives. Sorting by decreasing score ranks datasets in decreasing order of confidence that F is present in the reads.
Naively, a natural measure of the presence of a virus family is the number of alignments to its reference sequences. However, alignments may be induced by non-homologous sequence similarity, for example low-complexity sequence.
The score for a family was therefore designed to reflect the overall coverage of a pangenome because coverage across all or most of a pangenome is more likely to reflect true homology; that is, the presence of a related virus. Ideally, coverage would be measured individually for each base in the reference sequence, but this could add undesirable overhead in compute time and memory for a process that is executed in the Linux alignment pipe (FASTQ decompression → aligner → Summarizer → alignment file compression). Coverage was therefore measured by binning as described above, which can be implemented with minimal overhead.
A virus that is present in the reads with coverage too low to enable an assembly may have less practical value than an assembled genome. Also, genomes with lower identity to previously known sequences will tend to contain more novel biological information than genomes with high identity but highly diverged genomes will tend to have fewer aligned reads. With these considerations in mind, the classifier was designed to give higher scores when coverage is high, read depth is high and/or identity is low. This was accomplished as follows. Let H be the number of bins with at least 8 alignments to F, and L be the number of bins with from 1 to 7 alignments. Let S be the mean alignment percentage identity, and define the identity weight w = (S/100)−3, which is designed to give higher weight to lower identities, noting that w is close to 1 when identity is close to 100% and increases rapidly at lower identities. The classification score for family F is calculated as ZF = max(w(4H + L)),100). By construction, ZF has a maximum of 100 when coverage is consistently high across a pangenome, and is also high when identity is low and coverage is moderate, which may reflect high read depth but many false negative alignments due to low identity. Thus, ZF is greater than zero when there is at least one alignment to F and assigns higher scores to SRA datasets that are more likely to support successful assembly of a virus belonging to F.
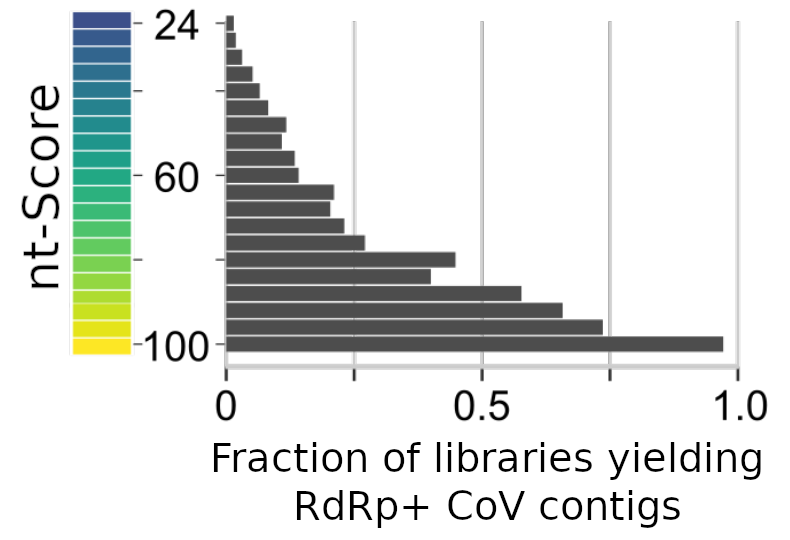
For the nucleotide-genome search, all Coronaviridae+ libraries (~50,000) with score >24 were de novo assembled. Plot shows the subsequent recovery of a CoV RdRp+ contig from the target library based on score. Note, assembly is a "high bar" for predicting presence/absence of a virus, see also the Camaroon Gut Virome Case Study.
acc=NC_028105.1 Refseq or Genbank accession of the reference sequence.
pctid=83.1 Average identity of the alignments. Note that this may be lower than the true average identity due to sequencing/alignment error.
aln=54 Number of bowtie2/diamond alignments.
glb=20 Number of global alignments (no soft-clipping).
cvgpct=50 For a reference sequence, coverage percent (fraction of bins with at least one read).
score=50 For a pan-genome, coverage percent (fraction of bins with at least one read).
len=28009 Reference sequence length.
depth=20 Average depth. Misleading if most bins are empty.
top=NC_038500.1 For a pan-genome, the reference sequence with most hits.