Debug SSC in Windows using VS 2017 and SDKtool
The SAM Software Development Kit is a set of developer tools for interfacing with SSC. The SAM SDK comes with an application called SDKtool that you can use to explore SSC compute modules and write test programs in its built-in LK scripting language. It is described in the SSC Guide, which you can download from the SAM SDK web page.
The following instructions explain how to use SAM, SDKtool, and Microsoft Visual Studio 2017 Community (VS 2017) to debug SSC C++ code in Windows.
Step 1. Use SAM to generate LK for SDKtool.
Step 2. Set breakpoints in VS 2017.
Step 3. Run the LK script in SDKtool.
Step 4. Trace through the C++ code in VS 2017.
-
Download and install the latest version of the SAM desktop application.
-
Build debug versions of LK, WEX, and SSC, in that order.
-
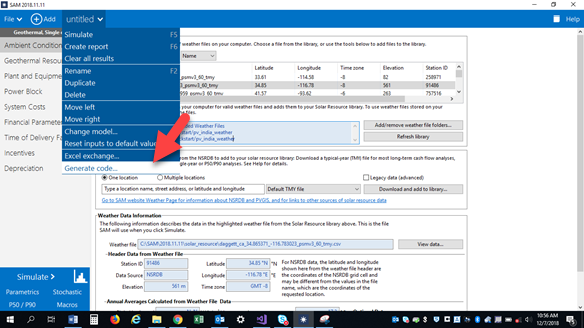
Start SAM, and either create or open a file that uses the compute module you want to debug. For this example, we are debugging the geothermal compute module, so we generated code from a Geothermal/No Financial Model case in SAM.
-
On the Case menu, click Generate Code.
-
Choose LK for SDKtool and click OK. SAM saves an LK script file
.lkalong with several supporting files. The LK file name is the same as the case name, which by default is “untitled.”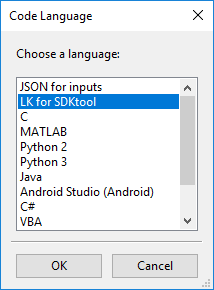
-
Start VS 2017 and open the solution file
ssc_vs2017.sln,for example.../ssc/build_vs2017/ssc_vs2017.sln. -
Set
sdktoolas the start-up project: Right-click sdktool in the Solution Explorer and click Set as StartUp Project. -
Open the C++ file for the compute module to debug. You can do this from the Solution Explorer, by expanding the
ssclist, and choosing the file to debug. Compute module names are preceded bycmod_. For this example, to debug the geothermal compute module, we chose thecmod_geothermal.cppfile.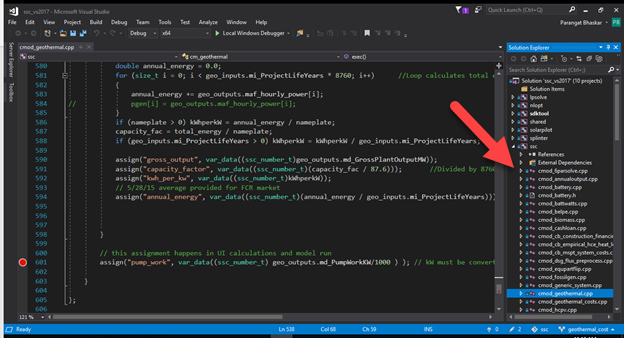
-
Set a breakpoint in the code.
-
Choose Debug and start the Windows debugger, which should run
/build_vs2017/x64/Debug/sdktool.exe.
-
When SDKtool opens, click Choose SSC library to load the SSC debug library
sscd.dll, for example…/ssc/build_vs2017/x64/Debug/sscd.dll. Be sure to load the same library as the one being used by the VS 2017 debugger. After you load the library, you can see the library path and version number at the bottom of the SDKtool window.
-
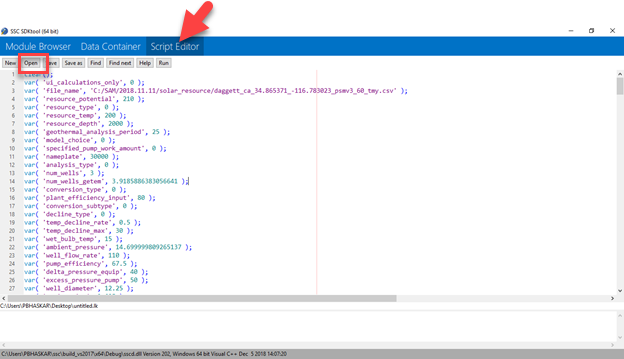
In the SDKtool Script Editor, open the LK file you created from SAM’s Code Generator in Step 1 above.
-
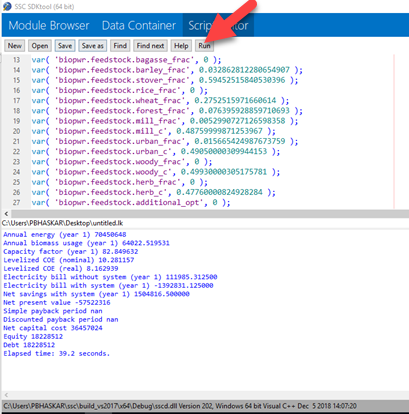
Click Run.
-
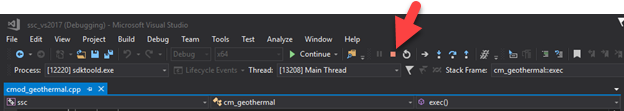
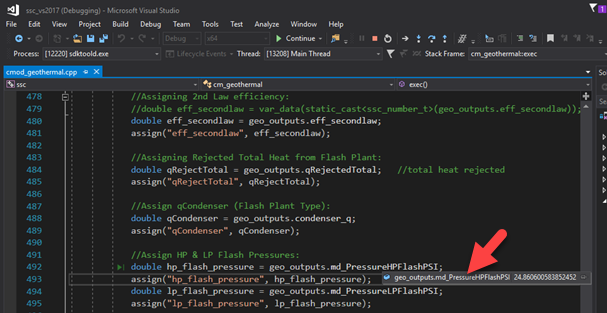
If you set a breakpoint in Step 2 above, the VS 2017 window will appear. Use your mouse to hover over any variable in the code to see its current value.
-
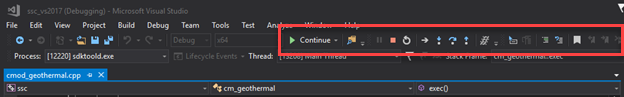
For other debugging tools, right-click a line in the code,
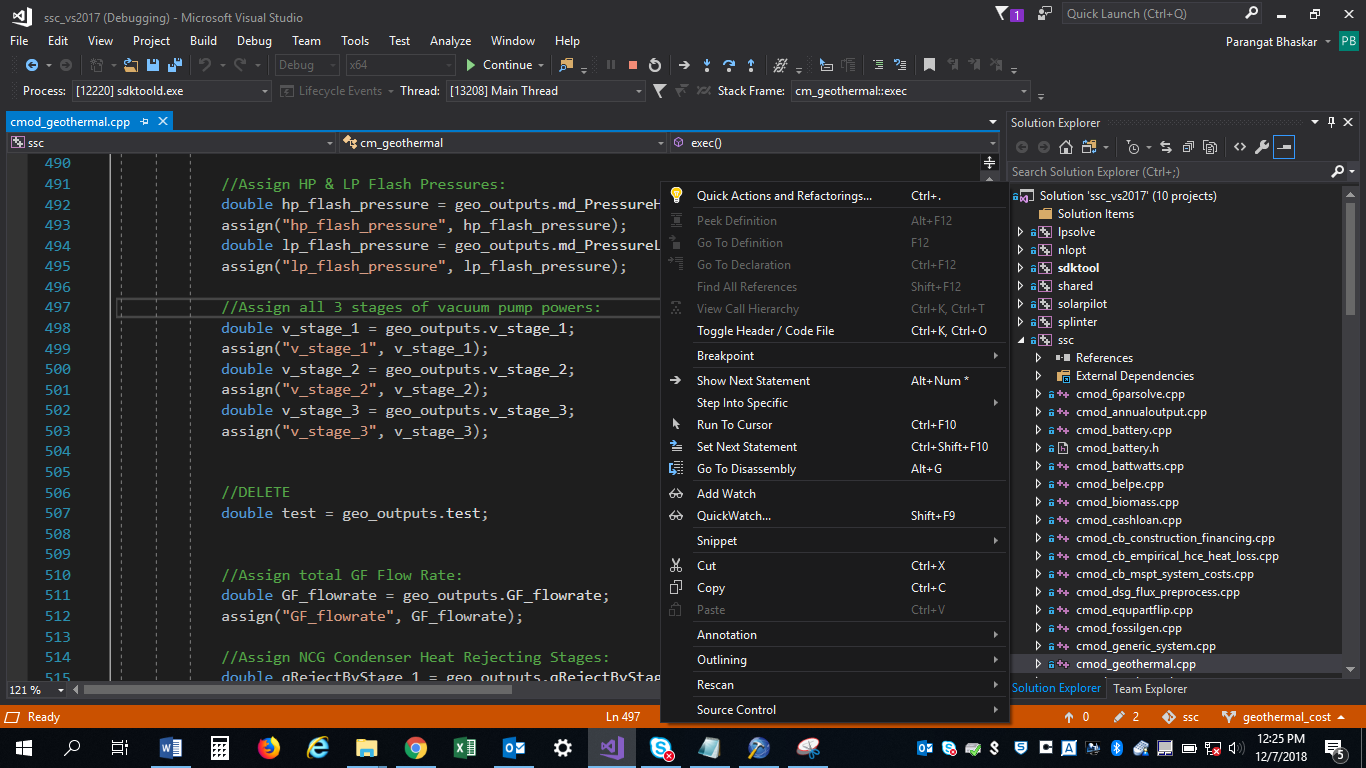
or use the buttons in the toolbar.
-
To end the debugging session, close SDKtool or click Stop in VS2017.