Visualize genome-wide RNA-Seq data
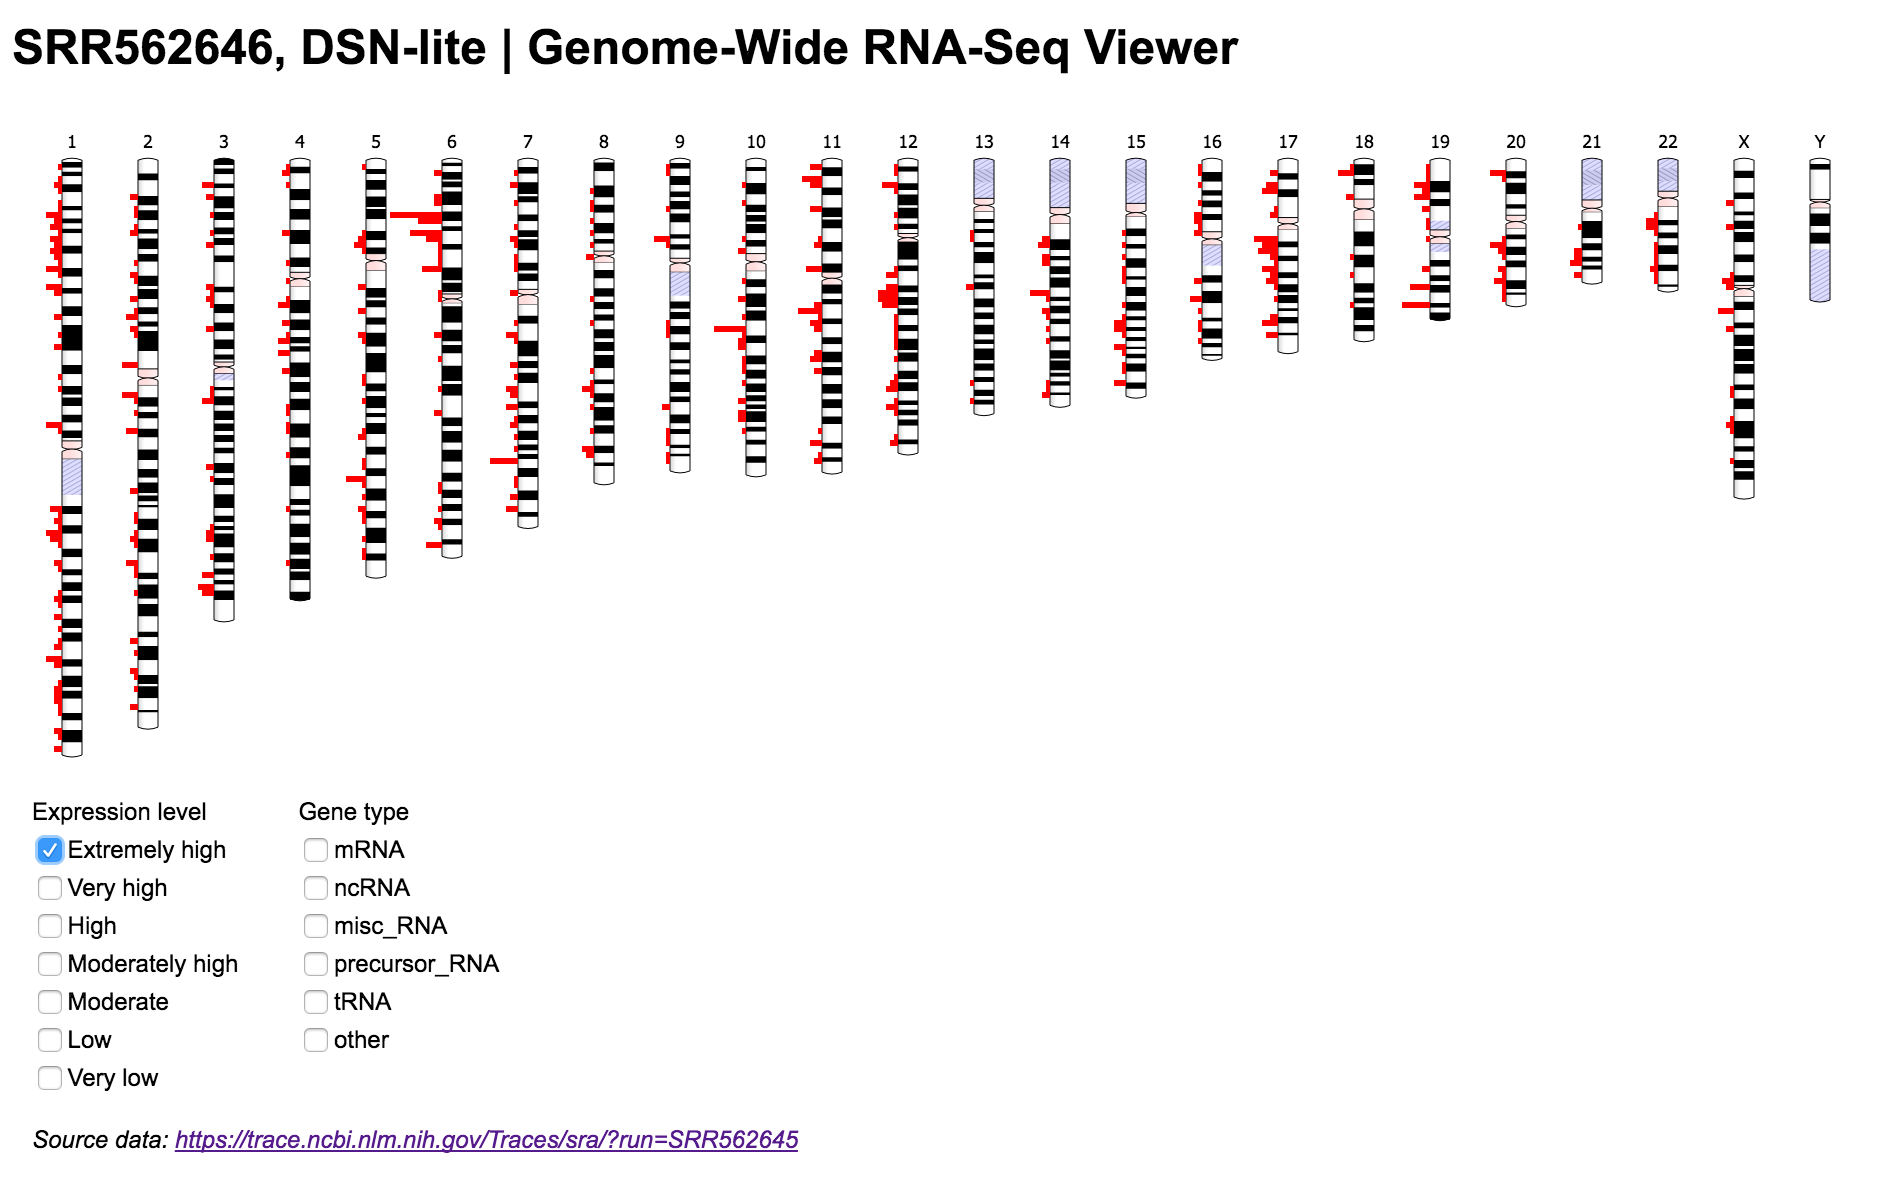
The Genome-Wide RNA-Seq Viewer is a web application that enables users to visualize genome-wide expression data from NCBI's Sequence Read Archive (SRA) and Gene Expression Omnibus (GEO) databases.
This repository contains a data pipeline written in Python. It extracts aligned RNA-Seq data from SRA or GEO and transforms it into a format used by Ideogram.js, a JavaScript library for chromosome visualization. The minimal front-end allows users to see the distribution of genes across the entire human genome, and filter them by expression levels in the SRA/GEO sample or gene type.
Broadly, the pipeline does the following:
- Get data for an SRR accession from NCBI SRA
- Count reads for each gene and normalize expression values to TPM units
- Get coordinates and type for each gene from a GFF file in the NCBI Homo sapiens Annotation Release
- Format coordinates and TPM values for each gene into JSON used by Ideogram.js
Read counter/deps.txt to know the tools needed to run. You can install all of them from the bioconda channel if you have an enviroment running.
An easy way to install conda:
  wget http://repo.continuum.io/miniconda/Miniconda-latest-Linux-x86_64.sh
  bash Miniconda-latest-Linux-x86_64.sh -b -p ~/install
First, cd counter.
counter.py script gets gene expression stored in NCBI's SRA database.
Run python counter.py to show information on how to use the script. It accepts SAM/BAM files or SRA accession numbers like SRR562646.
python $PATH/counter.py --inp SRR562645 --out SRR562645_counts
This will connect to NCBI and gets the genome reference used for the alignment. In case there is no alignment information, it will stop. It will download the gene annotation from NCBI; only GRCh37 and GRCh38 are supported right now.
You can use it like so:
python $PATH/counter.py --inp SRR562645.bam --out SRR562645_counts --gtf GTF_file
and it will use the given GTF to create the count data. GTF needs to have ID and gene in the attributes field.
counter.py creates 2 outputs:
*.tsv: with absolute read counts per gene*_norm.tsv: with counts/kb per gene (TPM)
Run the formatter.py script which converts the output from the Counter to JSON format. Example
formatter.py --type srr --lookup gene_lookup_GRCh37.tsv --inp SRR562645_counts_norm.tsv --out SRR562645.json
After running the steps above, you can plug the JSON data into Ideogram.js to view and filter RNA-Seq data on the entire human genome.