
A linked app with arduino and android for measure air Quality with a MQ135 sensor
The MQ135 is a cheap air Quality sensor used for measure of different gases, like alcohol, carbon monoxide and carbon dioxide, after doing some research and using the info provided by Davide Gironi, the way to measure ppm of gases according datasheet is this:
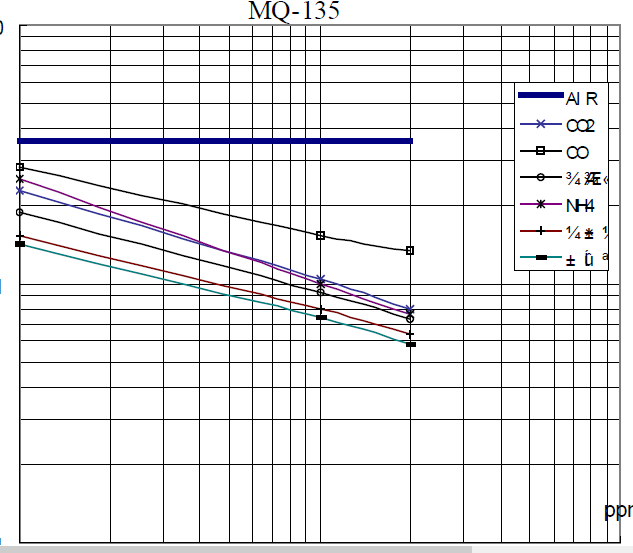
The graphic above shows a exponential function for each gas, then the x axes starts in 10 ppm and ends in 1000 ppm and the y axes starts in 0.1 and ends in 10 which it is basically the measured resistance from the analog output of the sensor and the resistance zero (rs/ro), provided by data sheet. We need some engineering knowledge for properly read the graphic. If you need more info about this, take a look to wikipedia link(log-log scale).
Then we need the slope from each function, for that, we can measure the start and end points digitally with a very util tool: WebPlotDigitizer http://arohatgi.info/WebPlotDigitizer/app/, only download the log graphic above, upload to WPD tell to it where x and y axes starts-end and putting log scale in the checkbox..
The values obtained by me are:
AIR (10, 3.58),(200, 3.58)
CO (10, 2.8351) ,(200,1.3464)
CO2 (10, 2.3),(200,0.8)
ETHANOL (10, 1.90),(200,0.73)
NH4 (10,2.55),(200,0.765)
TOLUENE (10, 1.54),(200, 0.64)
ACETONE (10, 1.44), (200,0.583)
And for sure you´re asking, How he knew it was ethanol, toluene and acetone from the poor description by the data sheet? And the answer is the translation, because the origin of the sensor is china, and there speak chinese and real mq135 datasheet comes in that language, then I used google digital translator for see what that symbols really are. The weirds symbols are:

back to the calculus, the first formula to calculate the slope is m=(y2-y1)/(x2-x1) but we are in log scale then the formula with logarithmic laws comes from m = (log y2 - log y1) / (logx2 - logx1) to m = log (y2/y1) / log (x2/x1) then we need this formula:

The formula says if you previously read wikipedia info than f(x) = (y1 / x1^m) * x^m where we already calculate the slope (m). For example, we going to calculate the function for CO2, we have the points measured by WPD
CO2 (10, 2.3),(200,0.8)
Where
x1 = 10 x2 = 200 y1 = 2.3 y2 = 0.8
m = log(0.8/2.3) / log(200/10) = -0.4586/1.3010 = -0.3525
and the function is y = [2.3/10^(-0.3525)] * x ^ (-0.3525) = 5.0152 * x ^(-0.3525)
y is our final function buuut, respect to x, we need respect to y , because y is (rs/ro) and we need x(ppm)
clearing the equation (I'd recomend wolfram) the final function is...
voila! the aproximate form an final formula is
x = 96.9691 * y^(-2.83688) or ppm = 96.9691 * (rs/ro)^-2.83688
comparing with the Davide Gironi equation, the scale factor is different
ppm = 116.6020682 (Rs/Ro)^-2.769034857
all depends of measured slope
I measured the points manually on the plot with WPD, and I compared them with my calculated function (with matlab and plotly) and this is the result:
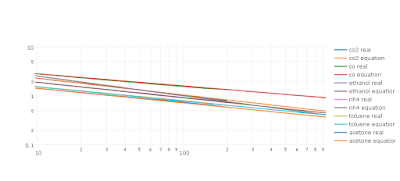
Plotly link https://plot.ly/~zesters/0/co2-real-co2-equation-co-real-co-equation-ethanol-real-ethanol-equation-nh4-real/
Where blue is the real graphic from datasheet and orange is the equation. The conclusion is: You not need power regression for this, you only need slope and the log formula.
With respective rs and ro calculated from the Georgk Library you can measure all gases.
My formulas to calculate all datasheet gases are:
CO2: ppm = 114.3544 * (rs/ro)^-2.93599
CO ppm = 662.9382 * (rs/ro)^-4.0241
Ethanol ppm = 75.3103 * (rs/ro)^-3.1456
Ammonium NH4 ppm = 102.694 * (rs/ro)^-2.48818
Toluene ppm = 43.7748 * (rs/ro)^-3.42936
Acetone ppm = 33.1197 * (rs/ro)^-3.36587
Comparing with Empierre Values float CO2Curve[2] = {113.7105289, -3.019713765}; //MQ135 float CO_secCurve[2] = {726.7809737, -4.040111669}; //MQ135 float NH4Curve[2] = {84.07117895, -4.41107687}; //MQ135 float C2H50H_Curve[2] = {74.77989144, 3.010328075}; //MQ135 float CH3Curve[2] = {47.01770503, -3.281901967}; //MQ135 float CH3_2COCurve[2] = {7.010800878, -2.122018939}; //MQ135
And this is the resources where Im taking all info and knowledge Arduino MQ135 Library George Krocker https://github.com/GeorgK/MQ135 Davide Gironi MQ135 Post Empierre Research MQ135 and others Sensors Empierre Sketch Air Quality Multiple Gas Sensor Arduino
If you have questions please ask to me!