https://dl.acm.org/doi/10.1145/3469678.3469715
N6-methyladenosine (m6A) is the most prevalent internal chemical modification present in multiple eukaryotic mRNAs, which is dynamically installed by methyltransferases (“writers”) and removed by demethylases (“erasers”). METTL3 and METTL14 are two typical m6A writers and several studies have found that knockdown or depletion of METTL3 and METTL14 genes influence the methylation level. A meta-analysis study was performed to assess the strength and quality of current evidence regarding to it and assess the how the knockdown of METTL3 or METTL14 affect the mRNA methylation level. Data was collected and classified into groups. Metafor, a R package was used to generate the Random-effects meta-analysis model and calculate the risk ratios (RRs) and 95% CIs. Since the heterogeneity of the overall data is extremely high (I2 > 99%), specific samples were excluded to minimize the downgrade the heterogeneity to acceptable level. Three and two published trails for METTL3 and METTLE14 samples, respectively, were eligible for review and analysis due to the acceptable low heterogeneity of their combination (METTL3 (Q = 12.85, I2 = 37.8%) and METTL14 (Q = 45.48, I2 = 82.9%) ). The positive relationship between knockdown of METTL3/METTL14 and methylation level was successfully verified and the difference among cell lines and gene types was identified.
The full script was in final file. But due to the size limitation, I could not upload the data set, please email me if you need the data set
For this systematic review and meta-analysis, our discovery data cohort came from various databases including Cochrane library, EMBASE, and PubMed/MEDLINE from inception to Feb 20, 2020. Seventeen datasets of epitranscriptome-wide homo sapiens m6A sites under different cell lines screened by six different high-resolution profiling approaches were collected. Missing and ambiguous data were further ensured and validated by the original researchers (Figure 1).

Figure 1: PRISMA flowchart for inclusion or exclusion criteria in this meta-analysis We firstly retrieved our data (n=1555) from both GEO and GSA database. In this analysis, the primary focus was on Homo sapiens, we then exclude other unrelated species, like Mus musculus and Rattus norvegicus, our sample then restricted to 242. When explored in the full-text articles, we did not consider genes other than METTL3 or METTL14, therefore, genes like FTO, ALKBH5 and WTAP were excluded, and sample number was retained to 28. Owing to the fact that some experiments shared the same control group, we then eliminated the duplication and 17 samples remained. The remained samples were used to conduct the whole meta-analysis.

Figure 2. Forest plot of the basic model. This is a Random Effect model which accommodates differences in study sample. Q statistic is based on the chi-square distribution, most commonly testing heterogeneity. I2 index is the total variability in a set of effect sizes due to true heterogeneity. Log Risk Ratio is a measurement of effect size.

Figure 3. The Baujat plot to identify studies contributing to heterogeneity. The study ID numbers represent eight studies, respectively.
As shown in Figure 3, Baujat plot generated from the METTL3 study datasets identifies the influence on the overall result and the squared Pearson Residual of each study. As the 8th study is located in the top right quadrant, it has both a greater impact on the whole result and contributes most to heterogeneity; while other studies are near to the origin. Therefore, we keep all studies but the one far away on the top right. Similarly, we excluded the 4th study as it lies far top right in the Baujat plot of METTL14

Figure 4. Forest plot of moderator analysis.
As shown in Figure 4, we can still conclude that there is a highly positive relationship (Log RR 5.66, 95% CI 5.31-6.02; p-value = 0.12) between the m6A methylation level and the knockdown of the METTL3 gene, although the p-value increases from <0.01 to 0.12 meaning less confidence. The Log RR is adjusted from 6.93 to 5.66. The CI narrows down greatly and CI of each subgroup overlaps more than the basic model, reflecting less between-study variability. As for the METTL14 model, the positive relationship (Log RR 5.39, 95% CI 4.97-5.84; p-value < 0.01) between the m6A methylation level and the absence of METTL14 gene shows similar Log RR with that of METTL3 meta-regression model. Importantly, we found no large heterogeneity or inconsistency of METTL 3 (Q(df = 8) = 12.85, I2 = 37.8%, tau2 = 0.0035) and METTL14 (Q(df = 9) = 45.48, I2= 82.9%, tau2 = 0.0140) among the studies.
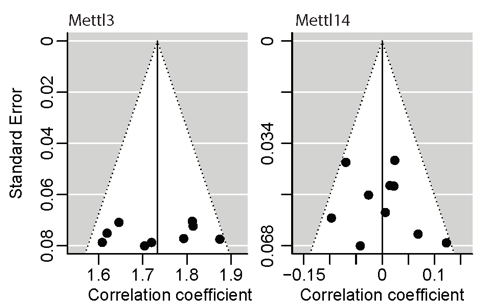
Figure 5. The Funnel plot.
Publication bias, occurring in the selective publication of studies based on magnitude and direction of findings, poses a particular threat to the validity of meta-analysis. Here, we investigate possible publication bias by visual inspection of Funnel plots. If the effect size versus standard is broadly symmetrical, the publication bias is absent. As shown in Figure 5., the Funnel plot on the left shows the points of nine studies of METTL3 knockdown evenly fall on both sides of the summary effect size and the standard error is approximately 0.075 on average. However, the vertical line representing the summary of all the studies of METTL3 knockdown lies on the right of zero, around 1.73, suggests that there is a positive effect of publication bias on the summary effect size. As for the Funnel plot on the right, points of ten studies of METTL14 knockdown evenly fall on both sides of the summary effect size. The standard error is approximately 0.050 on average and the vertical line lies on the origin meaning no publication bias on the summary effect size.