Skip to content

Machine Learning algorithm to identify periods of growth, decline and stationarity in stock data

License

Notifications You must be signed in to change notification settings

viventriglia/k-means_clustering_financial_time_series

Folders and files

NameName
Last commit message
Last commit date

Latest commit


History

7 Commits


Repository files navigation

k-means clustering for financial time series

Humans can easily tell by looking at a chart whether a trend is up or down. A computer cannot. So, one needs a way to put in an input and get a consistent output back out.

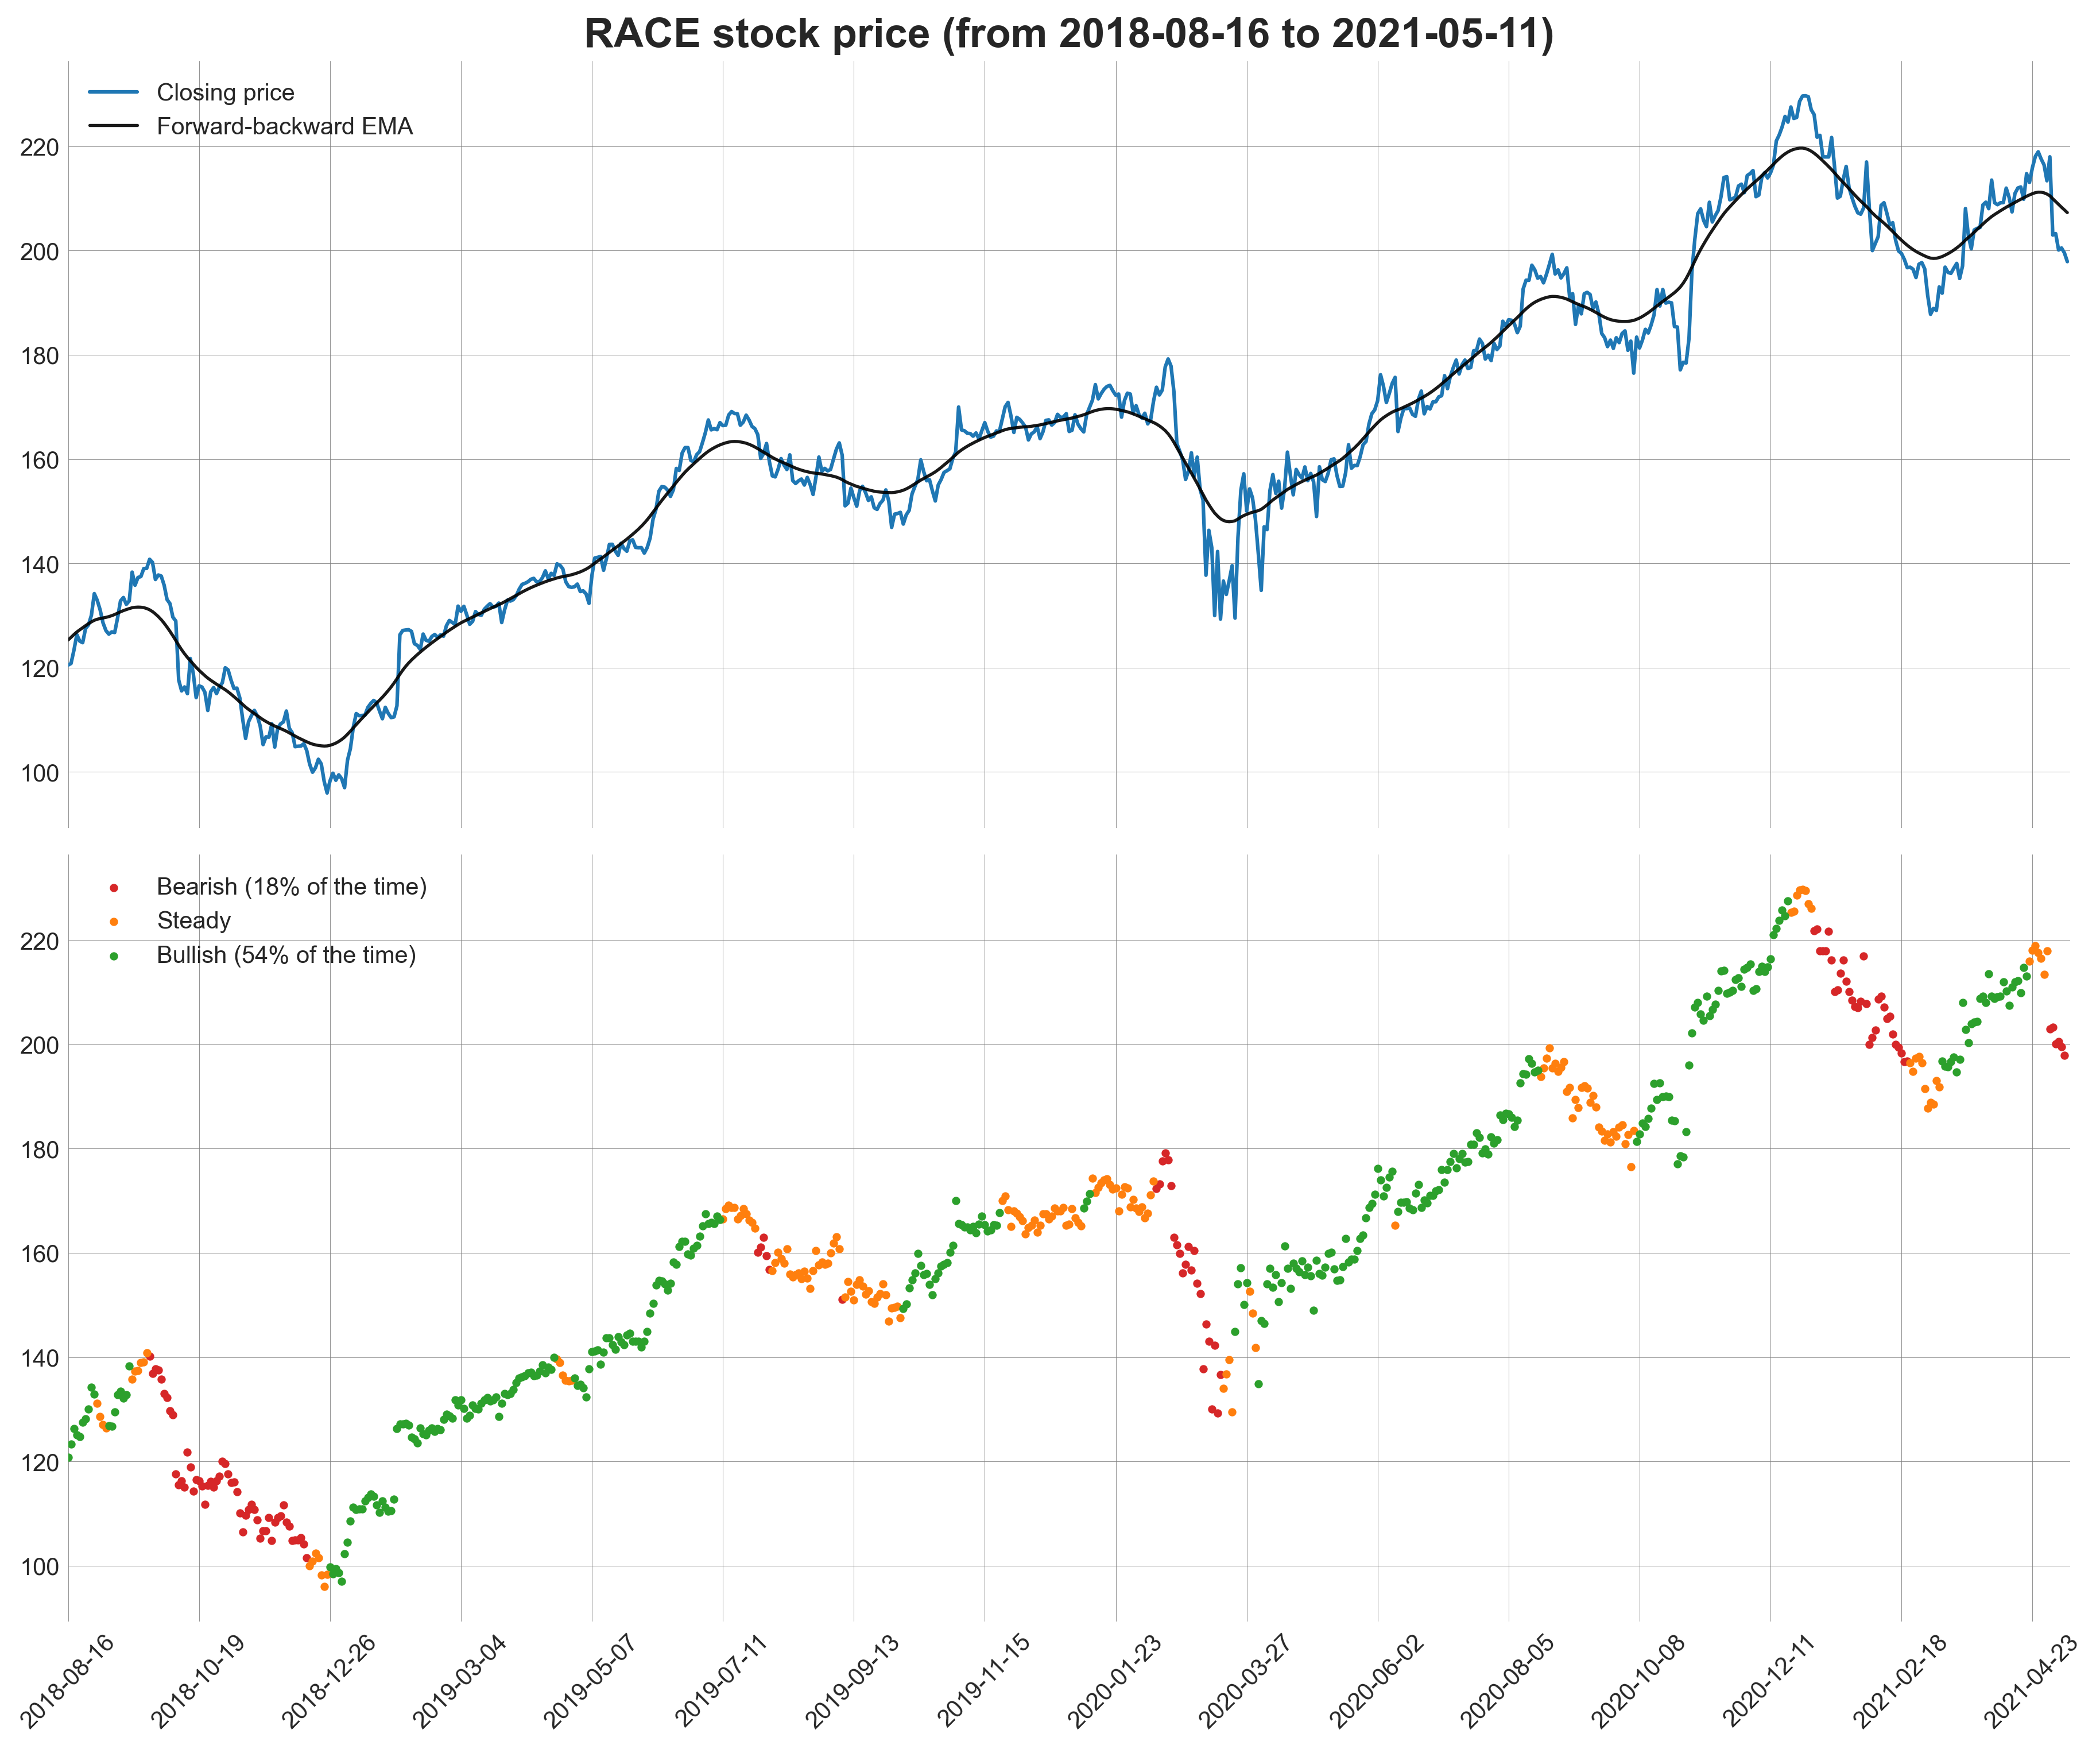
In this project, I analysed the time series of stock prices. Using a forward-backward filter, I smoothed the data, and then used a k-means clustering algorithm to break it down into three trends: bullish, bearish and steady. The analysis is summarised in the IPython notebook, while all the relevant function are defined in the helper_func.py module.

As an example, this is the time series for RACE, the Ferrari stock.

RACE stock

About

Machine Learning algorithm to identify periods of growth, decline and stationarity in stock data

Topics

Resources

License

Stars

Watchers

Forks

Releases

No releases published

Packages

No packages published