- Remember to use CTRL+left click on the links
- There may be display issues for the interactive map in github. Try opening it in colab.
Plotting maps using python. Coded roughly, as a quick and temporary substitution for Tableau, when creating a customized map of Maharashtra with relevant locations. For now, minus the terrain and rails/roads, just the state and district borders are of interest.
Maharashtra map just for reference.
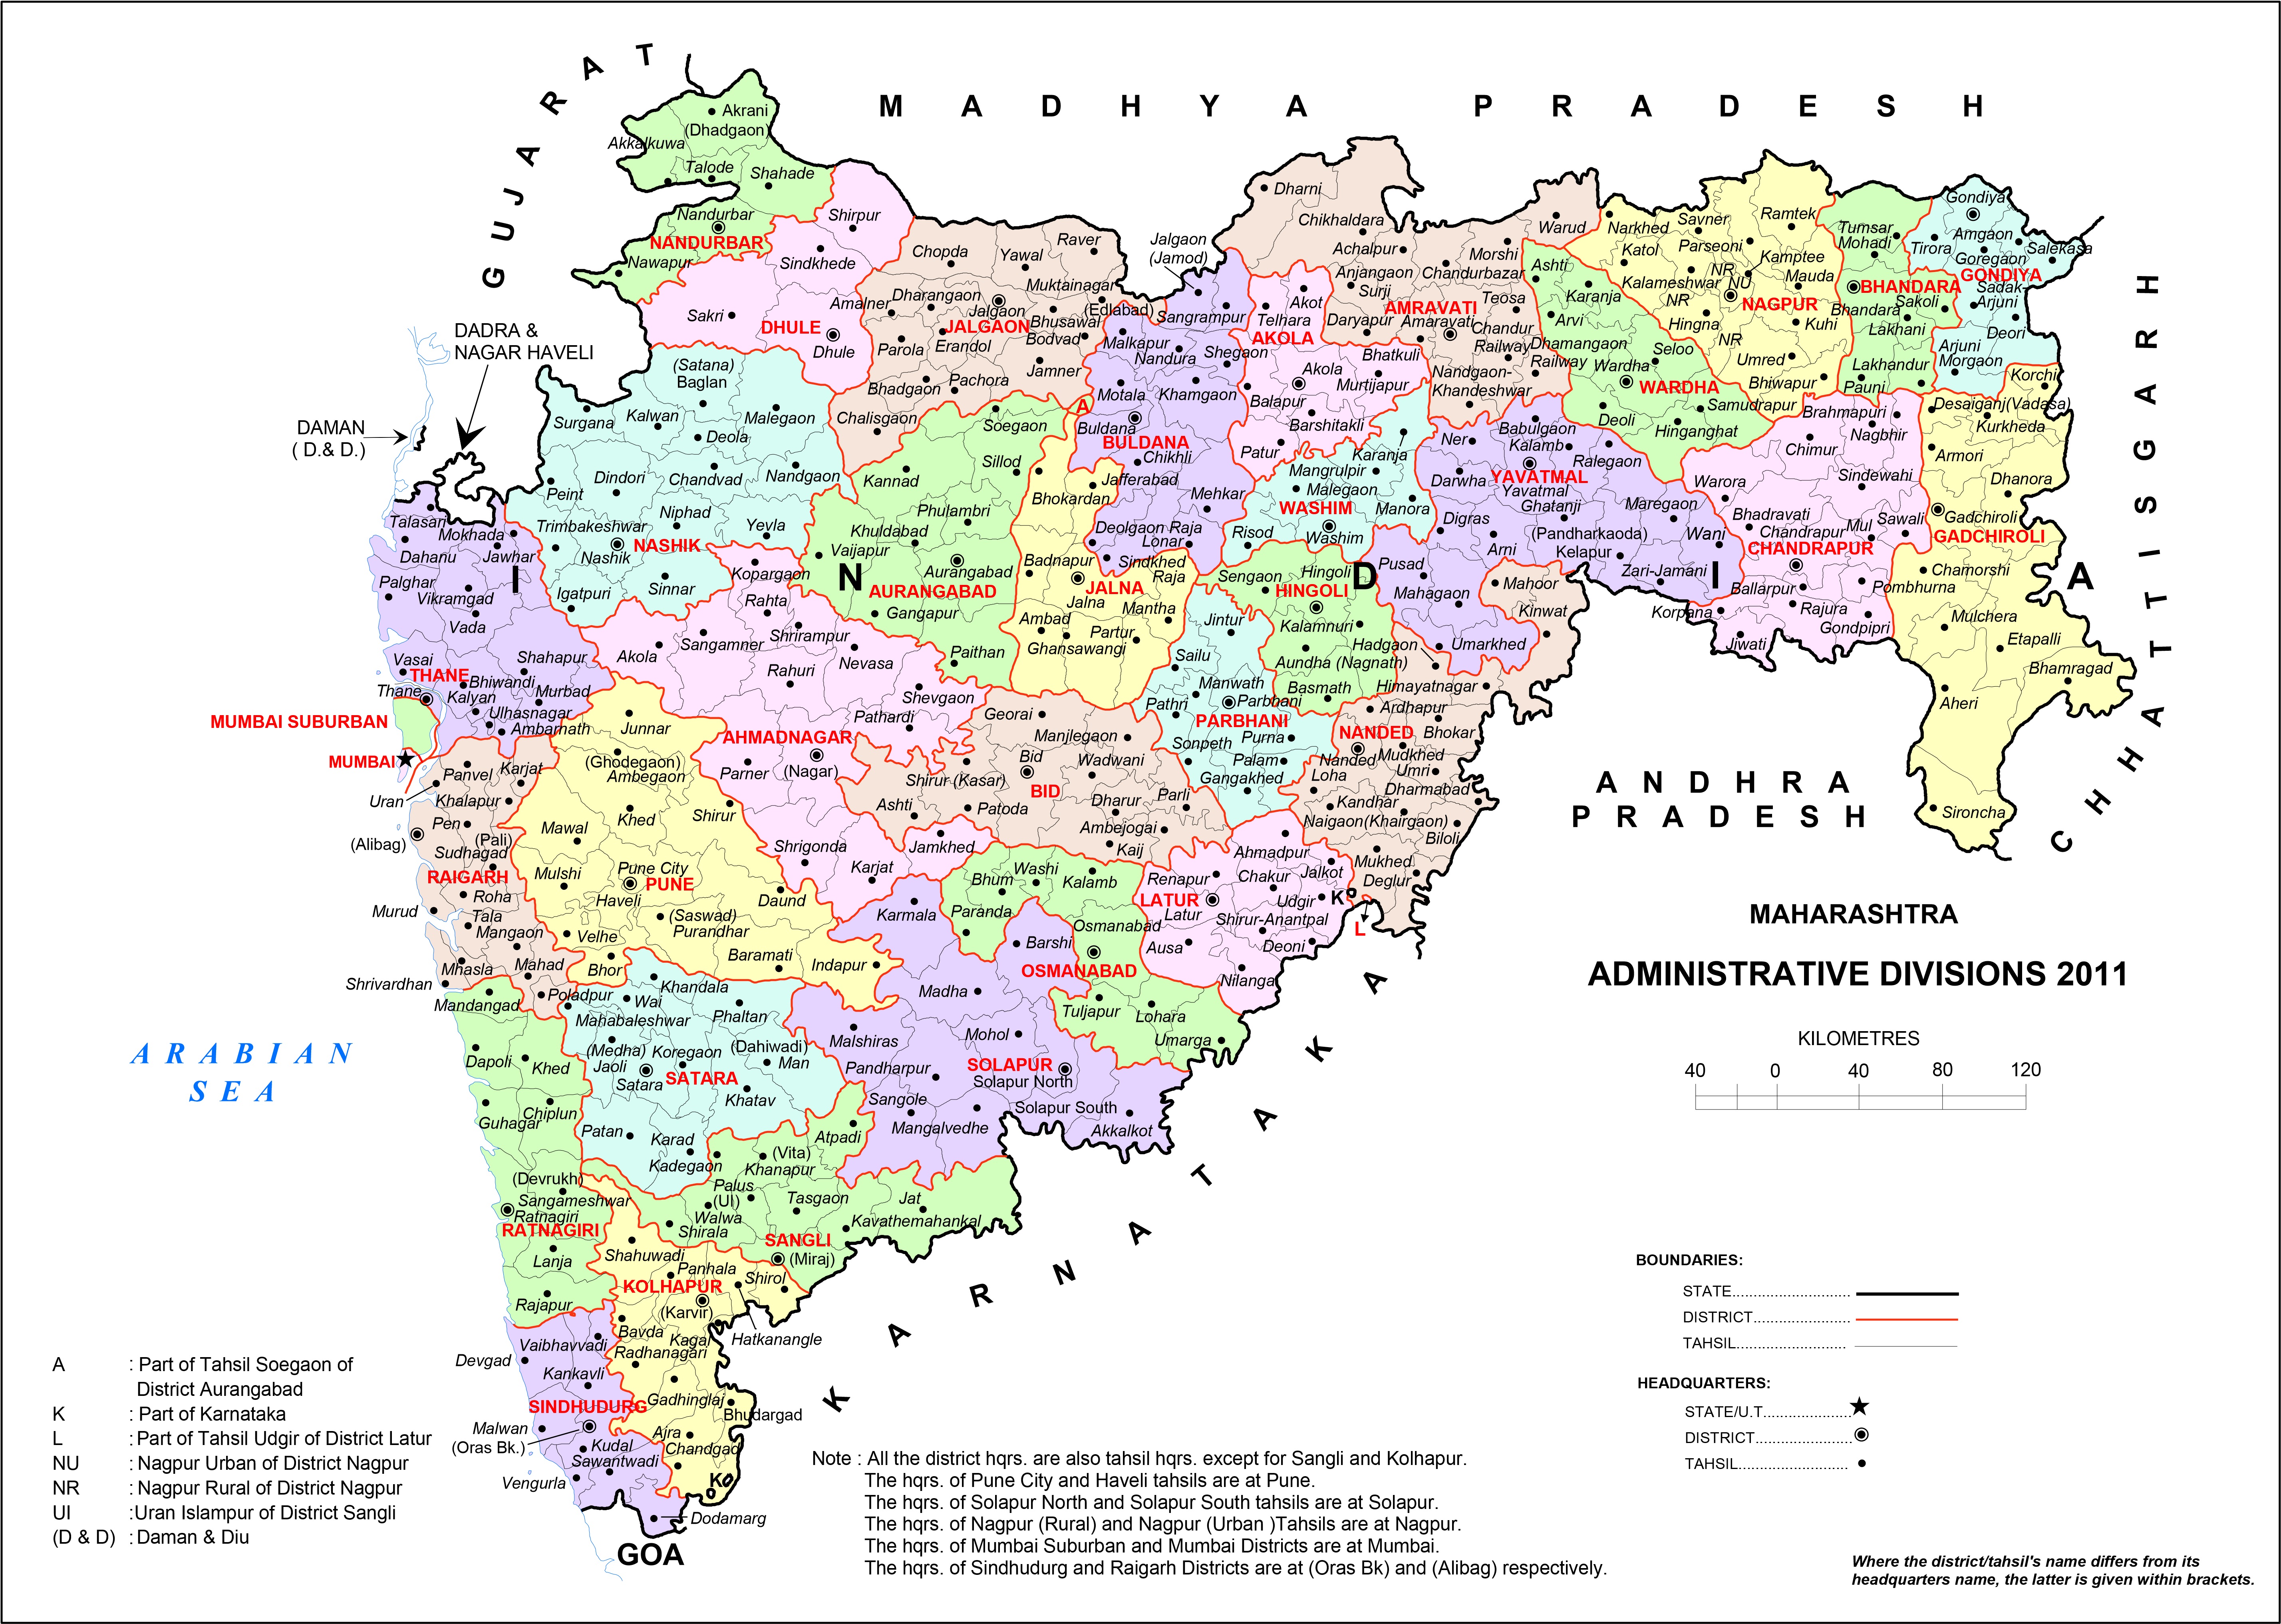
Have plot using two methods.
- First using geopandas and cartopy, which produced a crude map which required shapefiles of Maharashtra, a good one of which was difficult to come by. Nevertheless, found some here.
- Second, used folium for an interactive map. Much better and refined, location names come as pop-ups on clicks. Required geoJSON files of Maharashtra, got it (with district borders) quite easily from here
- As stated earlier, shapefiles or geoJSON files depending on the method.
- Latitude and Longitude of locations. Easily found from GoogleMaps
For the location names: To maintain vernacular pronunciation, while still preserving readability as per original script, I have used a self-tampered Harvard-Kyoto transliteration - with the voiced retroflex lateral approximant ळ written as La, and the schwa as Ə.
Example, माळठाण in HK and modified HK are mALaThANa and mALəThANə respectively.
Typically, I'd have preferred the method using geopandas where I can add the distance scale using geopy.distance on the axes limits. The folium method while being interactive and also quite fluid, I cannot seem to find a method to lock in the zoom. Lack of a good shapefile for MH state influences the decision in favour of folium. But, better shapefiles (like one for NYC I found here) would make me choose geopandas.