urbs is a linear programming optimisation model for capacity expansion planning and unit commitment for distributed energy systems. Its name, latin for city, stems from its origin as a model for optimisation for urban energy systems. Since then, it has been adapted to multiple scales from neighbourhoods to continents.
- urbs is a linear programming model for multi-commodity energy systems with a focus on optimal storage sizing and use.
- It finds the minimum cost energy system to satisfy given demand time series for possibly multiple commodities (e.g. electricity).
- By default, operates on hourly-spaced time steps (configurable).
- Thanks to Pandas, complex data analysis is easy.
- The model itself is quite small thanks to relying on package Pyomo.
- The small codebase includes reporting and plotting functionality.


There are 2 ways to get all required packages under Windows. We recommend using the Python distribution Anaconda. If you don't want to use it or already have an existing Python (version 3.6 recommended, 2.7 is supported as well) installation, you can also download the required packages by yourself..
- Anaconda (Python 3)/Miniconda. Choose the 64-bit installer if possible.
During the installation procedure, keep both checkboxes "modify PATH" and "register Python" selected! If only higher Python versions are available, you can switch to a specific Python Version by typing
conda install python=<version> - Packages and Solver: GLPK.
- Download the environment file.
- Launch a new command prompt (Windows: Win+R, type "cmd", Enter)
- Install it via conda by
conda env create -f urbs-env.yml. - Each time you open a new terminal for running urbs, you can activate the environment by
conda activate urbs.
Continue at Get Started.
For all packages, best take the latest release or release candidate version. Both 32 bit and 64 bit versions work, though 64 bit is recommended. The list of packages can be found in the environment file.
Once installation is complete, finally install git (for version control). Remark: at step "Adjusting your PATH environment", select "Run Git from the Windows Command Prompt".
Then, in a directory of your choice, clone this repository by:
git clone https://github.com/tum-ens/urbs.git
Continue like the users after they downloaded the zip file.
If you are not planning on developing urbs, pick the latest release and download the zip file.
In the downloaded directory, open a execute the runme script by using the following on the command prompt (Windows) or Terminal (Linux). (Depending on what your standard python version is, you might need to call python3 instead of python.):
python runme.py
Some minutes later, the subfolder result should contain plots and summary spreadsheets for multiple optimised energy supply scenarios, whose definitions are contained in the run script (watch out for def scenario lines). Not working at the moment: To get a graphical and tabular summary over all scenarios, execute
python comp.py
and look at the new files result/mimo-example-.../comparison.xlsx and result/mimo-example-.../comparison.png for a quick comparison. This script parses the summary spreadsheets for all scenarios.
- Head over to the tutorial at http://urbs.readthedocs.io, which goes through runme.py step by step.
- Read the source code of
runme.pyandcomp.py. - Try adding/modifying scenarios in
scenarios.pyand see their effect on results. - If you need a nice python editor, think about using PyCharm. It has many features including easy Git integration, package management, etc.
- Fire up IPython (
ipython3) and run the scripts from there using the run command:run runmeandrun comp. Then usewhosand inspect the workspace afterwards (whos). See what you can do (analyses, plotting) with the DataFrames. Take theurbs.get_constants,urbs.get_timeseriesandurbs.plotfunctions as inspriation and the Pandas docs as reference.
- If you do not know anything about the command line, read Command Line Crash Course. Python programs are scripts that are executed from the command line, similar to MATLAB scripts that are executed from the MATLAB command prompt.
- If you do not know Python, try one of the following ressources:
- The official Python Tutorial walks you through the language's basic features.
- Learn Python the Hard Way. It is meant for programming beginners.
- The book Python for Data Analysis best summarises the capabilities of the packages installed here. It starts with IPython, then adds NumPy, slowly fades to pandas and then shows first basic, then advanced data conversion and analysis recipes. Visualisation with matplotlib is given its own chapter, both with and without pandas.
- For a huge buffet of appetizers showing the capabilities of Python for scientific computing, I recommend browsing this gallery of interesting IPython Notebooks.
- Branch 1node in the forked repository ojdo/urbs shows a small example of a real-world usage of the model. It includes a
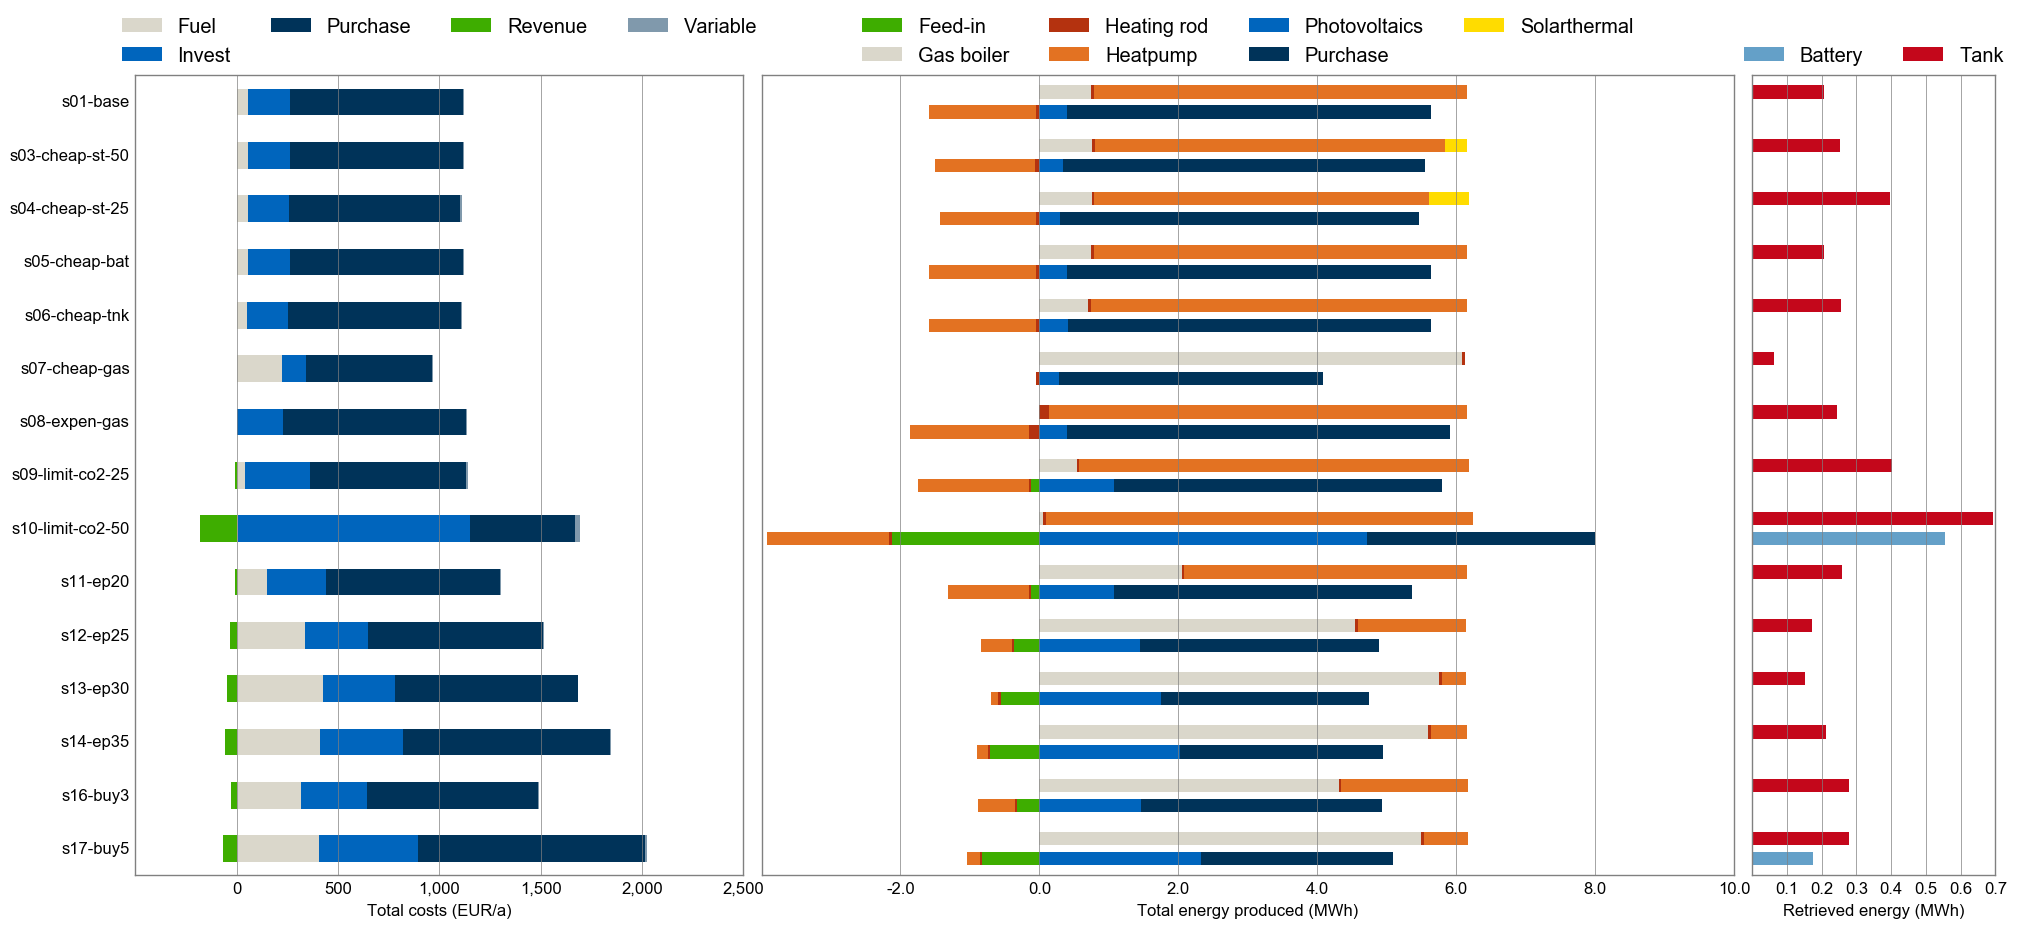
scenario_generatorfunction in its run script, which is useful for extensive parameter sweeps. - Branch 1house in the forked repository ojdo/urbs shows another (newer) example of a small-scale application of the model. It demonstrates the use for two demand commodities (electricity and heat) for a single consumer (a single site named 'house'). It also shows how to create a very customized comparison script:
- Branch haag15 in the forked repository ojdo/urbs shows a larger example of a real-world use. Its input file contains a town divided into 12 regions, 12 process types, and 2 demand commodities (electricity and heat) . Patience and RAM (64 GB or more) is needed to run these scenarios with 8760 timesteps. The branch also contains three IPython notebooks that are used for result analysis and coupling to model rivus.
- ASEAN
- CoTraDis
- decensys
- extremos
- MIQCP
- near_optimal
- urbs_gui
Copyright (C) 2014-2019 TUM ENS
This program is free software: you can redistribute it and/or modify it under the terms of the GNU General Public License as published by the Free Software Foundation, either version 3 of the License, or (at your option) any later version.
This program is distributed in the hope that it will be useful, but WITHOUT ANY WARRANTY; without even the implied warranty of MERCHANTABILITY or FITNESS FOR A PARTICULAR PURPOSE. See the GNU General Public License for more details.
You should have received a copy of the GNU General Public License along with this program. If not, see http://www.gnu.org/licenses/