


Traja is a Python library for trajectory analysis. It extends the capability of pandas DataFrame specific for animal trajectory analysis in 2D, and provides convenient interfaces to other geometric analysis packages (eg, R and shapely).
The traja Python package is a toolkit for the numerical characterization and analysis of the trajectories of moving animals. Trajectory analysis is applicable in fields as diverse as optimal foraging theory, migration, and behavioral mimicry (e.g. for verifying similarities in locomotion). A trajectory is simply a record of the path followed by a moving animal. Traja operates on trajectories in the form of a series of locations (as x, y coordinates) with times. Trajectories may be obtained by any method which provides this information, including manual tracking, radio telemetry, GPS tracking, and motion tracking from videos.
The goal of this package (and this document) is to aid biological researchers, who may not have extensive experience with Python, to analyze trajectories without being restricted by a limited knowledge of Python or programming. However, a basic understanding of Python is useful.
If you use traja in your publications, please cite the repo
@software{justin_shenk_2019_3237827,
  author       = {Justin Shenk and
                  the Traja development team},
  title        = {justinshenk/traja},
  month        = jun,
  year         = 2019,
  publisher    = {Zenodo},
  version      = {latest},
  doi          = {10.5281/zenodo.3237827},
  url          = {https://doi.org/10.5281/zenodo.3237827}
}To install traja with conda, run
conda install -c conda-forge traja
or with pip
pip install traja.
Import traja into your Python script or via the Python command-line with import traja.
Traja stores trajectories in pandas DataFrames, allowing any pandas functions to be used.
Load trajectory with x, y and time coordinates:
import traja

df = traja.read_file('coords.csv')
Once a DataFrame is loaded, use the .traja accessor to access the visualization and analysis methods:
df.traja.plot(title='Cage trajectory')traja.trajectory.[method]| Function | Description |
|---|---|
calc_derivatives |
Calculate derivatives of x, y values |
calc_turn_angles |
Calculate turn angles with regard to x-axis |
transitions |
Calculate first-order Markov model for transitions between grid bins |
generate |
Generate random walk |
resample_time |
Resample to consistent step_time intervals |
rediscretize_points |
Rediscretize points to given step length |
For up-to-date documentation, see https://traja.readthedocs.io.
Generate random walks with
df = traja.generate(n=1000, step_length=2)
df.traja.plot()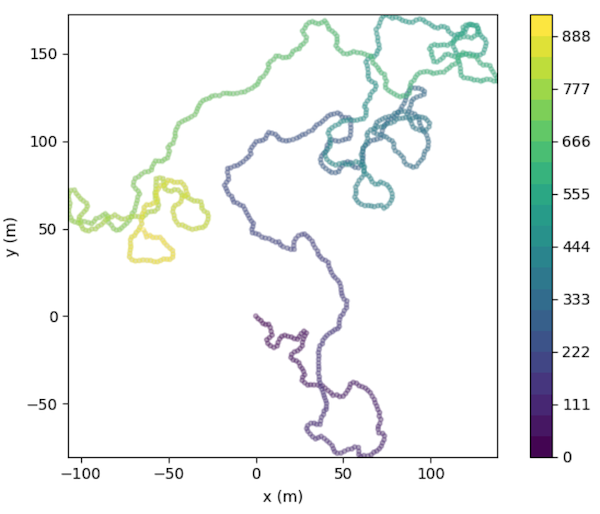
traja.trajectory.resample_time allows resampling trajectories by a step_time.
df = traja.generate()
traja.plot_surface(df)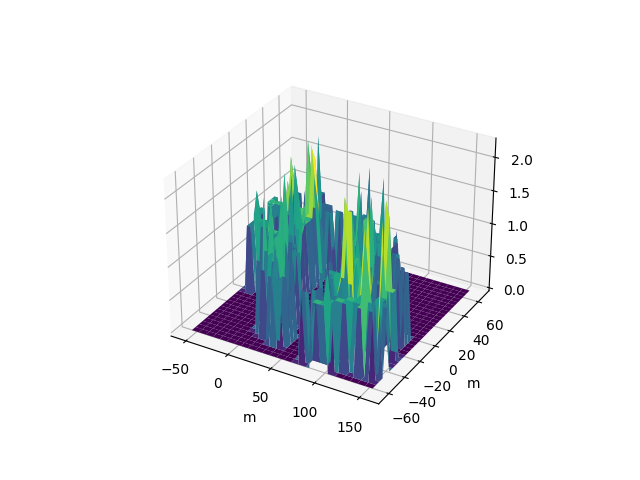
traja.plot_quiver(df, bins=32)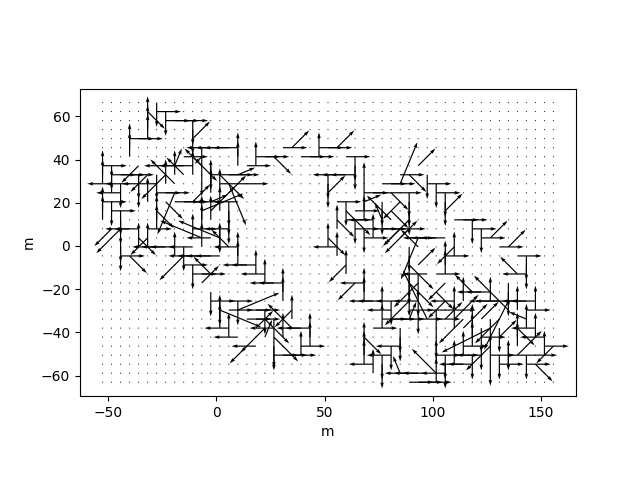
traja.plot_contour(df, filled=False, quiver=False, bins=32)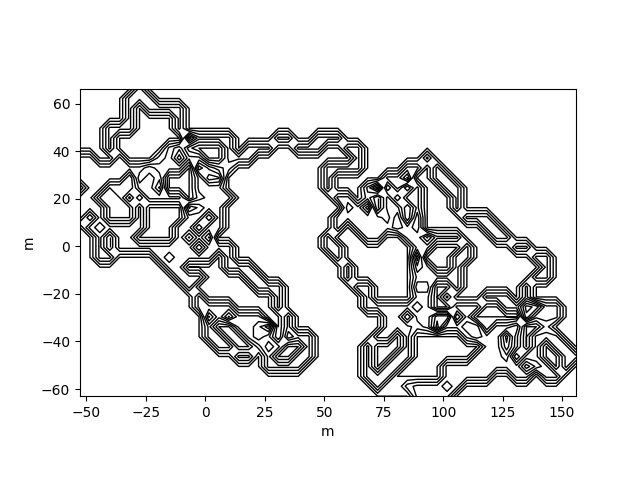
traja.plot_contour(df, filled=False, quiver=False, bins=32)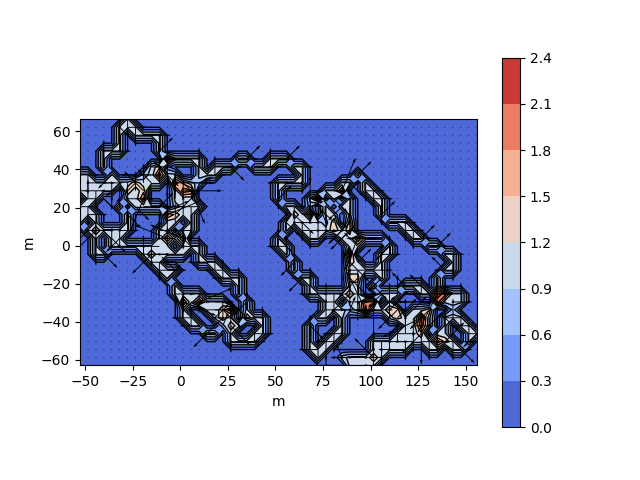
traja.plot_contour(df, bins=32, contourfplot_kws={'cmap':'coolwarm'})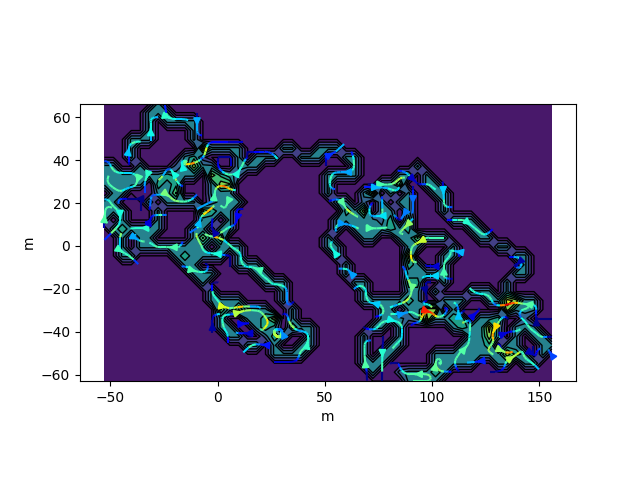
traja code implementation and analytical methods (particularly rediscretize_points) are heavily inspired by Jim McLean's R package trajr. Many thanks to Jim for his feedback.