An SVG-based tool to animate maps of public transportation networks.
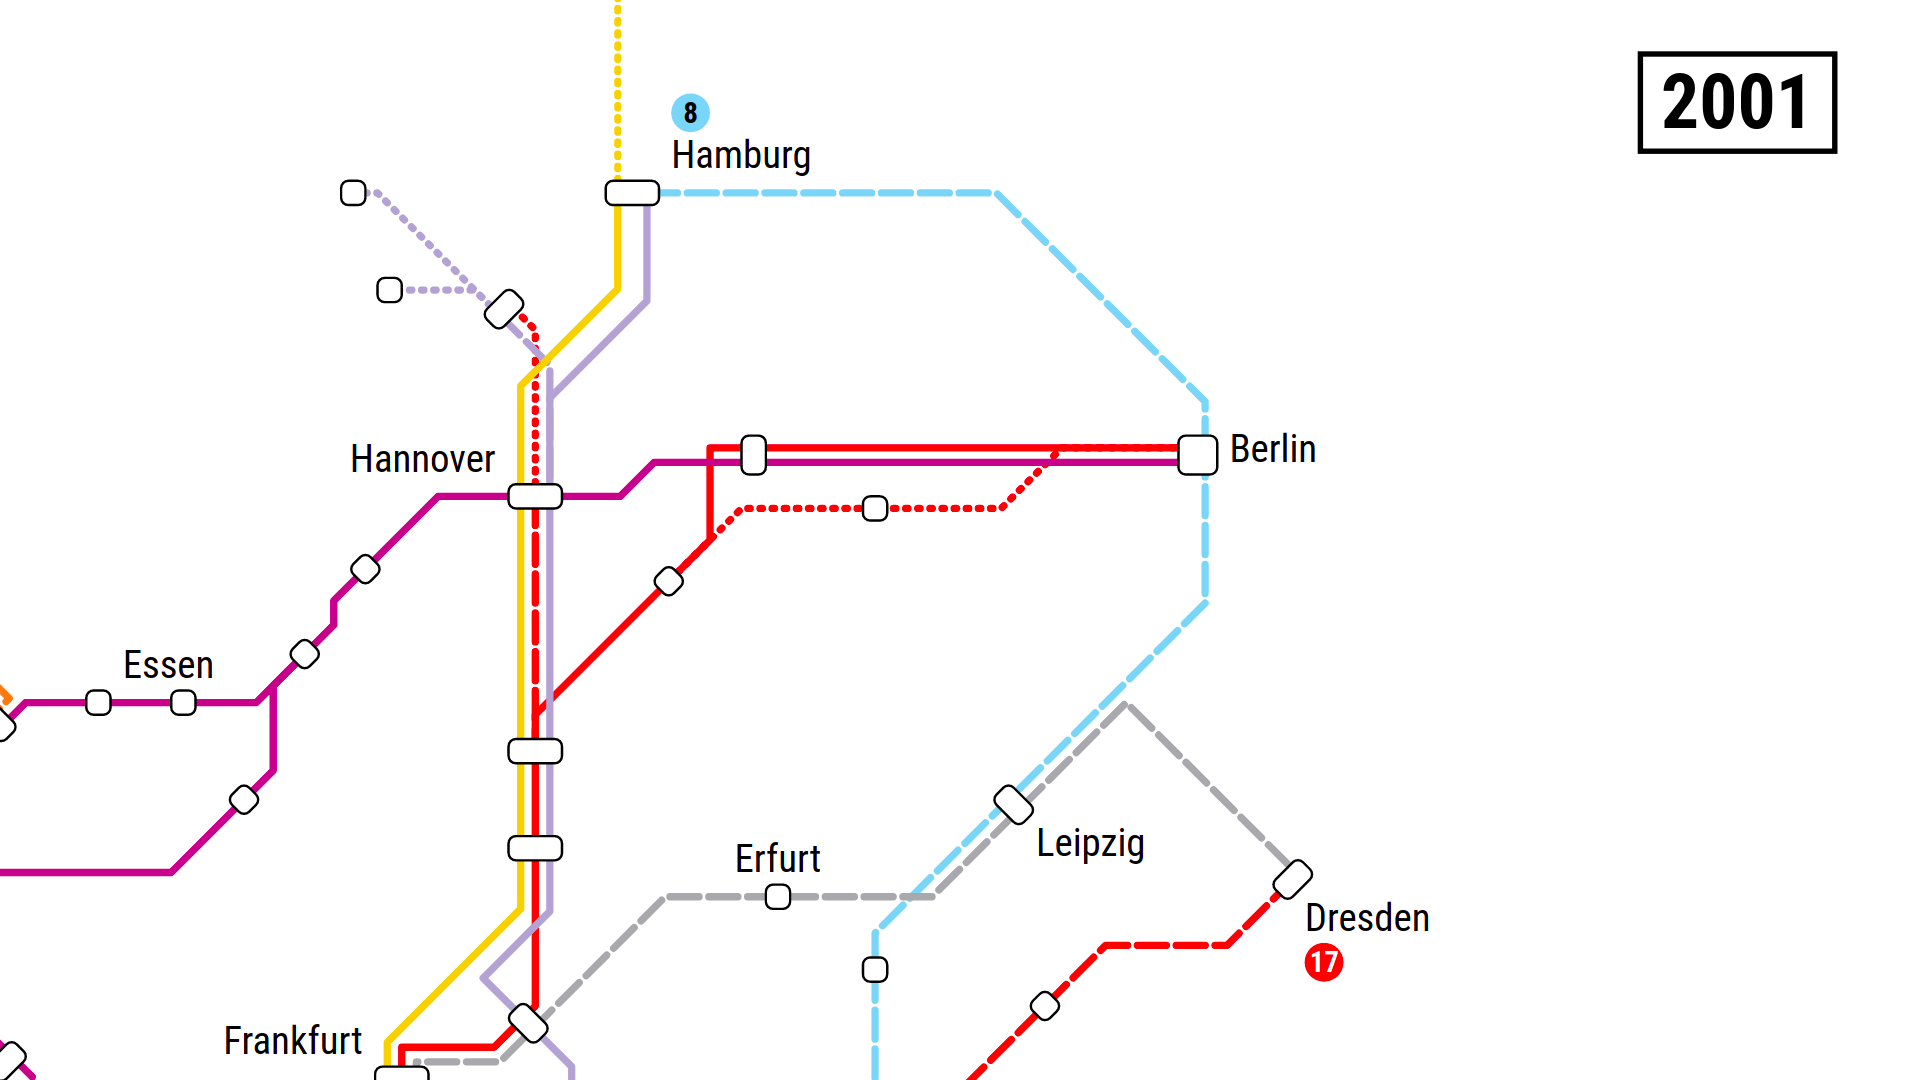
See an example of how to use it in the examples/ directory. See it in action in this video: https://youtu.be/1-3F0ViONS4
This is not
- a graph layout algorithm. You will have to position the stations (nodes) yourself.
- an interactive UI. The map must be defined in SVG code.
This is
- a "Harry Beck style" algorithm. It will try to nicely draw the lines between the stations.
- a time saver (given this software already exists). It saves you from having to tediously position and animate every single line segment.
- Create an SVG and a corresponding CSS file as seen in the examples/ directory
- Define stations and their positions
<rect data-station="Berlin" x="150" y="510" data-dir="n" /> - Define line segments connecting those stations
<path data-line="ICE1" data-stops="Berlin Hannover Frankfurt" data-from="1999 17" data-to="2003 30" /> - View the animated SVG in your browser (preferably Chrome)
- Iterate and fix the appearance of lines and stations until you're happy
- If you like, render it to a video by running timecut-parallel.sh or adapting the docker-compose.yml
Stations need to be SVG rect elements having an id (data-station) and a position. They may have a direction (data-dir), in which they will be rotated (e.g. n, nw, se, e) and a label direction (data-label-dir), where labels belonging to this station will appear.
Once a line is assigned to a station, it will stay where it is, i.e. it is not moved or altered, until it is removed again. That means that the layout of lines and stations will not be optimized over time, during the animation, as more lines are added.
Each line segment needs to be an SVG path element having a name (data-line) and a space separated list (data-stops) of station ids that it connects, where the first specified station is the origin and the last the terminus – the direction impacting the animation. In the data-stops string, before each station, additional flags can be set, which are discussed under Tracks. Usually, lines appear and disappear at certain points in time, which can be set using "instants" in the data-from and data-to fields. Multiple line segments together can form a line, identified by the common data-line name. Line segments of one line will adhere to a couple of special rules, e.g. they will join seamlessly and leave stations in the same direction they arrived, just as at interstations of a line segment.
The algorithm will try to find a nice "Harry Beck style" way to draw the lines. Sometimes it will fail. You can fix this by adjusting station positioning and rotation and by adding additional "helper" stations while setting class="helper" in the example or making these helper stations invisible however you like.
Lines will be animated with a constant speed that can be configured.
An "instant" is a point in time, consisting of an "epoch", a "second" and a flag. Seconds start again from 0 for each new epoch. Events defined for the same epoch and second will (a bit counterintuitively) not be animated at the same time, but exactly consecutively. This is very handy for multiple line segments or lines that should appear directly one after another in one single fluid animation. The order in which they are animated depends on the order the elements appear in the SVG source, with one exception: when removing elements (data-to), consecutive elements with the same name and instant will be animated in reverse order.
In the data-from and data-to fields, the instant is to be specified with space-separated epoch and second and an optional flag. Currently supported flags are reverse, noanim, nozoom, keepzoom. Usually, the removal of lines will be animated in reverse direction (i.e. starting to disappear from the terminus). With the reverse flag, this animation will be reversed again, i.e. the line will start to disappear from the origin. With noanim, the line will just appear or disappear immediately. nozoom and keepzoom will influence the zooming behavior for this element, see Zoom below.
For showing and hiding elements at the respective instants, the CSS visibility property is used. So to make sure that elements do not appear beforehand, set their default state to visibility: hidden in your CSS.
If an element with the id epoch-label exists in the SVG, the current epoch will be written to it and updated so that it can be displayed, which is especially useful when using the epoch to represent the year.
Stations have tracks in two directions, the main direction of the station (data-dir) and the secondary, perpendicular direction (see example ice-network.svg). Tracks are numbered indepedently for the two directions. Track number +0/-0 is the only track that is exactly at the position of the station. Additional lines will by default be added to the right and bottom, respectively. This can be adjusted by setting the track before the respective station in the data-stops string of a line segment. It can be set to just a sign (+, -, the former one being the default) or a precise track number (+1, -2). A track number must alway be prefixed with a sign, i.e. the + is mandatory! A track number will automatically be eroded to the respective sign for the next stop of that line segment, so that e.g. a line that was on the left stays on the left.
Line segments with the same line name will automatically share the same track at their origin stations, currently not at their termini (you will have to set the track manually if you want to join segments seamlessly in this case). The "Harry Beck style" algorithm will often fail if lines at stations that are in a straight line do not have the same track at both stations. So it is advisable to try and have parallel lines use the same track for consecutive stations.
An asterisk (*) can be appended or specified alone as the track to mark the stop of this line segment as not being an origin or terminus of the entire line. This is only necessary in conjunction with line labels, see below.
A label, being an SVG text element, can be defined for a station (data-station) or for a line (data-line). Labels can also have instants (data-from and data-to), however, labels won't appear unless the corresponding station is visible (i.e. has a line going through it). Station labels need to reference a station id, line labels a line name. Line labels will add the specified label to all origin and terminus stations of that line at this point in time. These stations are defined as all stations that are origin or terminus of exactly one line segment of that line. Sometimes you will need to exclude some stations from this list by specifing the * flag with the track. Labels are drawn at the position indicated by the data-label-dir property on that station.
For each instant, the canvas will zoom to the bounding box of all elements that are altered during that instant. Elements that have nozoom or keepzoom set are not taken into account for the calculation of the bounding box. If in this instant no elements qualify for zooming, the canvas will be zoomed out completely. However, if a keepzoom element is the first element for that instant, the bounding box of the previous instant will be retained. That is, if all other elements for this instant do not contribute to the bounding box, the bounding box will stay the same as in the last instant.
There is always one second reserved for zooming at the beginning of each instant, unless configured otherwise. Only after that second will the animation of elements for that instant start. Zoom can be disabled altogether by removing the zoomable group.
Trains can be animated on previously defined lines (see example trains.svg). They are just paths that are moved along other paths. A path that is supposed to represent a train must have the data-train attribute, referencing the line name defined previously on which the train is supposed to run. In the data-stops attribute, a list of stations of this line at which the train is supposed to stop must be given, including the departure and arrival times, e.g. Berlin +11+50 Hannover +56+120 Frankfurt, meaning the train needs 39 minutes between Berlin and Hannover and stops at Hannover for 6 minutes, arriving in Frankfurt after another 64 minutes. The time is given in seconds relative to the data-from epoch at second 0. This makes it easy to animate the trains according to a real timetable if one second in the animation corresponds to one minute in reality. Pluses (+) are mandatory, minuses (-) can be used instead to let the train start from the origin before the data-from instant.
The number of train segments can be specified using the data-length attribute (default: 2). The styling of the train should be done entirely using CSS, where SVG's marker-start, marker-mid and marker-end come in handy (see example).
A train can run across multiple line segments. However, there exists currently a limitation that a train must stop at least once per line segment. More complex train routing is not yet supported. If you want to represent a station with trains stopping at multiple tracks and positions at the platforms, it might make sense to represent each stopping position and each fork/switch as a separate dummy station and have these connected with line segments all of the same line. You can then define a lot of trains for the same line which are stopping at specific positions by referencing the dummy stations.
Using SVG as the base, the appearance of the map can be tweaked and styled as you wish, with additional SVG elements and CSS. The styles (e.g. colors) of the lines should also be adjusted via CSS. It might also come in handy to add a background map as SVG or embedded image. Please note that SVG filters do not seem to be supported by the timecut renderer, in case you want to render your animation to a video.
For debugging, look at possible errors and warnings in the developer console of your browser. By appending a hashtag and the epoch to the URL under which you're viewing your SVG and then refreshing the page, you can jump to that very epoch skipping the preceding ones, so that you don't have to watch the entire animation over and over again.
For additional configuration options to tweak the behaviour of TNA, see Config.
The code could probably be rewritten to use another base technology, e.g. HTML5 Canvas. It's mainly just the TS classes in the svg subdirectory that have to be reimplemented. I just happen to think that SVG is the best choice.
- Stations need to have a
data-stationattribute instead of anid. Elements that can be animated will be sourced from the entire SVG document instead of only theelementsandstationgroups. - To achieve the previous behavior of the
noanimflag, thenoanim-nozoomflags now need to be used. - Labels etc. are now added in the same parent as the respective element in order to preserve the transform context
You will often find examples for these experimental features over at https://github.com/traines-source/traines-videos.
- Animating (showing and hiding) arbitrary SVG elements using
data-fromanddata-to. - Ken Burns Effect: Slowly zooming photos.
- Gravitator: Representing historically changing properties of relations (e.g. travel times) by edge length in a dynamic graph, using automatic optimization.
- Animating geographical lines, and in general, paths with given path commands.
- Optionally starting transport-network-animator only when a specific event is received, to be able to execute custom code beforehand (e.g. reading paths from geojson).
- Firing event for every epoch, to be able to run custom code.
- Drawing lines in geographical order (e.g. north to south) instead of defined order.
- Built-in support for map projections so you can work in WGS84 as much as possible.
- Overridable drawing speed for lines.
npm and, for certain actions, Docker are required. The development environment is tested on Linux, but might also work on other platforms.
Clone the repo and run npm install. The following npm scripts are available:
npm run wp: Build thedist/network-animator.jsdistribution file so the changes can be used in an SVG project filenpm run wpw: Continuously watch for changes and buildnpm run test: Run unit testsnpm run coverage: Run unit tests with coveragenpm run screentest: Run cypress screenshot regression testsnpm run docs: Build the TS docsnpm run build: Run wp, test, screentest, docs in one go – useful before committing