This is a simple package to produce sankey plots with matplotlib.
It is an alternative to the matplotlib.sankey
module, which sacrifices some
flexibility in exchange for a much simpler interface.
Specifically, this package only produces standard horizontal sankey plots, but it does so automatically from data, rather than requiring the user to figure out the spatial distribution of nodes/flows.
There is a single method, sankey(), which accepts one argument data and
several optional keyword arguments.
data must be a 2-dimensional tabular object with at least 3 columns: best
results are obtained with pandas.DataFrames, but numpy.arrays and simple
lists of lists are also accepted.
- each row corresponds to a "flow"
- the first column stores the weights (that is, the tickness of each flow
drawn), and must be an
intorfloat - each other column denotes a node (by its label, which can have any type) where the flow passes, at each stage
- if
datais apandas.DataFrame, then the column names are represented on top of each stage
from mpl_sankey import sankey
from matplotlib import pyplot as plt
import pandas as pd

data = pd.DataFrame([[1, 'a', 1, 'I', 1, 'success'],
                     [2, 'b', 2, 'III', 2, 'discard'],
                     [1, 'b', 1, 'II', 2, 'success'],
                     [1, 'c', 1, 'II', 2, 'discard'],
                     [2.5, 'a', 2, 'IV', 1, 'discard'],
                     [2, 'a', 1, 'I', 1, 'success']],
                    columns=['Weight', 'First', 'Then', 'After', 'Finally', 'Outcome'])

plt.figure(figsize=(12, 3))
sankey(data, cmap=plt.get_cmap('viridis'))
plt.savefig('featured.png', bbox_inches='tight')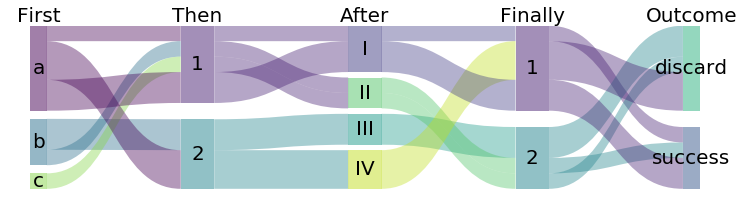
Find more in the Examples notebook.
You can install this package through PyPi with pip install mpl_sankey, or
just clone the repo from github.
The package requires pandas (and, obviously, matplotlib) to work.