Presidential election results for 2008, 2012, 2016, and 2020 from The Guardian, townhall.com, Fox News, Politico, and the New York Times.
2008 election results at the county-level compiled by GitHub user @wboykinm.
2012 election results at the county-level are taken from results published in an Excel file by the Guardian.
2016 election results at the county-level are scraped from results published by Townhall.com. Their well-formatted county-level result tables for the 2016 presidential general election makes it easy for a web scraper like beautifulsoup to capture results.
2020 election results at the county-level are scraped from results published by from Fox News, Politico, and the New York Times.
Idea for 2012 election results from tweet to John A Guerra Gomez. Idea for 2016 election results from tweet to DJ Patil.
Interactive choropleth map of the 2020 presidential election results created by Tony McGovern using Vue, Vuetify, and D3. Static choropleth and dot-density maps of 2020 presidential election results also created by Tony McGovern using the Mapshaper Command Line Tool. See the section below on how to use this tool to create these static maps.
This repository relies on data from various newspapers that report 2020 presidential election results at the county-level for all U.S. states, with the exception of Alaska and Washington, D.C., which are reported at the house district- and ward-level, respectively. Whether county-, house district-, or ward-level, each election result is tied to a specific U.S. geography by a unique 5-digit code that represents that geography, called a FIPS code. The U.S. Census Bureau Geography Division (Geography Division) identifies and provides cartographic boundary files for, and assigns a unique FIPS code to, each geography. For a brief explanation on the derivation of the FIPS code, navigate to this page maintained by the Geography Division.
The goal here is to bind 2020 presidential election results to U.S. cartographic boundary files and convert them into a format that can be easily displayed in a web browser. We use the Mapshper Command Line Tool to help create both choropleth and dot density maps.
- Create a directory to hold cartographic boundary files for all election year results within this repository
mkdir cartography
cd cartography
mkdir 2020 2016 2012 2008
- Navigate to the
/2020directory
cd 2020
- Download and unzip U.S. county cartographic boundary files
curl 'https://www2.census.gov/geo/tiger/GENZ2019/shp/cb_2019_us_county_500k.zip' \
    -o cb_2019_us_county_500k.zip
unzip cb_2019_us_county_500k.zip
- Input the U.S. county shapefile
- Filter out certain states, including Alaska -- which we will process separately -- and other U.S. protectorates that we do not have data for
- Create the following new properties:
geoid: combination ofSTATEFPandCOUNTYFP, or FIPS codestate_fips: two digit state FIPS code based onSTATEFPcounty_name: name of the county based onNAME
- Filter out all other fields
- Simplify the layer using the default algorithm, retaining 2% of removable vertices
- Convert the Shapefile into the Albers USA projection
- Output a TopoJSON file named
us_counties.json
mapshaper \
    -i cb_2019_us_county_500k.shp name=us_counties \
    -filter 'STATEFP !== "02" && STATEFP !== "69" && STATEFP !== "66" && STATEFP !== "78" && STATEFP !== "60" && STATEFP !== "72"' \
    -each 'geoid=STATEFP + COUNTYFP,state_fips=STATEFP,county_name=NAME' \
    -filter-fields 'geoid,state_fips,county_name' \
    -simplify 2% \
    -proj albersusa \
    -o format=topojson us_counties.json \
    -o format=geojson us_counties.geojson
The result of these commands should output a TopoJSON file that looks like the image below. Notice how Alaska is missing from this image:
Unlike other states within the United States, Alaska does not administer its presidential elections at the county-level but rather at the lower chamber legislative district, or the House District. To show results at the Alaska House District-level, we must download cartographic boundary files from the same Geography Division Cartographic Boundary Files page and process each of the 40 house districts separately from the county-level files.
- Download and unzip Alaska lower chamber legislative district cartographic boundary files
curl 'https://www2.census.gov/geo/tiger/GENZ2019/shp/cb_2019_02_sldl_500k.zip' \
    -o cb_2019_02_sldl_500k.zip
unzip cb_2019_02_sldl_500k.zip
We now translate and assign each of these 40 house districts a unique FIPS code defined the following way:
- ssSdd, where ss is the state FIPS code, S is a catch-all statewide code, and dd is the house district.
For example, the FIPS code attached to election results for Alaska House District 01 is 02901: '02' represents the state FIPS code for Alaska, '9' is a catch-all statewide code, and '01' represents House District 01.
Each house district in the shapefile contains a number of properties that describe the district. These properties include a unique identifier, the House District number, and geographic descriptions of the district, among other properties. For our purposes, we want to create properties that will allow us uniquely bind 2020 presidential election results to the Alaska geographic layer.
- Input the Alaska House District shapefile
- Create the following new properties:
district_n: a unique, zero-padded, two-digit Alaska House District number based on theSLDLSTpropertycounty_name: combination of "House District " anddistrict_nstate_fips: the state FIPS code given bySTATEFPstate_name: "Alaska"geoid: combination ofstate_fips, "9", anddistrict_n
- Filter out all other fields
- Simplify the layer using the default algorithm, retaining 2% of removable vertices
- Convert the Shapefile into the Albers USA projection
- Output a TopoJSON file named
alaska_districts.json
mapshaper \
    -i cb_2019_02_sldl_500k.shp name=alaska_districts \
    -each 'district_n=Number(SLDLST).toString().length === 2 ? Number(SLDLST).toString() : new Array(2 - Number(SLDLST).toString().length + 1).join("0") + Number(SLDLST).toString(),county_name="House District " + district_n,state_fips=STATEFP,state_name="Alaska",geoid=state_fips + "9" + district_n' \
    -filter-fields 'geoid,state_fips,county_name' \
    -simplify 2% \
    -proj albersusa \
    -o format=topojson alaska_districts.json \
    -o format=geojson alaska_districts.geojson
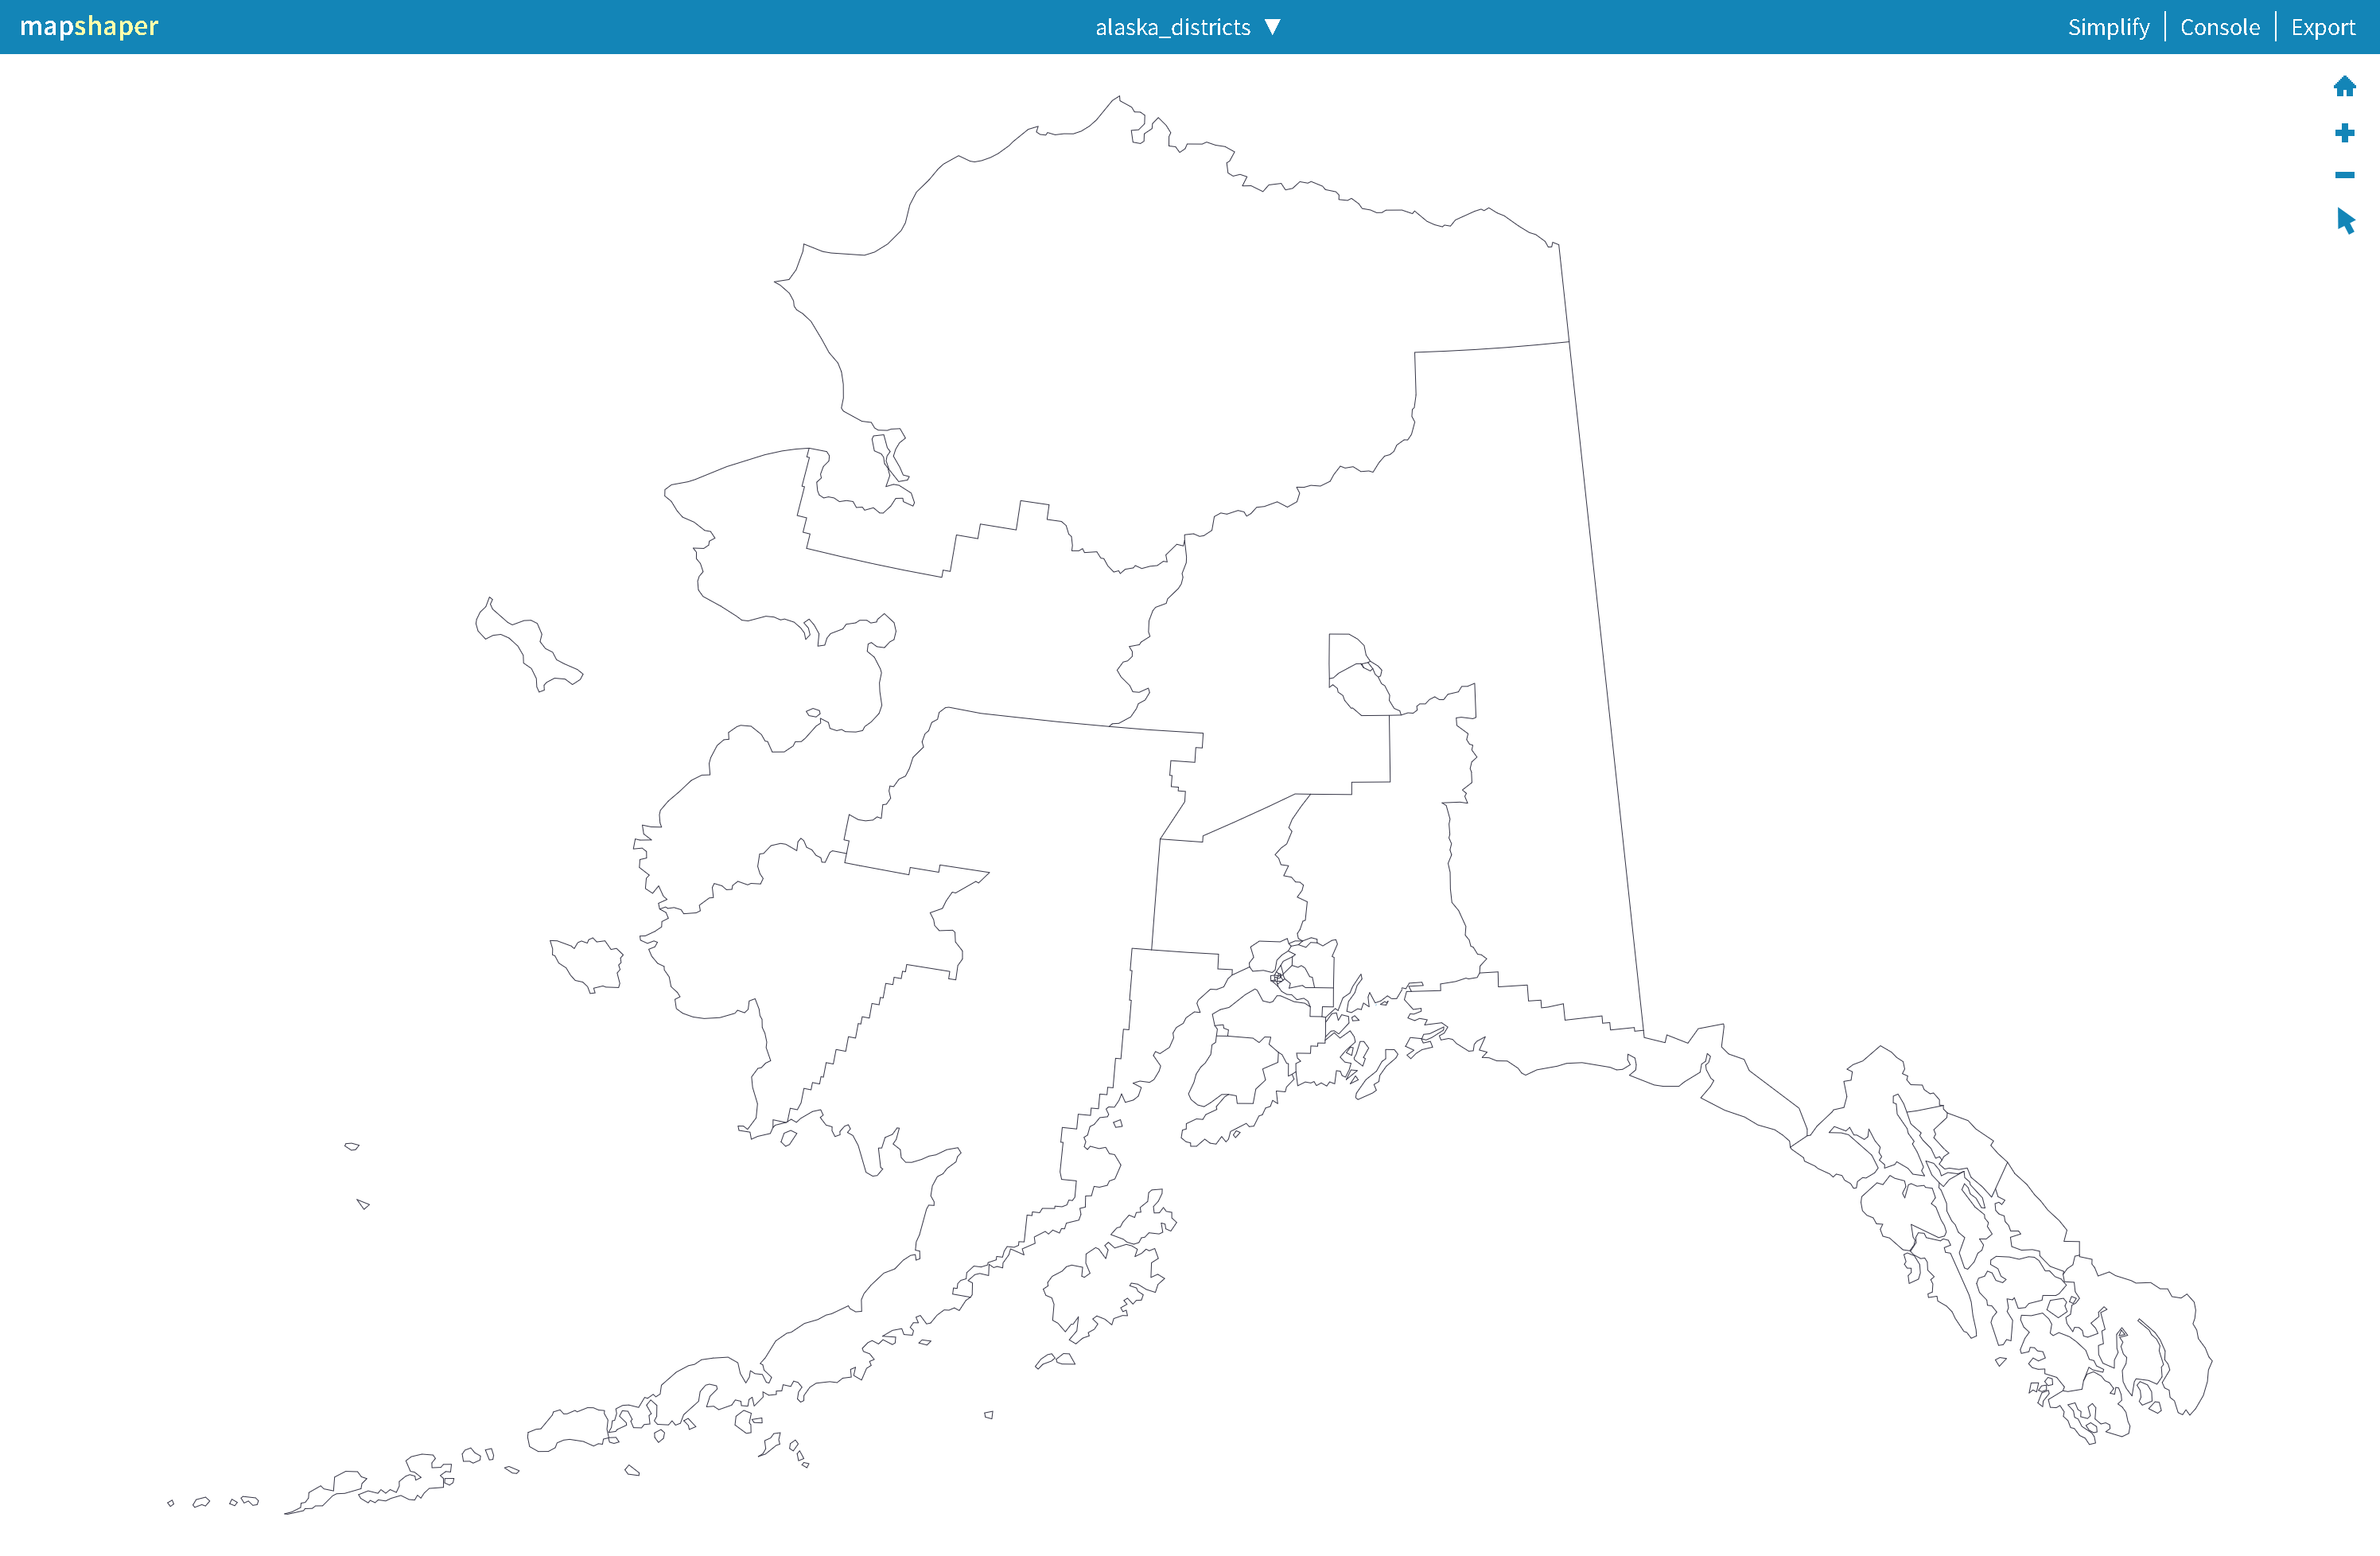
The result of these commands should output a TopoJSON file that looks like the image below:
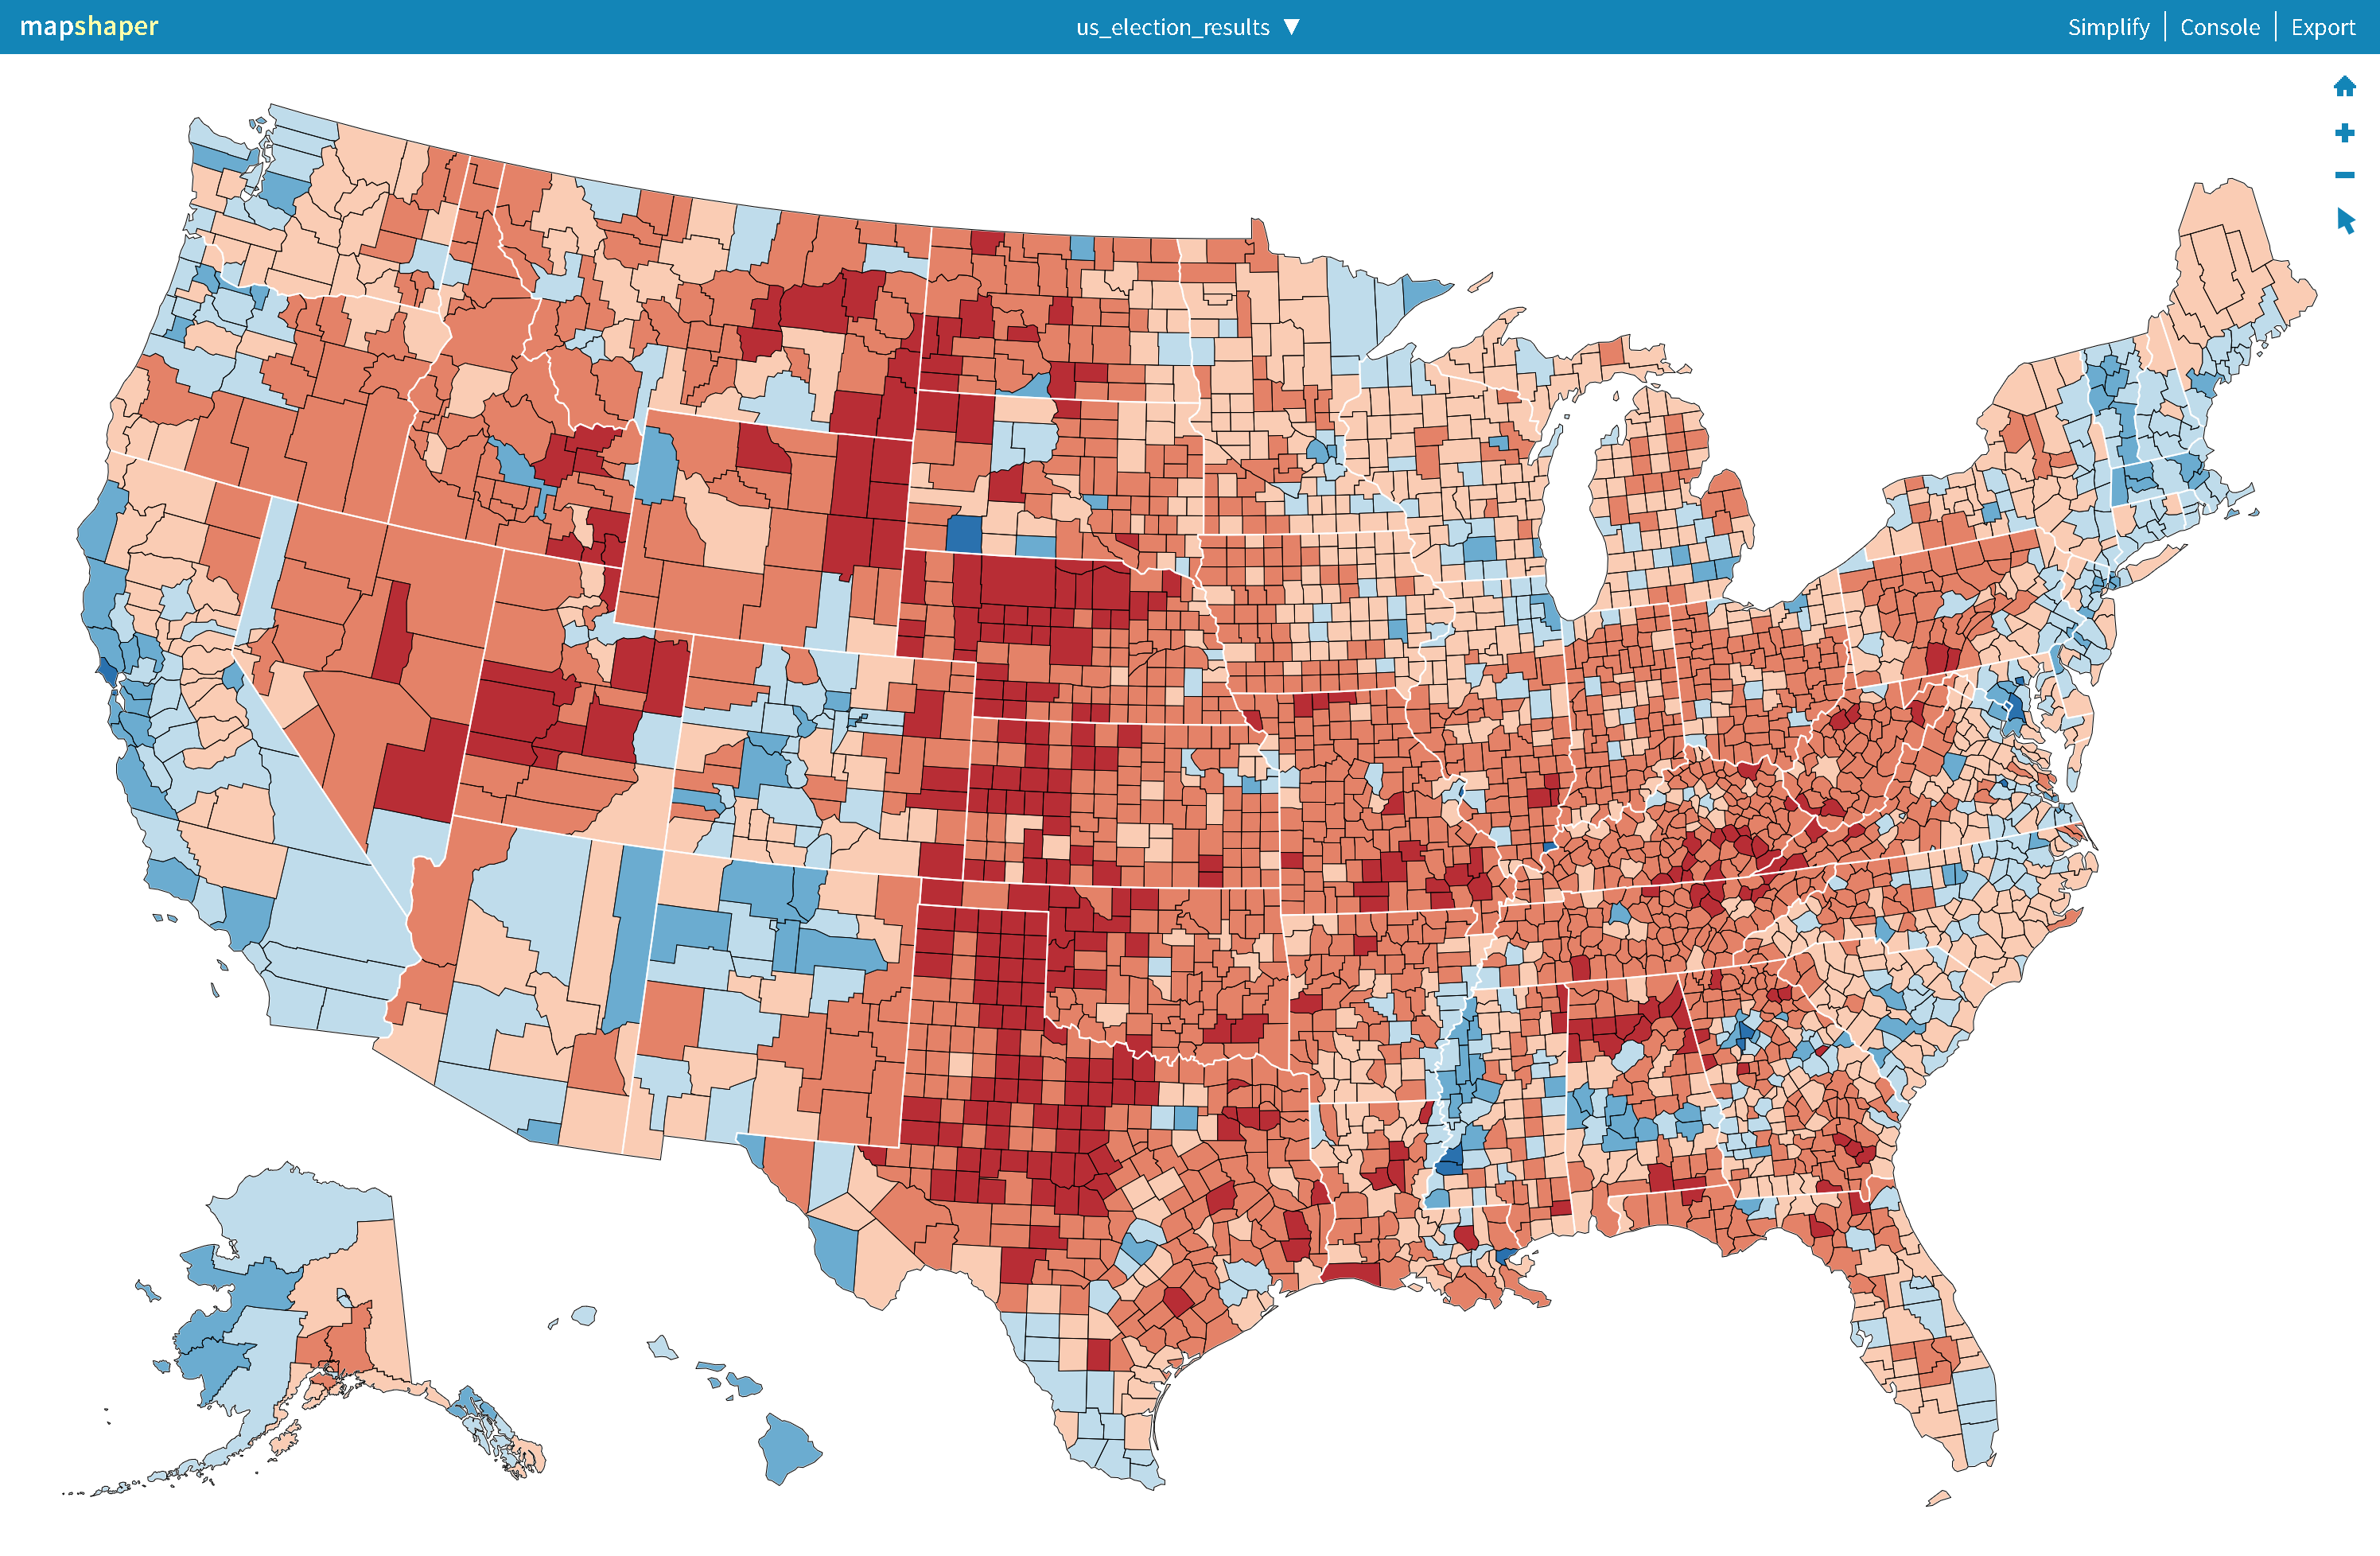
Our goal is to generate a single TopoJSON file that a) contains multiple geometry objects from the us_counties.json and alaska_districts.json TopoJSON files, b) colors the geographies by the results of the 2020 election, mapped to the standard Red-Blue quantiles, and c) displays three levels of geographic boundaries: county-, state-, and national-level. We also want to produce a SVG file that also displays these election results.
- Download 2020 U.S. county-level election results
curl 'https://raw.githubusercontent.com/tonmcg/US_County_Level_Election_Results_08-20/master/2020_US_County_Level_Presidential_Results.csv' \
    -o 2020_data.csv
- Combine and merge the
alaska_districts.jsonandus_counties.jsonlayers into a new layer - Add DOM attributes to the county-level output, inlcuding stroke, stroke-width, and class
- Output a new
us_district_boundaries.jsonTopoJSON file - Input the
us_district_boundarieslayer - Using the
-dissolvecommand withstate_fipsas the field to dissolve on, this step merges adjacent polygons on thestate_fipslayer, thereby erasing shared boundaries and showing only the state-level boundaries - Add DOM attributes to the state-level output, inlcuding stroke, stroke-width, and class
- Output a new
us_state_boundaries.jsonTopoJSON file - Input the
us_state_boundarieslayer - Using the
-dissolvecommand with no named input fields to dissolve on, this step merges adjacent polygons for the entire layer, thereby erasing all shared boundaries and showing only the national-level boundary - Add DOM attributes to the national-level output, inlcuding stroke, stroke-width, and class
- Output a new
us_boundaries.jsonTopoJSON file - Input the
us_district_boundaries.jsonTopoJSON file. We name the layerus_election_districts - Input the
2020_data.csvfile, containing the county-level results of the 2020 presidential election - Join the election data on to the
us_election_districtslayer - Use the
-colorizercommand to create a JavaScript function that accepts a numerical input and returns a color defined by a quantized range of values - Assign the returned color as the value in
fillDOM attribute - Ouptut a new
us_election_districtsTopoJSON file - Combine and merge the
us_election_districts.json,us_state_boundaries.json, andus_boundaries.jsonlayers into a new layer - Output a new
us_election_resultsTopoJOSN file - Output a new
us_election_resultsSVG file
mapshaper \
    -i alaska_districts.geojson us_counties.geojson combine-files name=us_district_boundaries\
    -merge-layers \
    -style class="county" stroke="#000000" fill="none" stroke-width="0.1" \
    -o format=topojson us_district_boundaries.json \
    -o format=geojson us_district_boundaries.geojson \
    -i us_district_boundaries.geojson name=us_state_boundaries \
    -dissolve state_fips \
    -style class="state" stroke="#ffffff" fill="none" stroke-width="1" \
    -o format=topojson us_state_boundaries.json \
    -o format=geojson us_state_boundaries.geojson \
    -i us_district_boundaries.geojson name=us_boundaries \
    -dissolve \
    -style class="us" stroke="#000000" fill="none" stroke-width="0.5" \
    -o format=topojson us_boundaries.json \
    -o format=geojson us_boundaries.geojson \
    -i us_district_boundaries.geojson name=us_election_districts \
    -i 2020_data.csv string-fields=county_fips name=2020_data \
    -join target=us_election_districts 2020_data keys=geoid,county_fips \
    -colorizer name=getColor colors='#2A71AE,#6BACD0,#BFDCEB,#FACCB4,#E48268,#B82D35' breaks=0.1667,0.3334,0.5,0.6667,0.8334 \
    -style fill='getColor(per_gop)' \
    -o format=topojson us_election_districts.json \
    -o format=geojson us_election_districts.geojson \
    -i us_election_districts.geojson us_state_boundaries.geojson us_boundaries.geojson combine-files name=us_election_results \
	-merge-layers force \
	-o format=topojson us_election_results.json \
    -o format=geojson us_election_results.geojson \
    -o us_election_results.svg
The result of these commands should output a TopoJSON file that looks like the following:
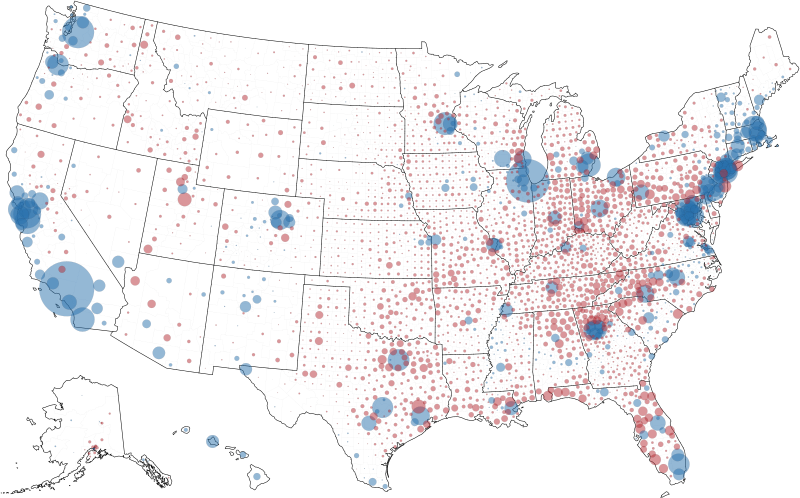
Dot density maps are useful to show where things are clustered. Showing raw counts of votes among U.S. counties rather than relative differences between U.S. counties, the dot density map below illustrates that the most votes tend to come from counties that house large, urban populations.
mapshaper \
    -i us_district_boundaries.geojson name=us_election_districts \
    -points inner + name=dots \
    -i 2020_data.csv string-fields=county_fips name=2020_data \
    -filter-fields county_fips,votes_gop,votes_dem \
    -each 'margin = votes_gop - votes_dem' \
    -each 'abs_margin = Math.abs(margin)' \
    -join target=dots 2020_data keys=geoid,county_fips \
    -sort abs_margin descending \
    -style r='Math.sqrt(abs_margin) * 0.02' \
    -style opacity=0.5 fill='margin > 0 ? "#B82D35": "#2A71AE"' \
    -lines state_fips target=us_election_districts \
    -style class="county" stroke="#ddd" fill="none" stroke-width="0.1" where='TYPE === "inner"' \
    -style class="us" stroke="#000000" fill="none" stroke-width="0.5" where='TYPE === "outer"' \
    -style class="state" stroke="#000000" fill="none" stroke-width="0.5" where='TYPE === "state_fips"' \
    -o us_dot_election_results.svg target=us_election_districts,dots
The result of these commands should output a SVG file that looks like the following:
Place in your favorite iPython / Jupyter notebook environment.
If you don't have one, get Docker and use:
./run-notebook.sh
in a shell based environment. Or open up the shell command and issue the docker command in a Windows environment.