Imperialist competitive algorithm is population based heuristic, which utilises some swarm intelligence like mechanisms and competition similar to genetic algorithm.
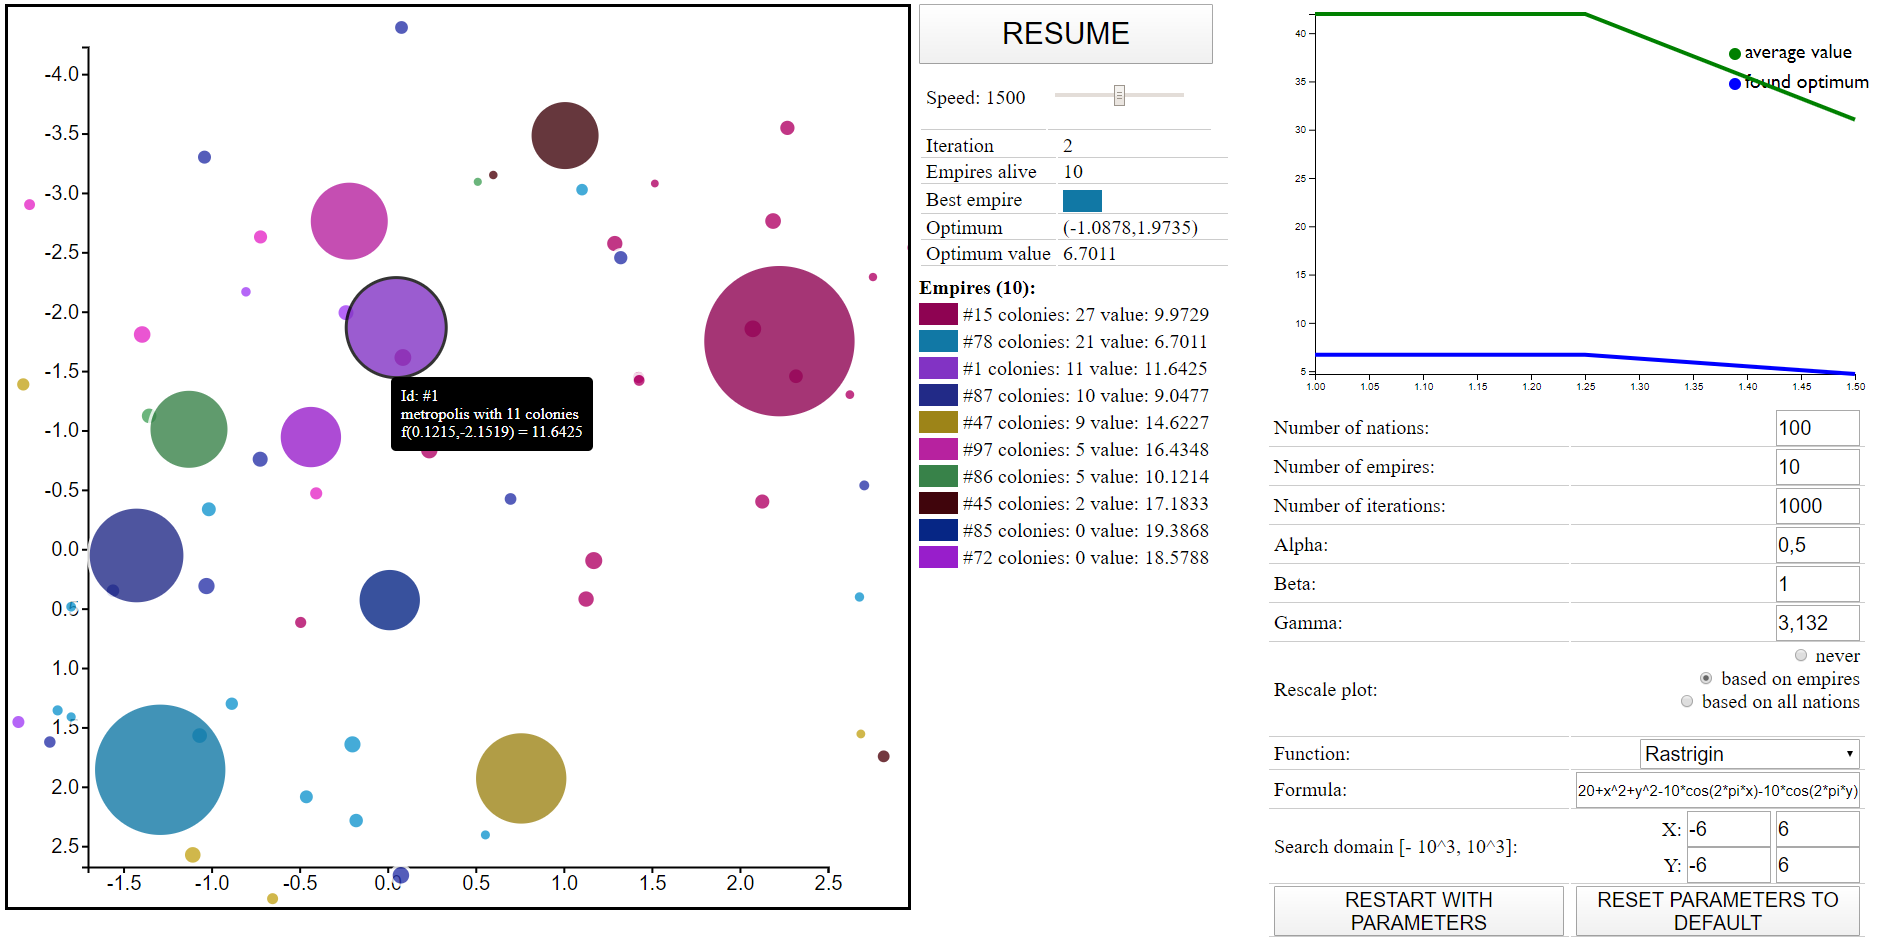
My implementation looks for minimum of given function. There are few predefined functions (Rastrigin, Ackley, Sphere, Rosenbrock, Himmelblau).
Big dots are metropolis(capitals/centers of empires), smaller ones are theirs colonies. Colonies are getting closer and closer to theirs metropolies. If they will find better solution in the process they become the new metropolis. Whole empires have one color.
Every iteration weakest empire loses one if its colonies, to other empire(the stronger empire the more likely it is to get a colony).
Copy/download repository and run index.html
or go to
https://tomsiemek.github.io/imperialistic-competitive-algorithm-visualisation/
- if everything is too big and doesnt fit the screen or it is too small use ctrl+[+/-] or ctrl+[mouse scroll]
- resume/stop to control visualisation
- change parameters on the right and click RESTART WITH PARAMETERS to apply
- if you messed up parameters click RESET PARAMETERS TO DEFAULT
- list on empires in the center
- hover on nation for tooltip
Alpha - [0, 1] - coefficient in calculating total empire power - how important are colonies in evaluation value of empire
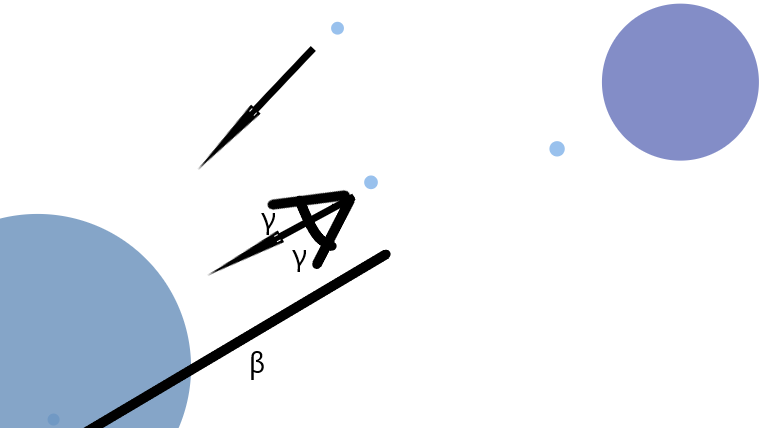
Beta - [1, ∞] - multiplier of maximum distance colony can "travel" in one iteration - how "explorative"of the space "behind" metropolis are the colonies
Gamma - [0, π] - maximum angle of deviation from line connecting centers - how "explorative" are colonies in their travel to the metropolis
It is made with pure javascript.
Libraries:
d3.js - making graphs
math.js - parsing mathematical expressions