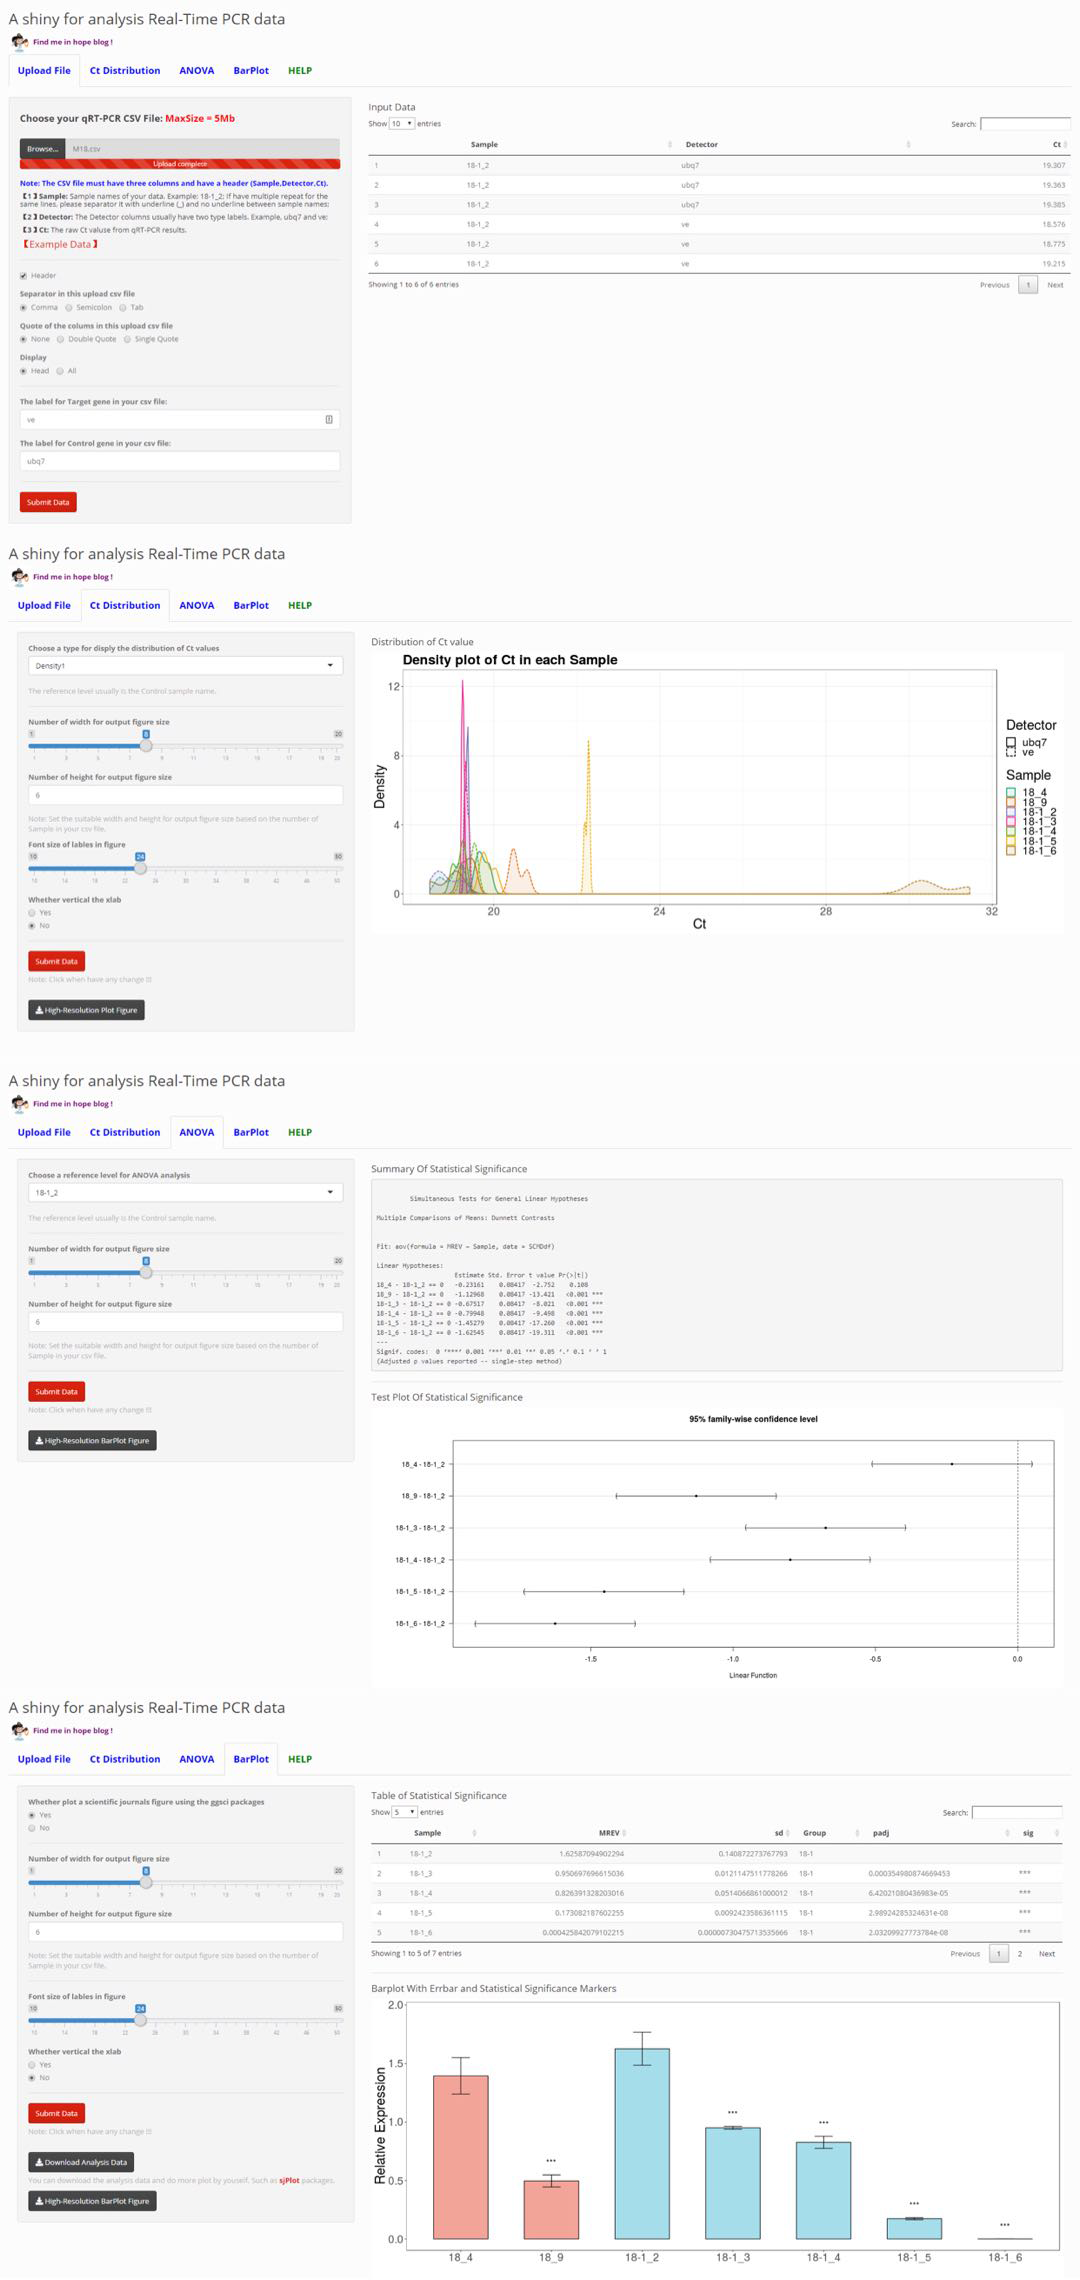
Auto-analysis for Real-Time PCR (qPCR) data.
This qPCR experiment usually have two group: Control (CK) and sample, and at least two type genes: Housekeeping Gene (HG) and Target Gene (TG). In our lab this usually label with ub7 and ve.
Congratulations! A alternative way to analysis of qPCR data can be find in : A shiny for analysis qRT-PCR data
- python
- collections
- itertools
- csv
- pandas
- numpy
- sys
- R
- ggplot2
- gridExtra
- ggthemes
- ggsci
- reshape2
- dplyr
There is a example input data in Example_data/.
./qPCR.sh A B C D E F
Argument:
- A: absolute path of Input data (e,
/public/home/hope/qPCR) - B: Input Data (e, raw_input_qPCR.csv)
- C: Width of output pdf file
- D: Height of output pdf file
- E: Whether plot a scientific journals figure using the ggsci packages (yes or no)
- F: The sample name used as reference level in ANOVA analysis
Running on the example data:
./qPCR.sh /public/home/hope/qPCR raw_input_qPCR.csv 18 8 no CK
- raw_input_qPCR_ubq7.csv
- raw_input_qPCR_ve.csv
- RQraw_input_qPCR_ve.csv
- RQraw_input_qPCR_ubq7.csv
- raw_input_qPCR_R.csv
- raw_input_qPCR_ANOVA.csv
- Pro_raw_input_qPCR_R.csv
- Pro_raw_input_qPCR.pdf
- raw_input_qPCR_T-test.pdf